| Param | Original file | Final file |
|---|---|---|
| Filename | modeM0/AS1A14_004T05_9000006502_53620cztM0_level2.fits | modeM0/AS1A14_004T05_9000006502_53620cztM0_level2_quad_clean.evt |
| Size (bytes) | 1,124,066,880 | 86,074,560 |
| Size | 1.0 GB | 82.1 MB |
| Events in quadrant A | 14,712,761 | 320,538 |
| Events in quadrant B | 5,891,959 | 747,142 |
| Events in quadrant C | 11,597,795 | 454,203 |
| Events in quadrant D | 8,829,983 | 562,810 |
| Mode SS | |||
|---|---|---|---|
| Quadrant | BADHDUFLAG | Total packets | Discarded packets |
| A | 0 | 150 | 0 |
| B | 0 | 150 | 0 |
| C | 0 | 150 | 0 |
| D | 0 | 150 | 0 |
| Mode M0 | |||
|---|---|---|---|
| Quadrant | BADHDUFLAG | Total packets | Discarded packets |
| A | 0 | 48872 | 0 |
| B | 0 | 22607 | 2 |
| C | 0 | 39558 | 0 |
| D | 0 | 31482 | 0 |
| Quadrant | Total seconds | Saturated seconds | Saturation percentage |
|---|---|---|---|
| A | 7485 | 4513 | 60.293921% |
| B | 7485 | 315 | 4.208417% |
| C | 7485 | 2825 | 37.742151% |
| D | 7485 | 1233 | 16.472946% |
Noise dominated data is calculated using 1-second bins in cleaned event files. If a bin has >2000 counts, and if more than 50% of those come from <1% of pixels, then it is considered to be noise-dominated and hence unusable.
| Quadrant | # 1 sec bins | Bins with >0 counts | Bins with >2000 counts | High rate bins dominated by noise | Noise dominated (total time) | Noise dominated (detector-on time) | Marked lightcurve |
|---|---|---|---|---|---|---|---|
| A | 7484 | 7484 | 4515 | 4515 | 60.33% | 60.33% | 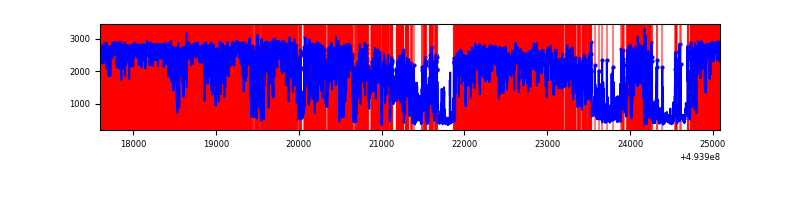 |
| B | 7485 | 7485 | 248 | 248 | 3.31% | 3.31% | 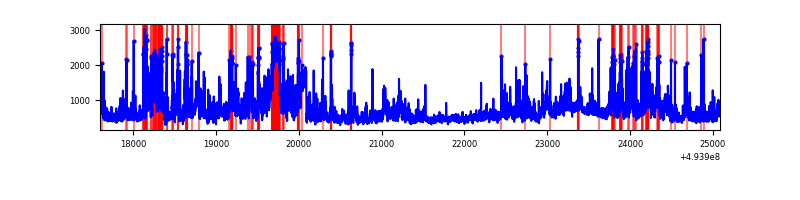 |
| C | 7484 | 7484 | 2719 | 2719 | 36.33% | 36.33% | 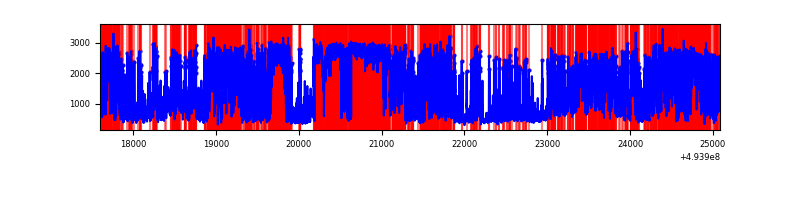 |
| D | 7485 | 7485 | 1245 | 1245 | 16.63% | 16.63% | 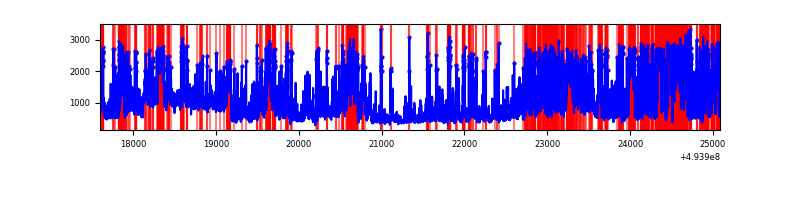 |
Top three noisy pixels from each quadrant. If the there are fewer than three noisy pixels in the level2.evt file, extra rows are filled as -1
| Pixel properties | Quadrant properties | ||||||
|---|---|---|---|---|---|---|---|
| Quadrant | DetID | PixID | Counts | Sigma | Mean | Median | Sigma |
| A | 3 | 78 | 7742210 | 51019.88 | 607 | 590 | 151.7 |
| A | 4 | 95 | 3500198 | 23063.59 | 607 | 590 | 151.7 |
| A | 15 | 174 | 306476 | 2015.89 | 607 | 590 | 151.7 |
| B | 15 | 20 | 1014978 | 5967.61 | 793 | 767 | 170.0 |
| B | 10 | 254 | 622998 | 3661.2 | 793 | 767 | 170.0 |
| B | 5 | 172 | 239162 | 1402.71 | 793 | 767 | 170.0 |
| C | 15 | 224 | 4779731 | 26692.82 | 646 | 639 | 179.0 |
| C | 1 | 241 | 2869508 | 16023.59 | 646 | 639 | 179.0 |
| C | 13 | 3 | 371862 | 2073.4 | 646 | 639 | 179.0 |
| D | 8 | 176 | 3133546 | 14777.57 | 741 | 709 | 212.0 |
| D | 10 | 172 | 831099 | 3916.94 | 741 | 709 | 212.0 |
| D | 12 | 34 | 483900 | 2279.21 | 741 | 709 | 212.0 |
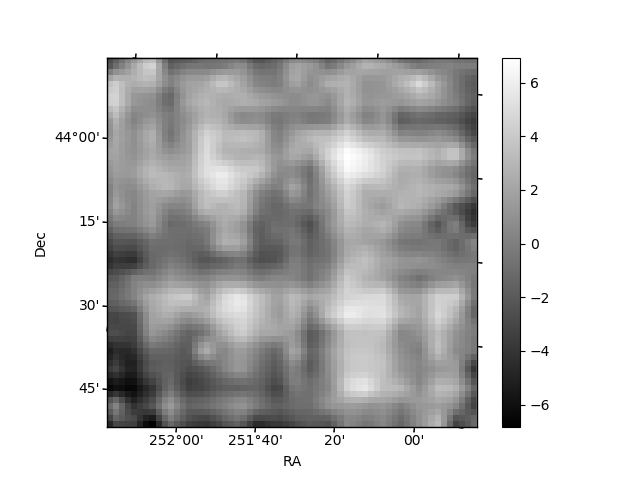
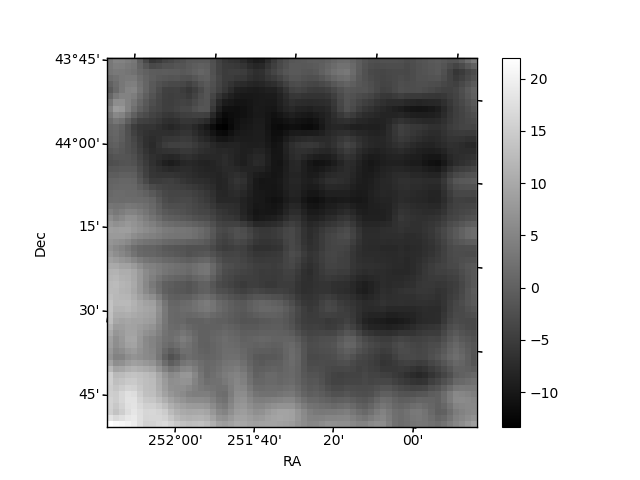
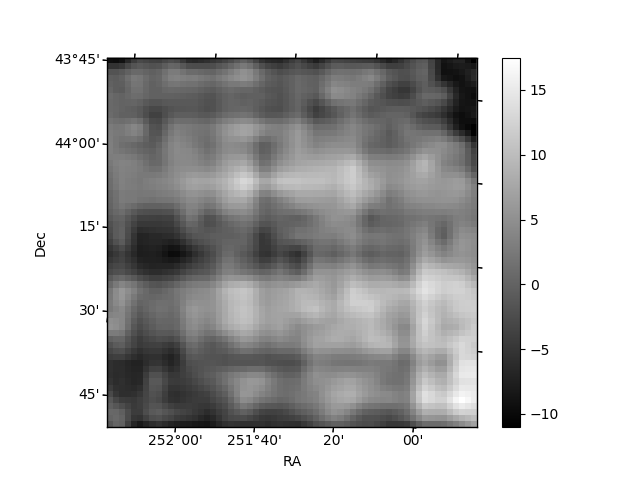
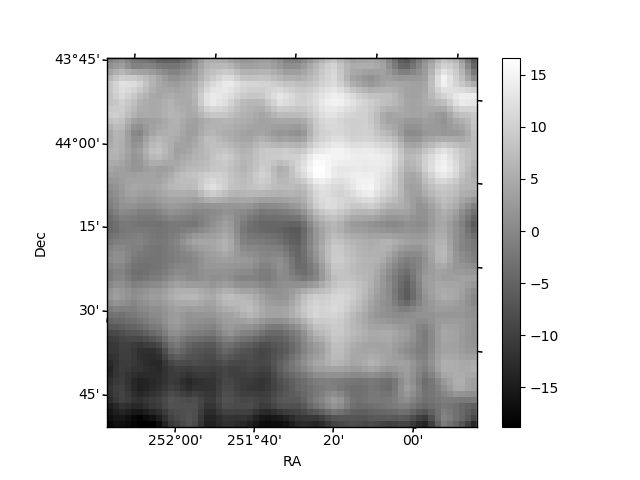
Histogram calculated using DETX and DETY for each event in the final _common_clean file
| Quadrant A | 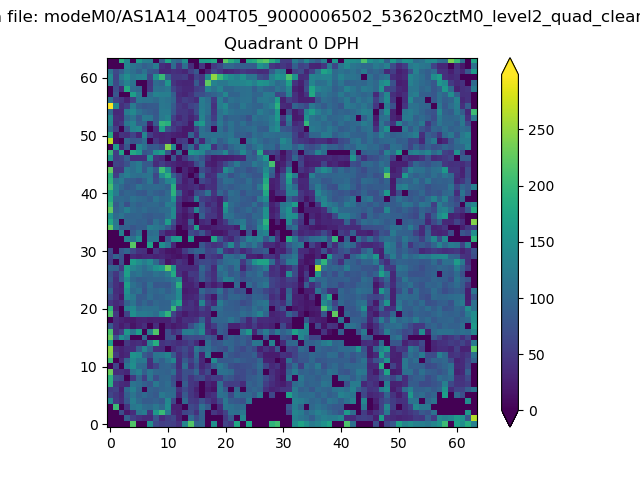 |
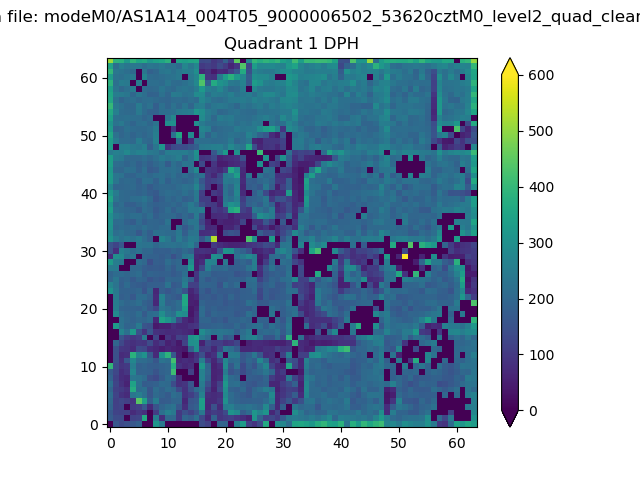 |
Quadrant B |
|---|---|---|---|
| Quadrant D | 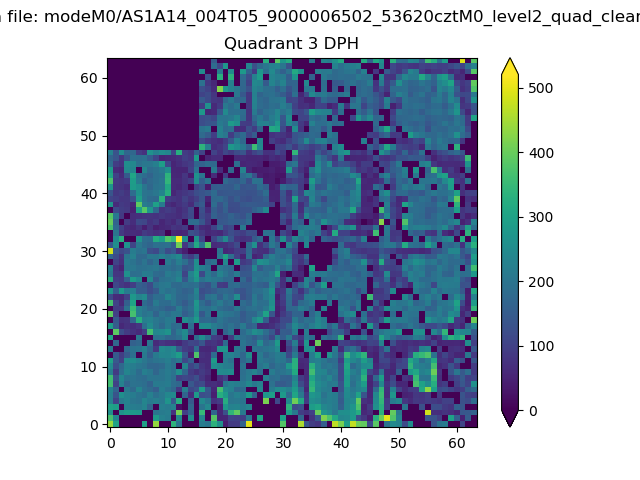 |
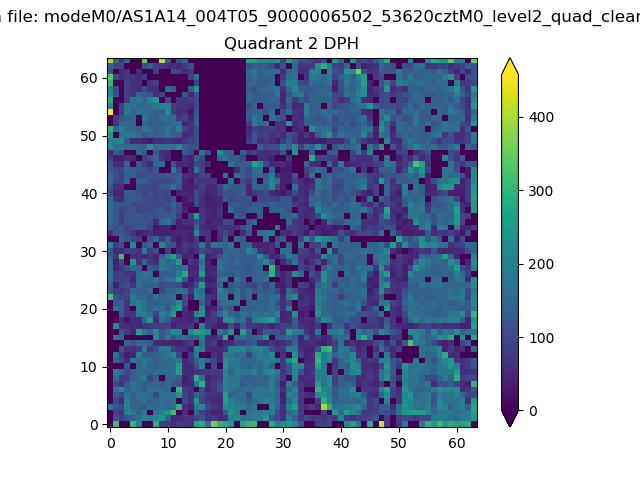 |
Quadrant C |
| Plot type | Count rate plots | Images |
|---|---|---|
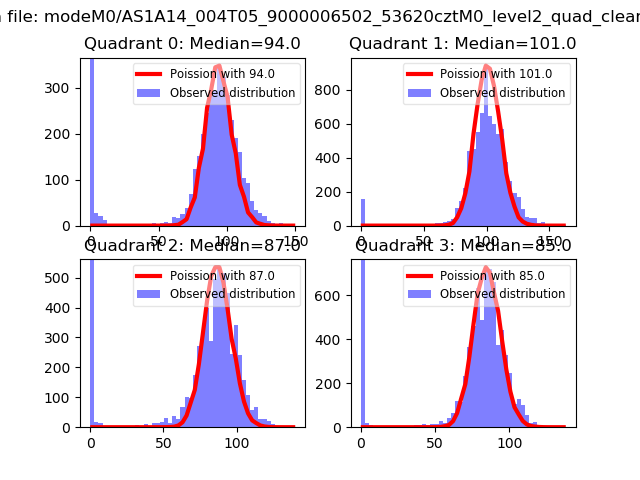
| Comparison with Poisson distribution Blue bars denote a histogram of data divided into 1 sec bins. Red curve is a Poisson curve with rate = median count rate of data. |
 |
 |
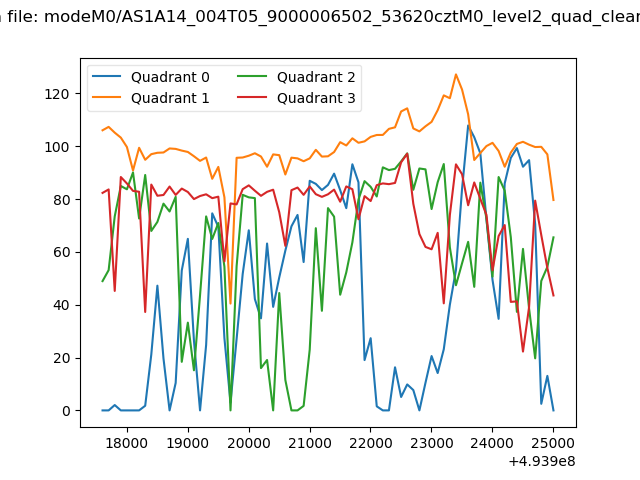
| Quadrant-wise count rates Data is divided into 100 sec bins |
 |
|
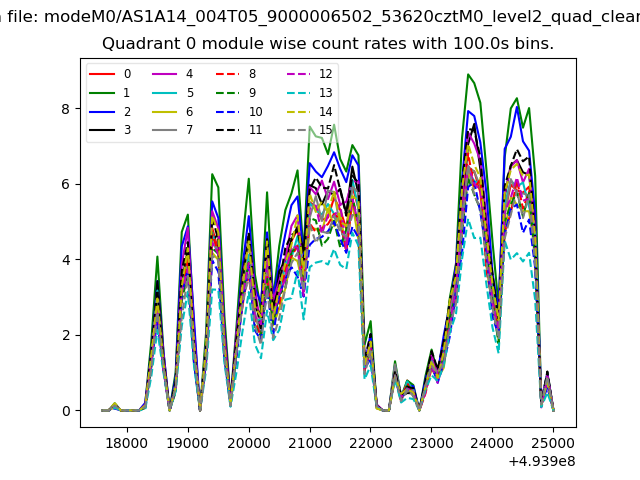
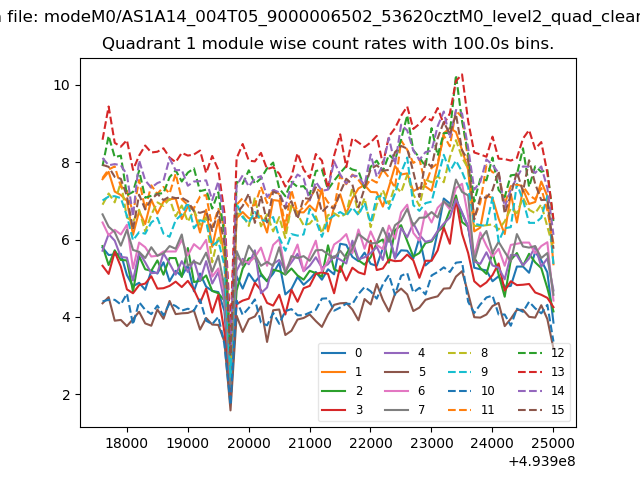
| Module-wise count rates for Quadrant A Data is divided into 100 sec bins |
 |
 |
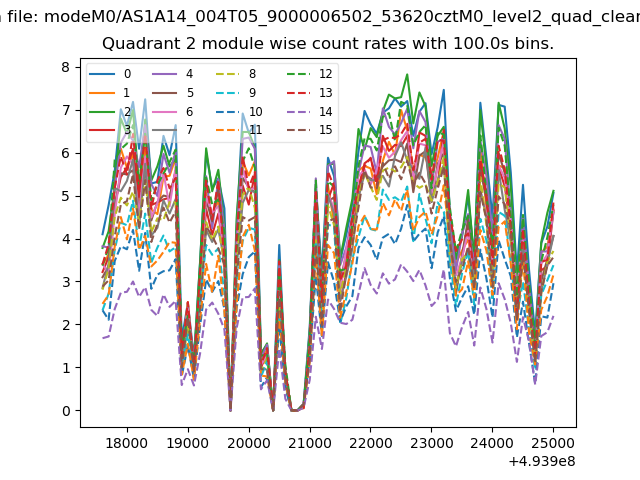
| Module-wise count rates for Quadrant B Data is divided into 100 sec bins |
 |
 |
| Module-wise count rates for Quadrant C Data is divided into 100 sec bins |
 |
 |
| Module-wise count rates for Quadrant D Data is divided into 100 sec bins |
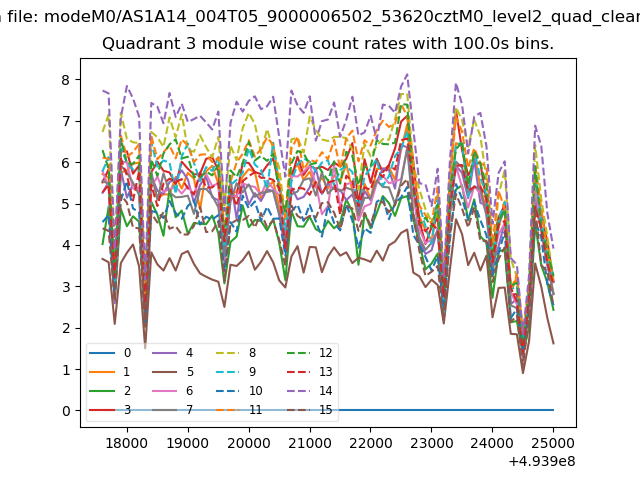 |
 |
| Parameter | Plot |
|---|---|
| CZT HV Monitor | 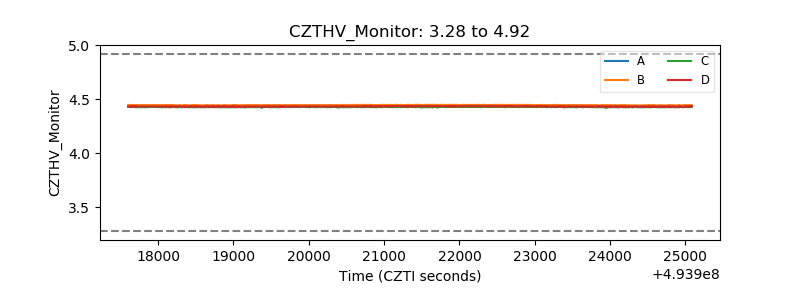 |
| D_VDD | 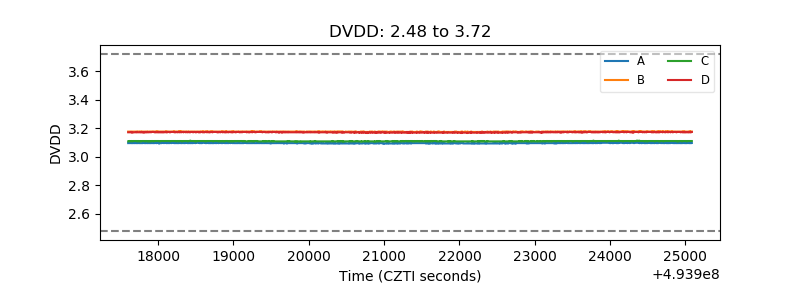 |
| Temperature 1 | 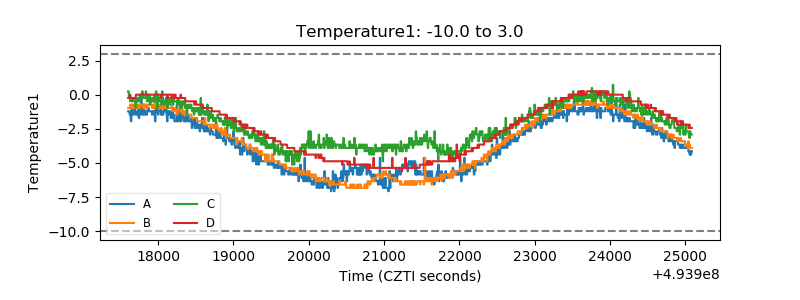 |
| Veto HV Monitor | 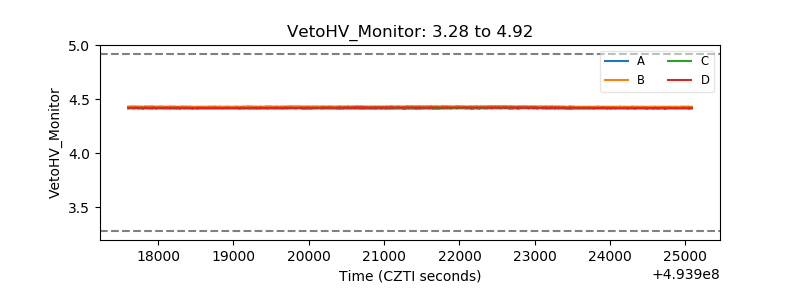 |
| Veto LLD | 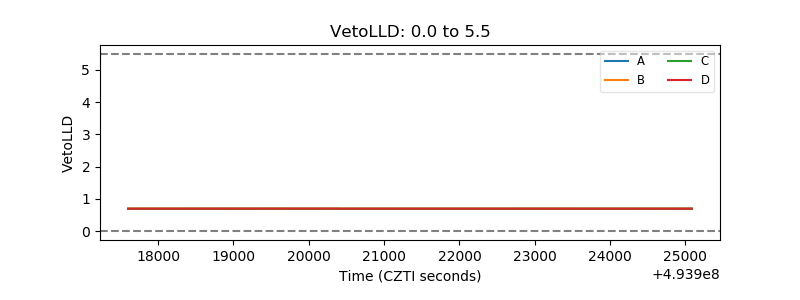 |
| Alpha Counter | 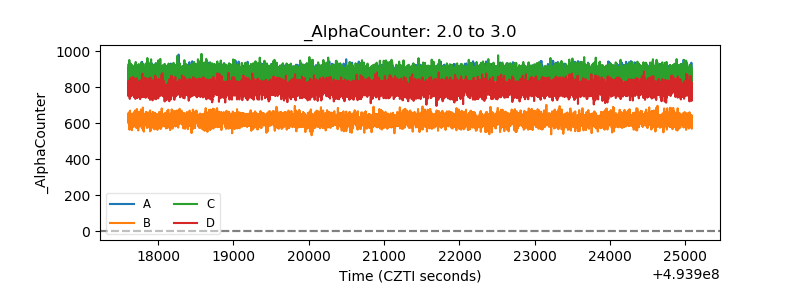 |
| _CPM_Rate | 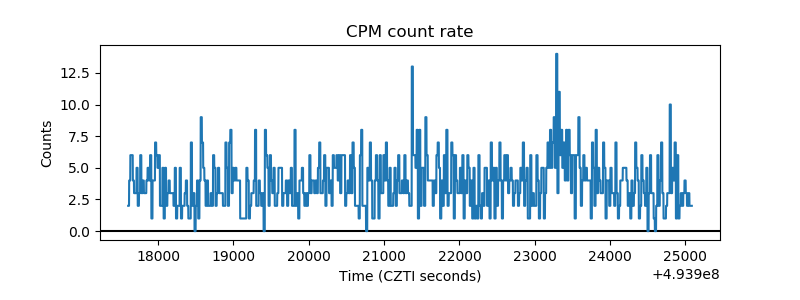 |
| CZT Counter | 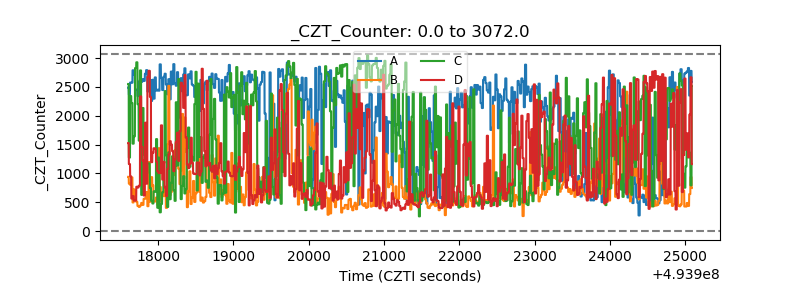 |
| +2.5 Volts monitor |  |
| +5 Volts monitor |  |
| _ROLL_ROT | 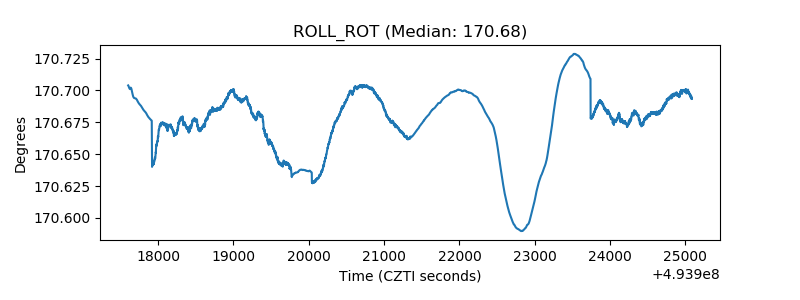 |
| _Roll_DEC | 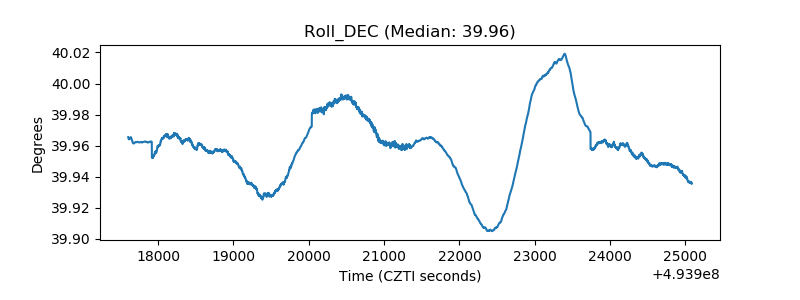 |
| _Roll_RA | 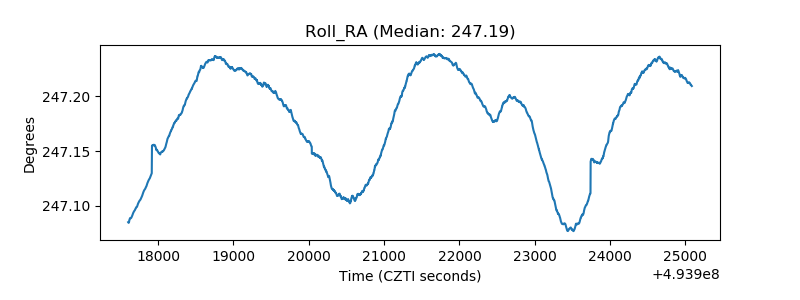 |
| Veto Counter | 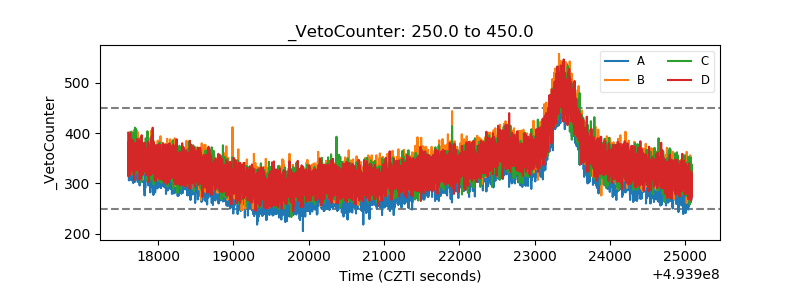 |