| Param | Original file | Final file |
|---|---|---|
| Filename | modeM0/AS1A14_004T05_9000006502_53621cztM0_level2.fits | modeM0/AS1A14_004T05_9000006502_53621cztM0_level2_quad_clean.evt |
| Size (bytes) | 1,089,792,000 | 93,098,880 |
| Size | 1.0 GB | 88.8 MB |
| Events in quadrant A | 11,865,639 | 504,652 |
| Events in quadrant B | 6,147,972 | 752,360 |
| Events in quadrant C | 11,696,492 | 488,318 |
| Events in quadrant D | 10,030,134 | 531,290 |
| Mode SS | |||
|---|---|---|---|
| Quadrant | BADHDUFLAG | Total packets | Discarded packets |
| A | 0 | 156 | 0 |
| B | 0 | 156 | 0 |
| C | 0 | 156 | 0 |
| D | 0 | 156 | 0 |
| Mode M0 | |||
|---|---|---|---|
| Quadrant | BADHDUFLAG | Total packets | Discarded packets |
| A | 0 | 40596 | 0 |
| B | 0 | 23679 | 0 |
| C | 0 | 40169 | 0 |
| D | 0 | 35148 | 6 |
| Quadrant | Total seconds | Saturated seconds | Saturation percentage |
|---|---|---|---|
| A | 7786 | 2865 | 36.796815% |
| B | 7786 | 504 | 6.473157% |
| C | 7787 | 2776 | 35.649159% |
| D | 7786 | 1943 | 24.955048% |
Noise dominated data is calculated using 1-second bins in cleaned event files. If a bin has >2000 counts, and if more than 50% of those come from <1% of pixels, then it is considered to be noise-dominated and hence unusable.
| Quadrant | # 1 sec bins | Bins with >0 counts | Bins with >2000 counts | High rate bins dominated by noise | Noise dominated (total time) | Noise dominated (detector-on time) | Marked lightcurve |
|---|---|---|---|---|---|---|---|
| A | 7786 | 7786 | 2779 | 2779 | 35.69% | 35.69% | 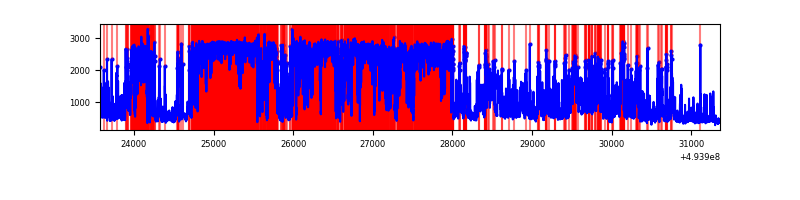 |
| B | 7786 | 7786 | 238 | 238 | 3.06% | 3.06% | 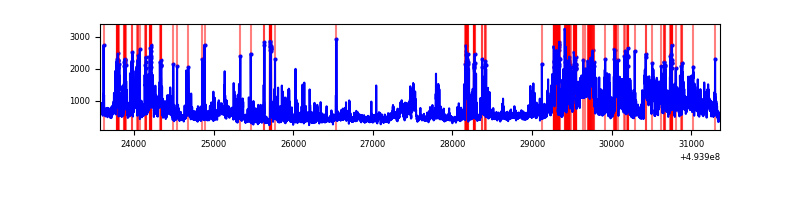 |
| C | 7786 | 7786 | 2685 | 2685 | 34.48% | 34.48% | 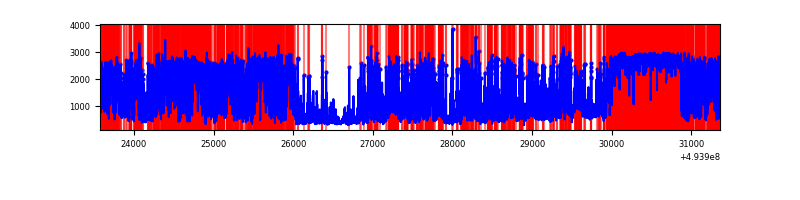 |
| D | 7786 | 7786 | 1970 | 1970 | 25.30% | 25.30% | 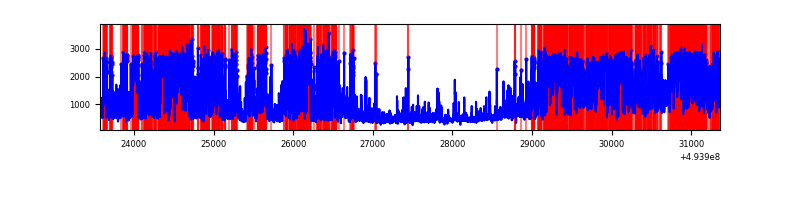 |
Top three noisy pixels from each quadrant. If the there are fewer than three noisy pixels in the level2.evt file, extra rows are filled as -1
| Pixel properties | Quadrant properties | ||||||
|---|---|---|---|---|---|---|---|
| Quadrant | DetID | PixID | Counts | Sigma | Mean | Median | Sigma |
| A | 3 | 78 | 6586116 | 37367.08 | 706 | 689 | 176.2 |
| A | 8 | 249 | 635566 | 3602.42 | 706 | 689 | 176.2 |
| A | 4 | 95 | 540043 | 3060.41 | 706 | 689 | 176.2 |
| B | 15 | 20 | 913130 | 5244.96 | 813 | 785 | 173.9 |
| B | 10 | 28 | 559331 | 3211.01 | 813 | 785 | 173.9 |
| B | 7 | 0 | 539563 | 3097.37 | 813 | 785 | 173.9 |
| C | 15 | 224 | 4056667 | 21848.2 | 671 | 666 | 185.6 |
| C | 1 | 241 | 2212123 | 11912.31 | 671 | 666 | 185.6 |
| C | 13 | 3 | 614574 | 3306.9 | 671 | 666 | 185.6 |
| D | 8 | 176 | 5184602 | 24386.71 | 740 | 708 | 212.6 |
| D | 7 | 70 | 307726 | 1444.31 | 740 | 708 | 212.6 |
| D | 10 | 172 | 307560 | 1443.53 | 740 | 708 | 212.6 |
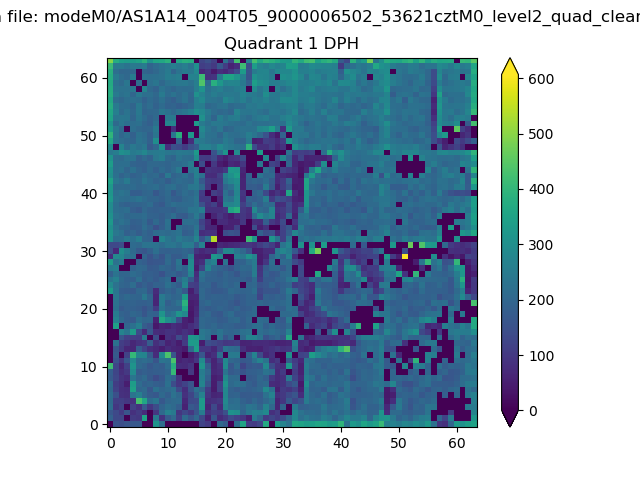
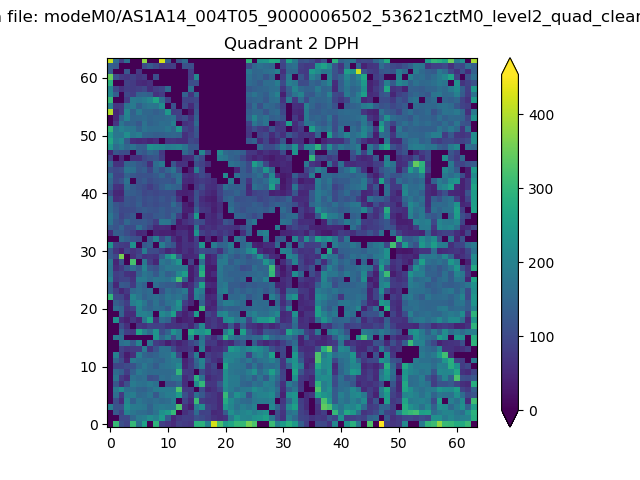
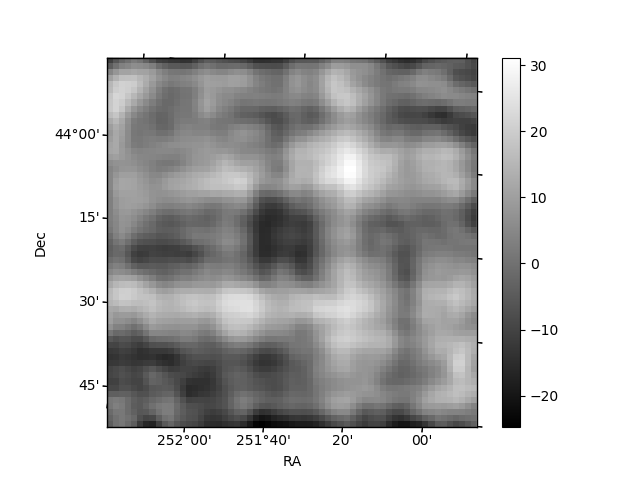
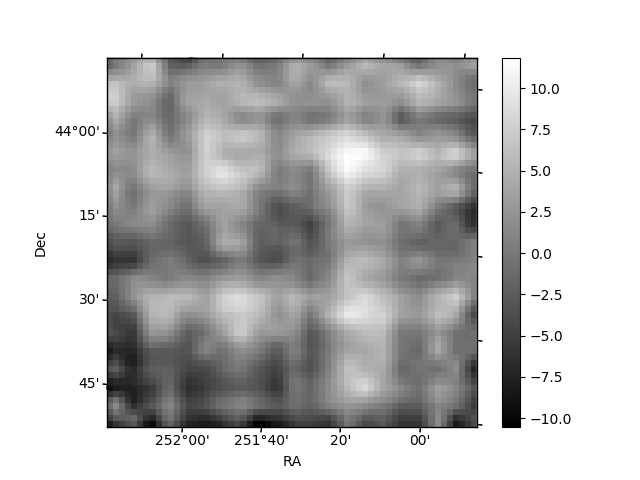
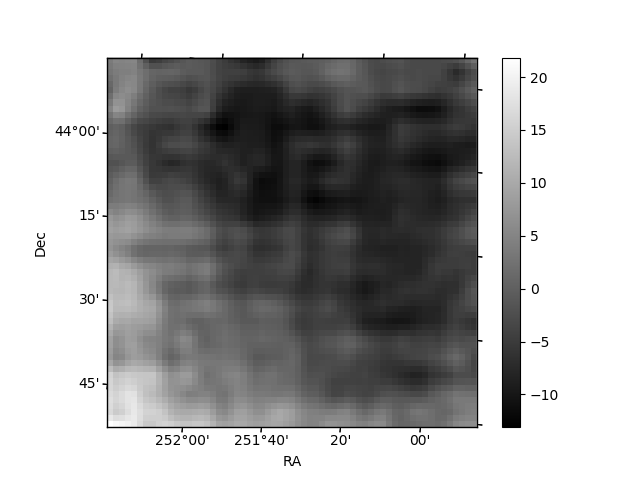
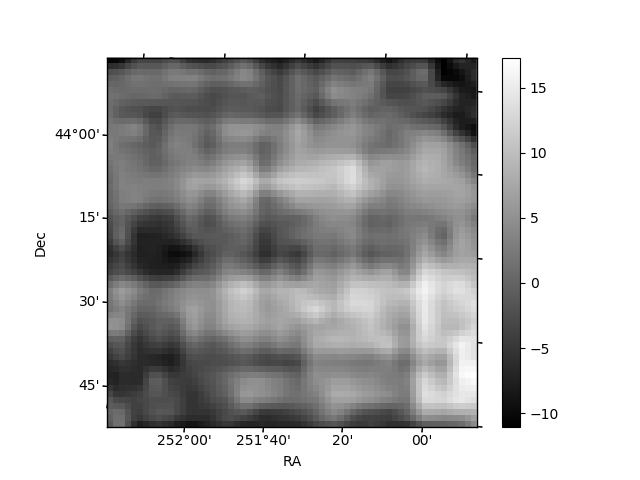
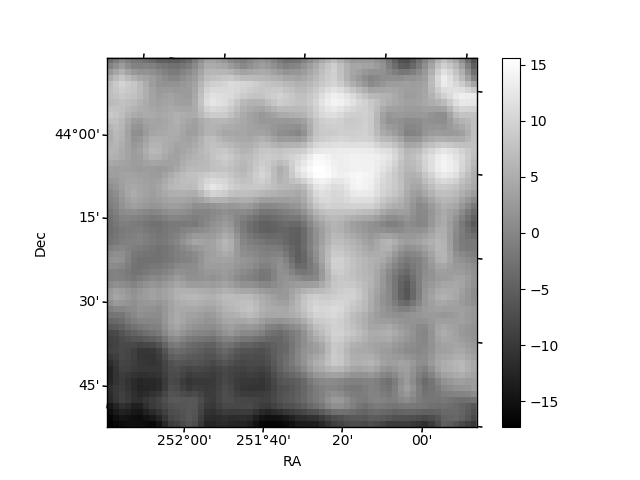
Histogram calculated using DETX and DETY for each event in the final _common_clean file
| Quadrant A |  |
 |
Quadrant B |
|---|---|---|---|
| Quadrant D | 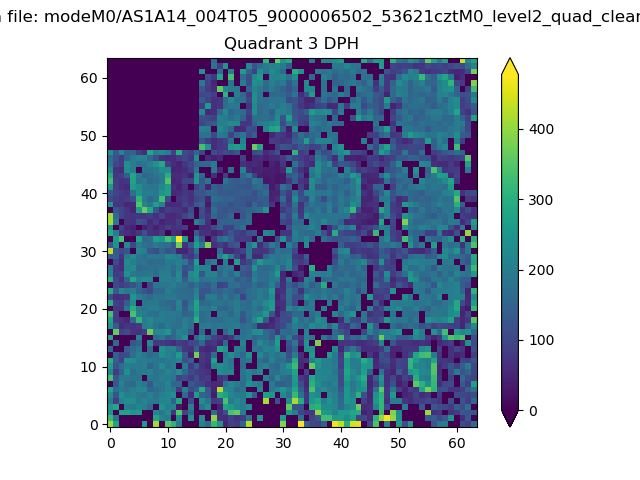 |
 |
Quadrant C |
| Plot type | Count rate plots | Images |
|---|---|---|
| Comparison with Poisson distribution Blue bars denote a histogram of data divided into 1 sec bins. Red curve is a Poisson curve with rate = median count rate of data. |
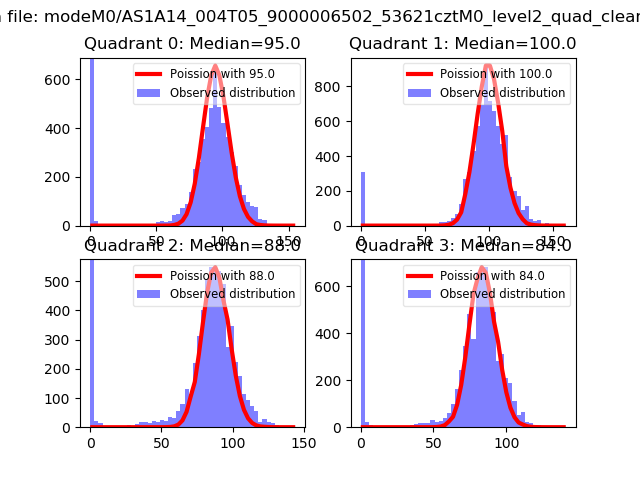 |
 |
| Quadrant-wise count rates Data is divided into 100 sec bins |
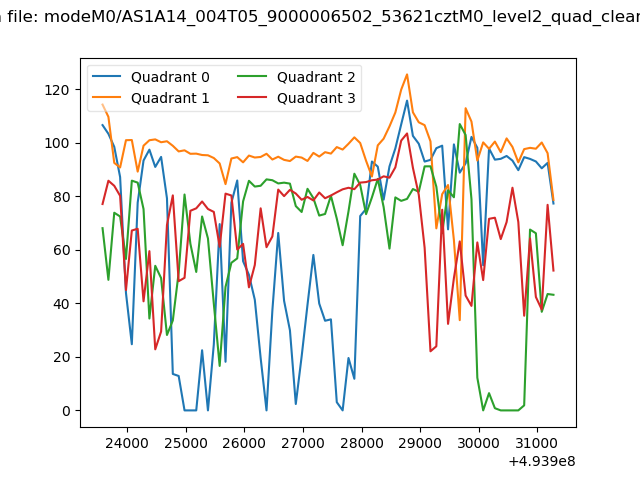 |
|
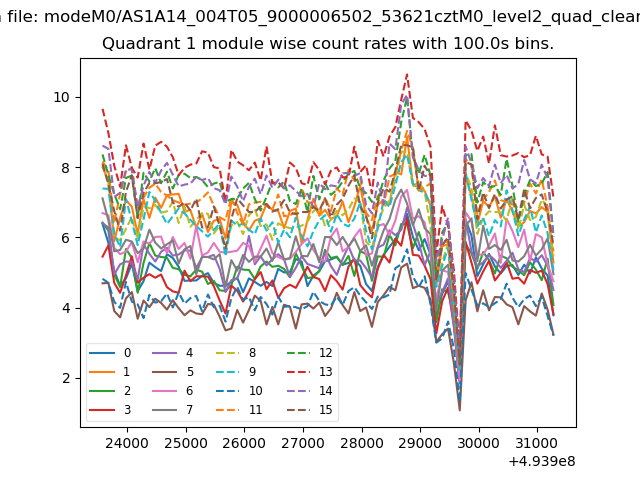
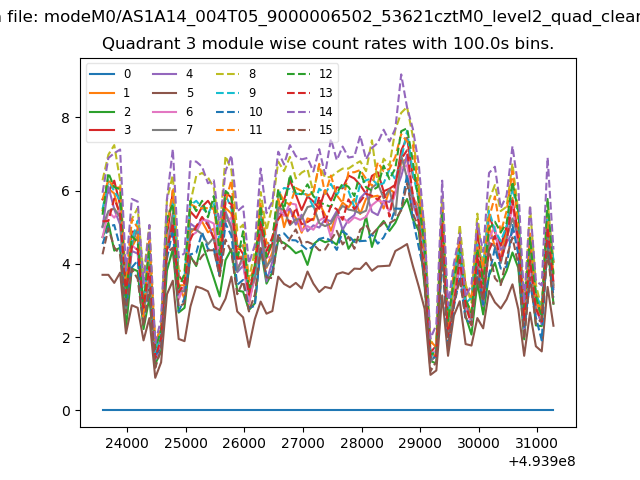
| Module-wise count rates for Quadrant A Data is divided into 100 sec bins |
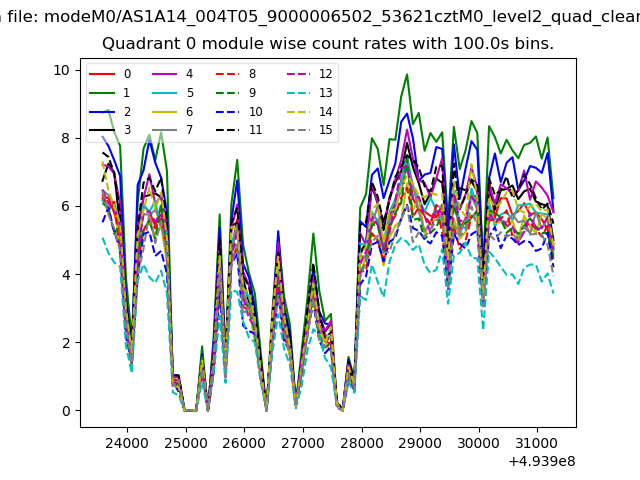 |
 |
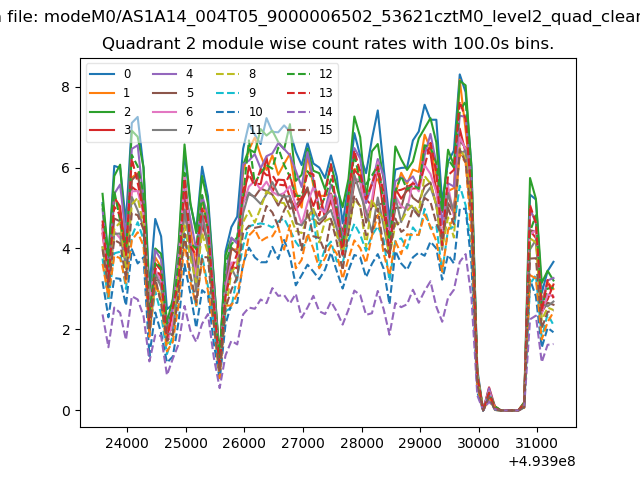
| Module-wise count rates for Quadrant B Data is divided into 100 sec bins |
 |
 |
| Module-wise count rates for Quadrant C Data is divided into 100 sec bins |
 |
 |
| Module-wise count rates for Quadrant D Data is divided into 100 sec bins |
 |
 |
| Parameter | Plot |
|---|---|
| CZT HV Monitor | 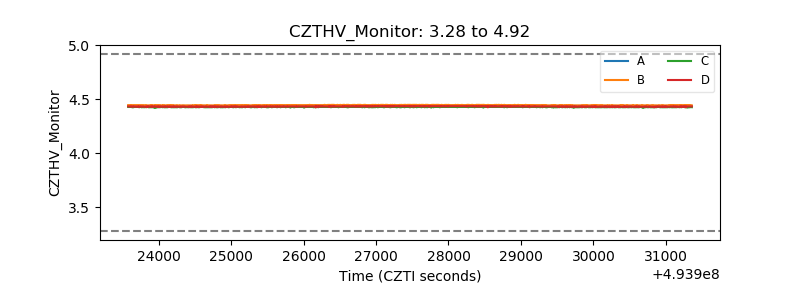 |
| D_VDD | 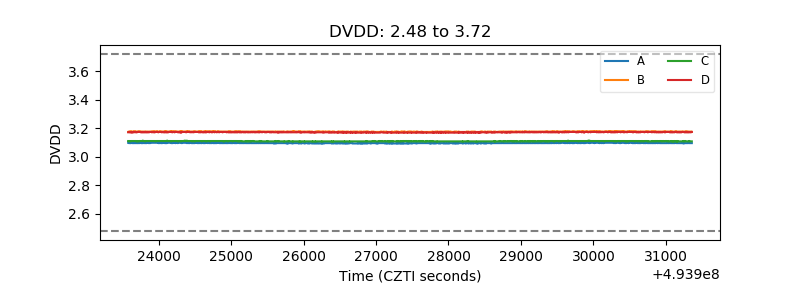 |
| Temperature 1 | 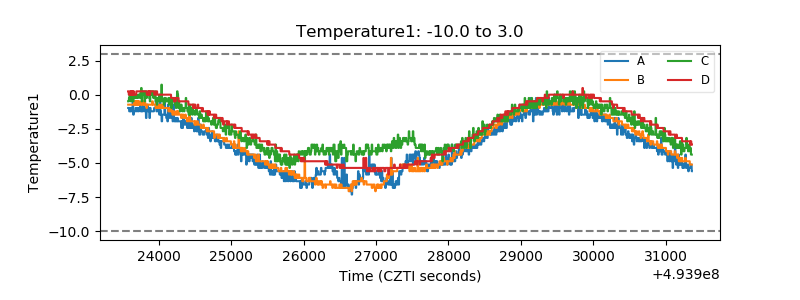 |
| Veto HV Monitor |  |
| Veto LLD | 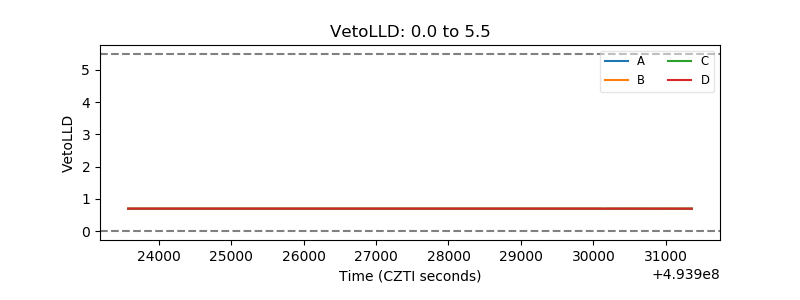 |
| Alpha Counter | 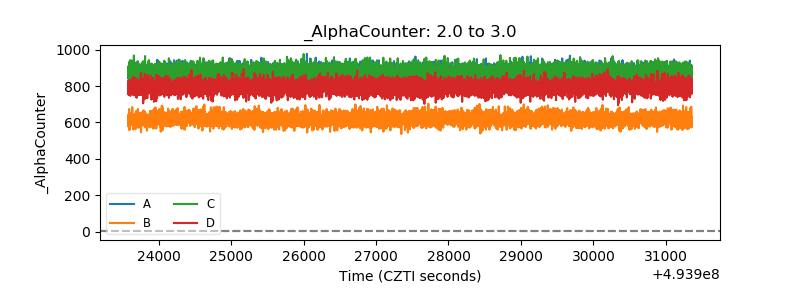 |
| _CPM_Rate | 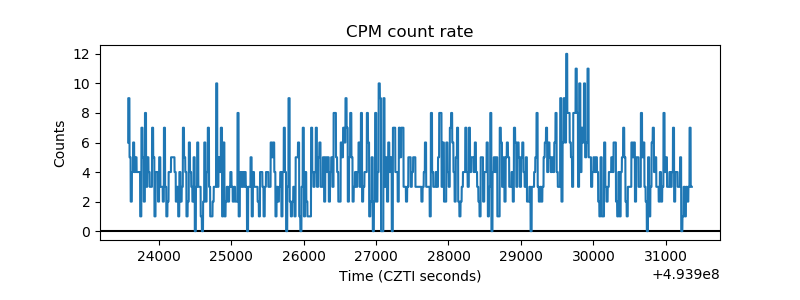 |
| CZT Counter | 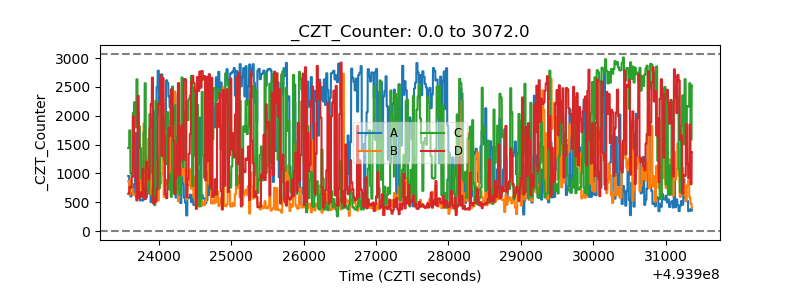 |
| +2.5 Volts monitor |  |
| +5 Volts monitor |  |
| _ROLL_ROT | 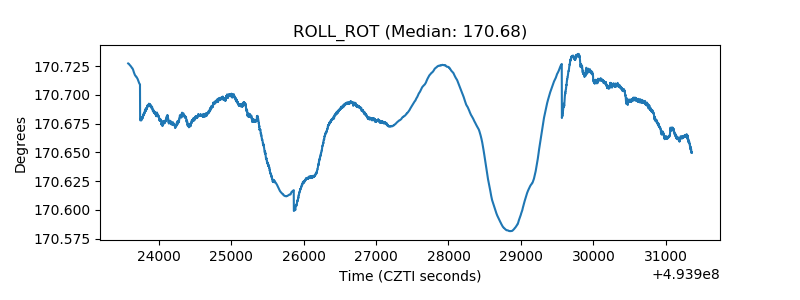 |
| _Roll_DEC | 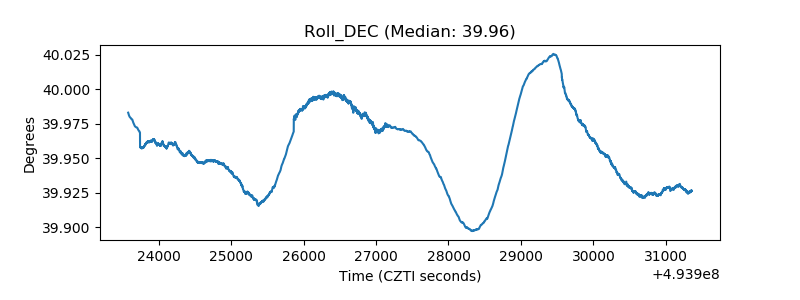 |
| _Roll_RA | 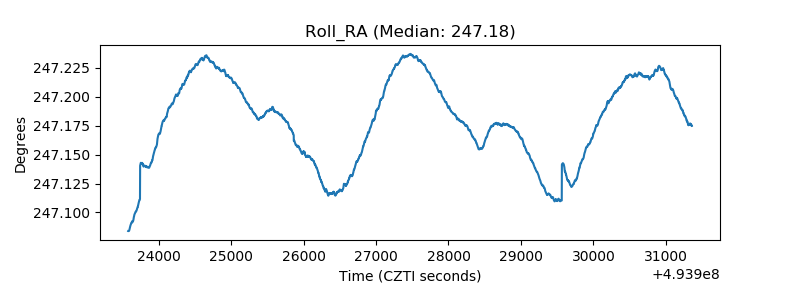 |
| Veto Counter | 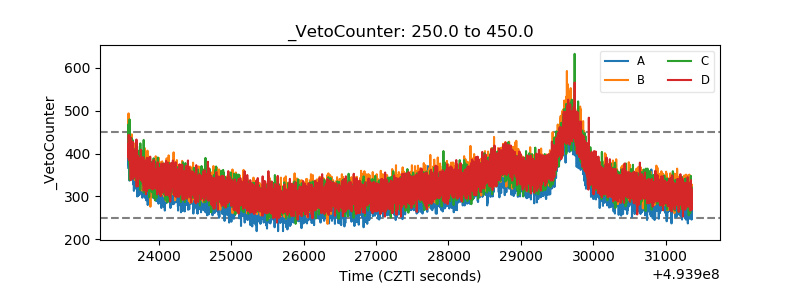 |