| Param | Original file | Final file |
|---|---|---|
| Filename | modeM0/AS1A14_004T05_9000006502_53624cztM0_level2.fits | modeM0/AS1A14_004T05_9000006502_53624cztM0_level2_quad_clean.evt |
| Size (bytes) | 2,126,952,000 | 201,528,000 |
| Size | 2.0 GB | 192.2 MB |
| Events in quadrant A | 18,057,332 | 1,336,089 |
| Events in quadrant B | 13,337,183 | 1,580,457 |
| Events in quadrant C | 29,139,857 | 805,956 |
| Events in quadrant D | 16,908,505 | 1,221,240 |
| Mode M9 | |||
|---|---|---|---|
| Quadrant | BADHDUFLAG | Total packets | Discarded packets |
| A | 0 | 6 | 0 |
| B | 0 | 6 | 0 |
| C | 0 | 6 | 0 |
| D | 0 | 6 | 0 |
| Mode SS | |||
|---|---|---|---|
| Quadrant | BADHDUFLAG | Total packets | Discarded packets |
| A | 0 | 340 | 0 |
| B | 0 | 340 | 0 |
| C | 0 | 340 | 0 |
| D | 0 | 340 | 0 |
| Mode M0 | |||
|---|---|---|---|
| Quadrant | BADHDUFLAG | Total packets | Discarded packets |
| A | 0 | 65298 | 3 |
| B | 0 | 51421 | 3 |
| C | 0 | 98035 | 3 |
| D | 0 | 62049 | 3 |
| Quadrant | Total seconds | Saturated seconds | Saturation percentage |
|---|---|---|---|
| A | 16771 | 2357 | 14.054022% |
| B | 16771 | 1103 | 6.576829% |
| C | 16771 | 8221 | 49.019140% |
| D | 16772 | 2335 | 13.922013% |
Noise dominated data is calculated using 1-second bins in cleaned event files. If a bin has >2000 counts, and if more than 50% of those come from <1% of pixels, then it is considered to be noise-dominated and hence unusable.
| Quadrant | # 1 sec bins | Bins with >0 counts | Bins with >2000 counts | High rate bins dominated by noise | Noise dominated (total time) | Noise dominated (detector-on time) | Marked lightcurve |
|---|---|---|---|---|---|---|---|
| A | 17351 | 16773 | 2103 | 2103 | 12.12% | 12.54% | 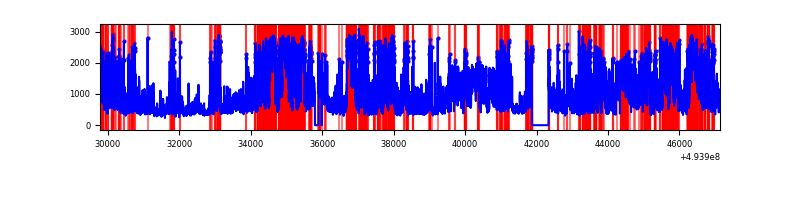 |
| B | 17351 | 16773 | 633 | 633 | 3.65% | 3.77% | 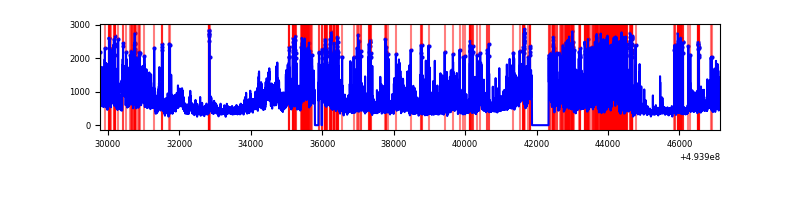 |
| C | 17351 | 16773 | 8029 | 8029 | 46.27% | 47.87% | 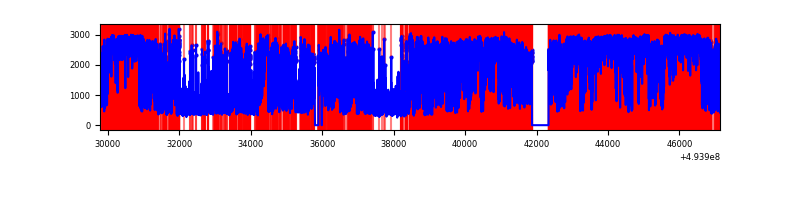 |
| D | 17352 | 16773 | 2396 | 2396 | 13.81% | 14.28% | 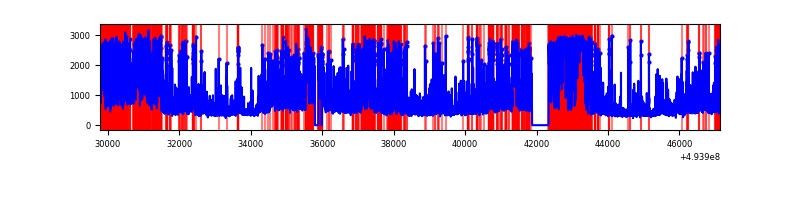 |
Top three noisy pixels from each quadrant. If the there are fewer than three noisy pixels in the level2.evt file, extra rows are filled as -1
| Pixel properties | Quadrant properties | ||||||
|---|---|---|---|---|---|---|---|
| Quadrant | DetID | PixID | Counts | Sigma | Mean | Median | Sigma |
| A | 3 | 78 | 4879962 | 11693.32 | 1690 | 1650 | 417.2 |
| A | 4 | 95 | 3398348 | 8141.89 | 1690 | 1650 | 417.2 |
| A | 15 | 174 | 757146 | 1810.92 | 1690 | 1650 | 417.2 |
| B | 15 | 20 | 1892868 | 5195.01 | 1723 | 1661 | 364.0 |
| B | 7 | 0 | 1162567 | 3188.93 | 1723 | 1661 | 364.0 |
| B | 4 | 206 | 933121 | 2558.65 | 1723 | 1661 | 364.0 |
| C | 1 | 241 | 10883380 | 30314.43 | 1294 | 1282 | 359.0 |
| C | 15 | 224 | 7839325 | 21834.56 | 1294 | 1282 | 359.0 |
| C | 4 | 5 | 1692955 | 4712.52 | 1294 | 1282 | 359.0 |
| D | 8 | 176 | 6912624 | 14729.03 | 1627 | 1557 | 469.2 |
| D | 10 | 172 | 414573 | 880.23 | 1627 | 1557 | 469.2 |
| D | 7 | 70 | 395479 | 839.54 | 1627 | 1557 | 469.2 |
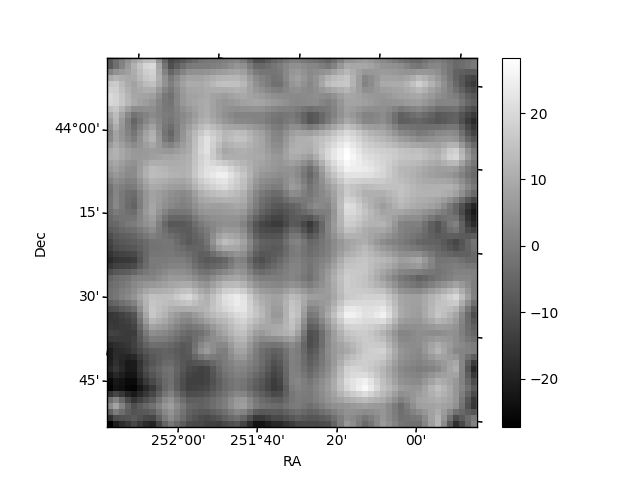
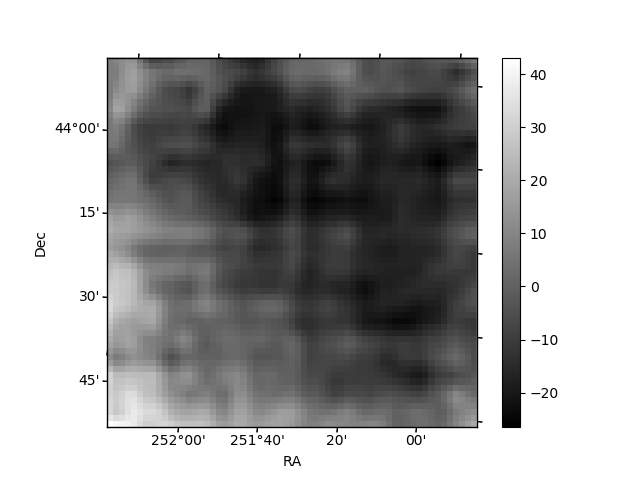
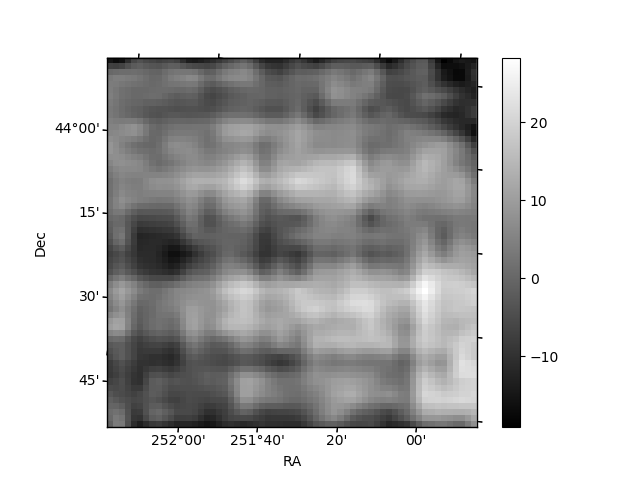
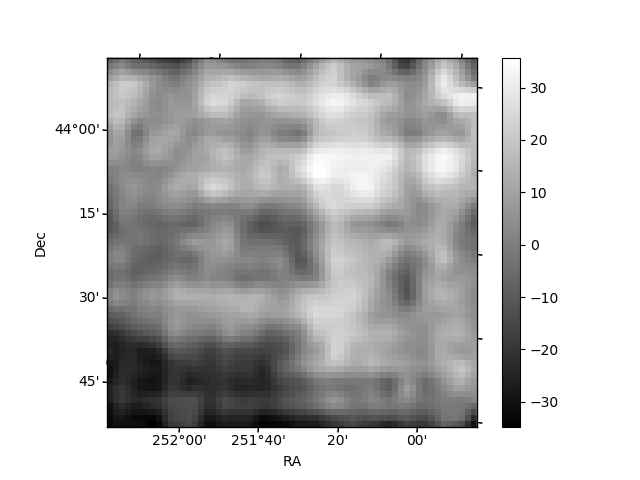
Histogram calculated using DETX and DETY for each event in the final _common_clean file
| Quadrant A | 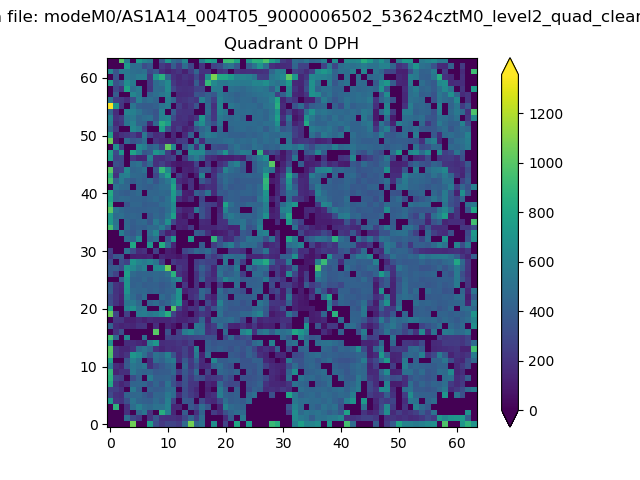 |
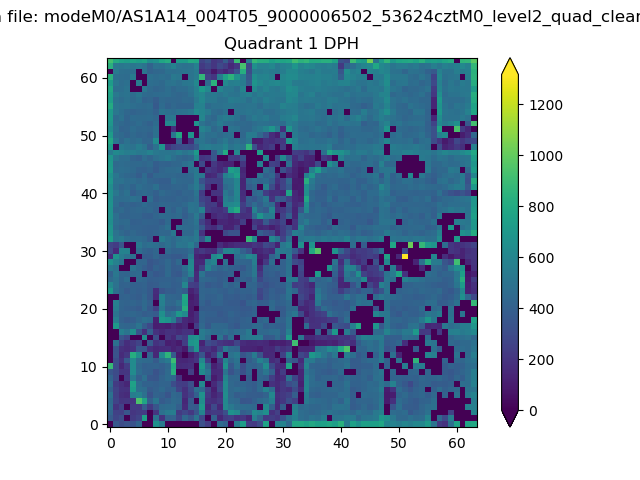 |
Quadrant B |
|---|---|---|---|
| Quadrant D | 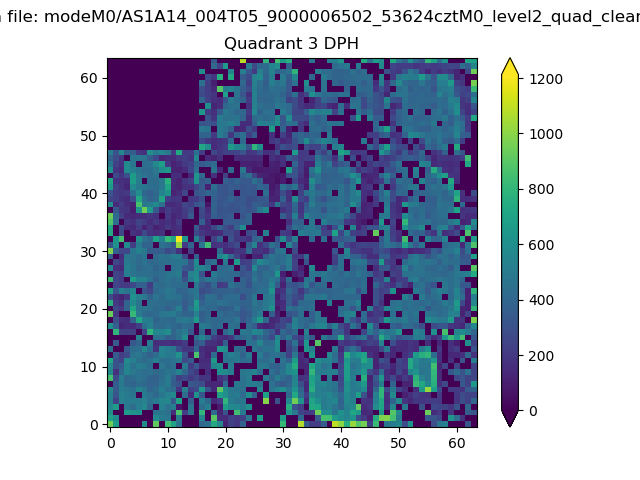 |
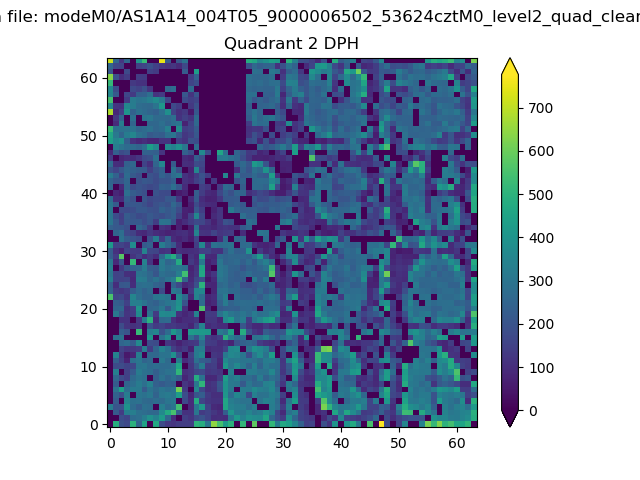 |
Quadrant C |
| Plot type | Count rate plots | Images |
|---|---|---|
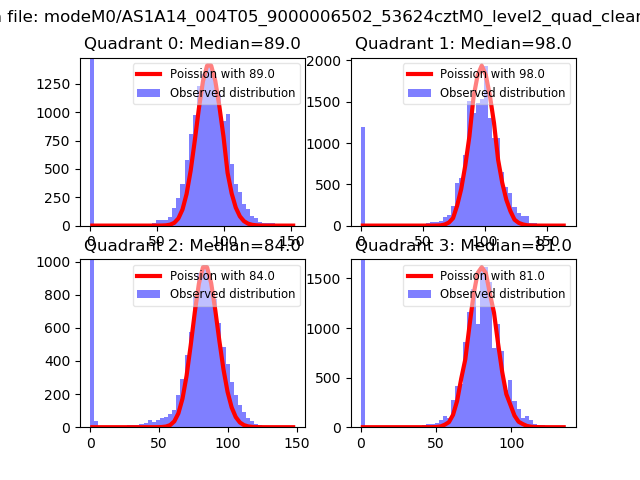
| Comparison with Poisson distribution Blue bars denote a histogram of data divided into 1 sec bins. Red curve is a Poisson curve with rate = median count rate of data. |
 |
 |
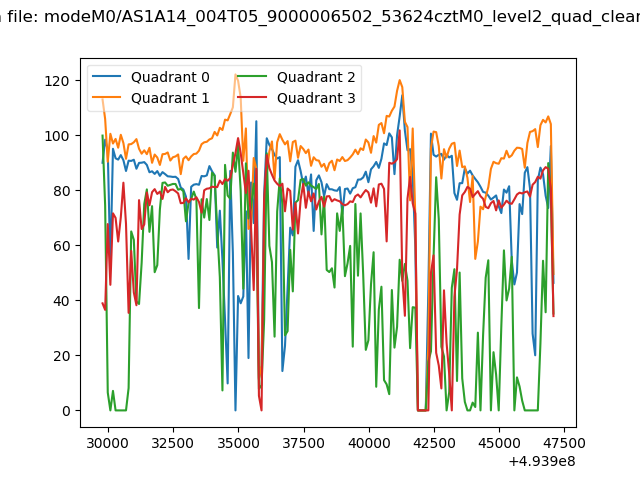
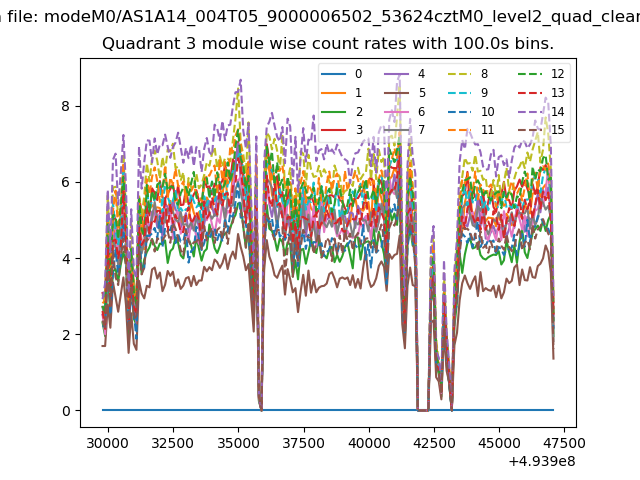
| Quadrant-wise count rates Data is divided into 100 sec bins |
 |
|
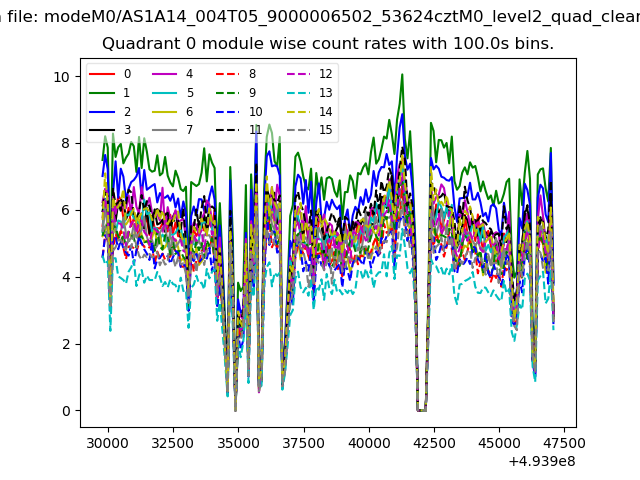
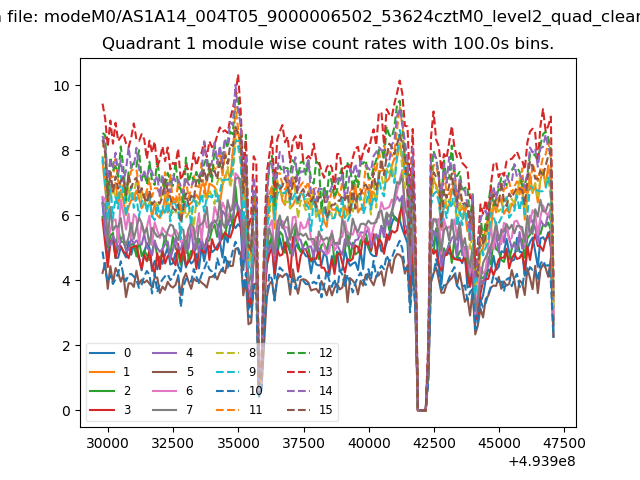
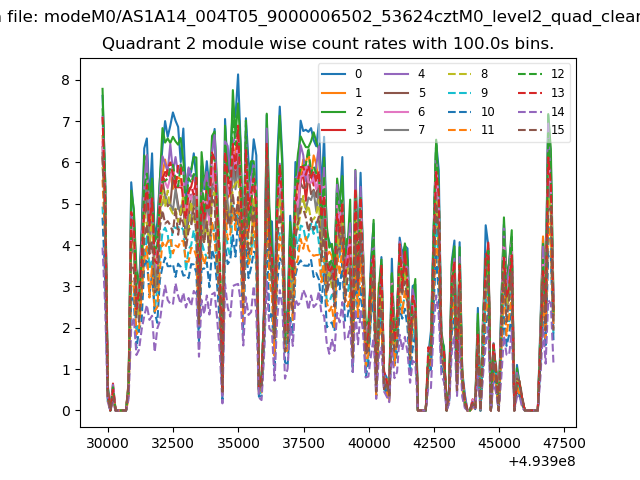
| Module-wise count rates for Quadrant A Data is divided into 100 sec bins |
 |
 |
| Module-wise count rates for Quadrant B Data is divided into 100 sec bins |
 |
 |
| Module-wise count rates for Quadrant C Data is divided into 100 sec bins |
 |
 |
| Module-wise count rates for Quadrant D Data is divided into 100 sec bins |
 |
 |
| Parameter | Plot |
|---|---|
| CZT HV Monitor | 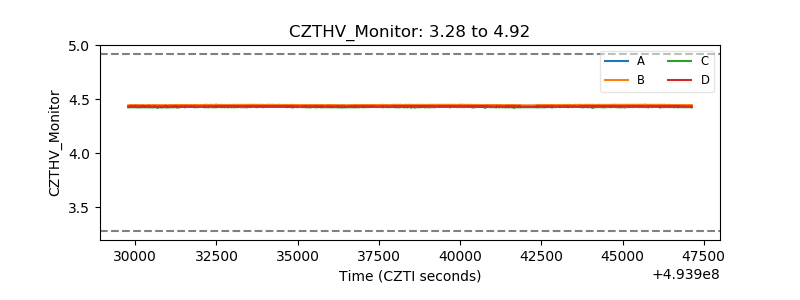 |
| D_VDD | 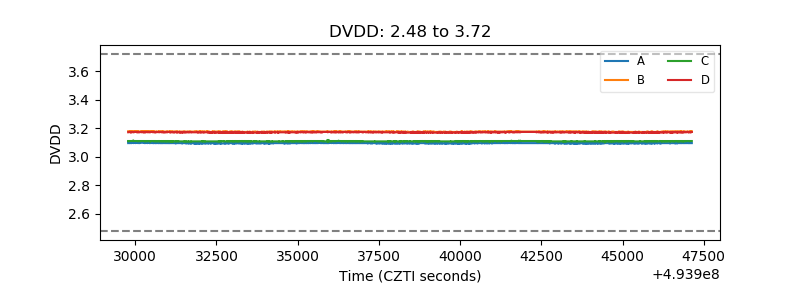 |
| Temperature 1 | 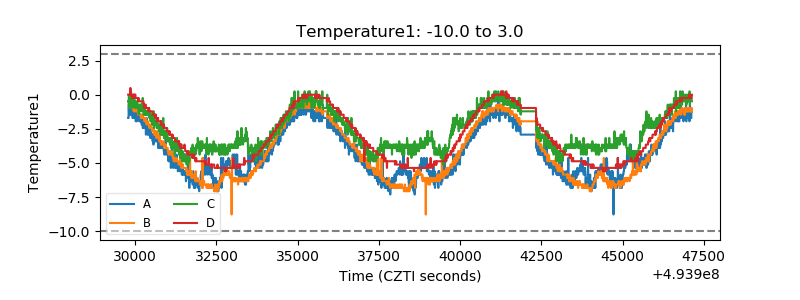 |
| Veto HV Monitor | 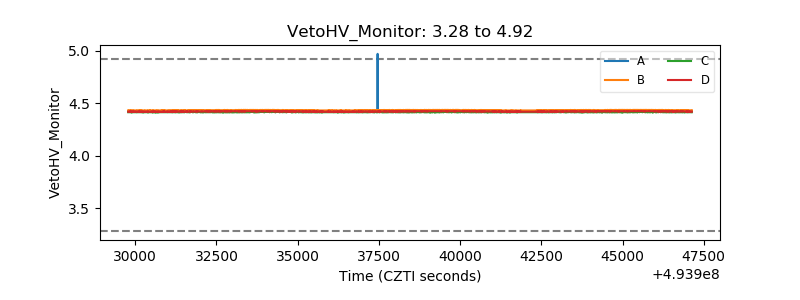 |
| Veto LLD | 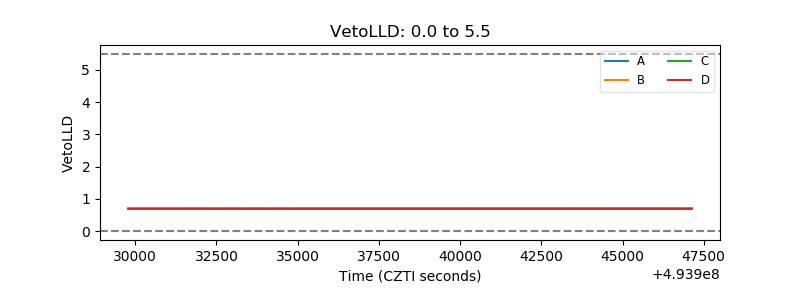 |
| Alpha Counter | 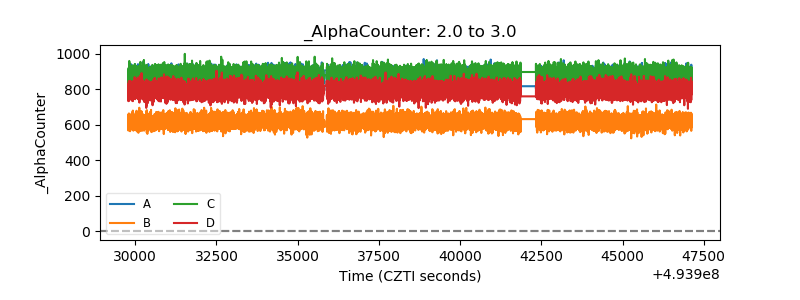 |
| _CPM_Rate |  |
| CZT Counter | 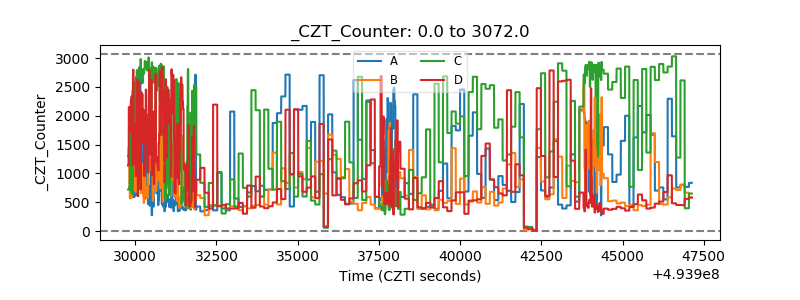 |
| +2.5 Volts monitor |  |
| +5 Volts monitor |  |
| _ROLL_ROT | 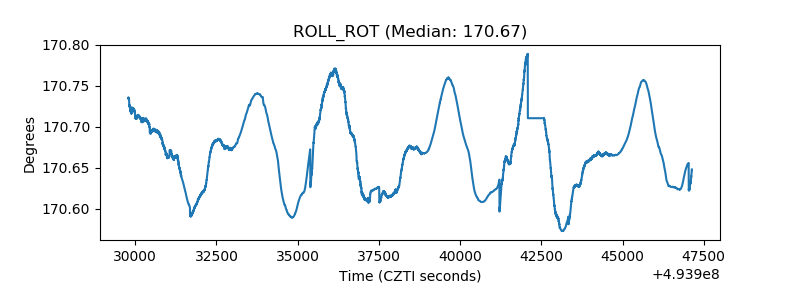 |
| _Roll_DEC | 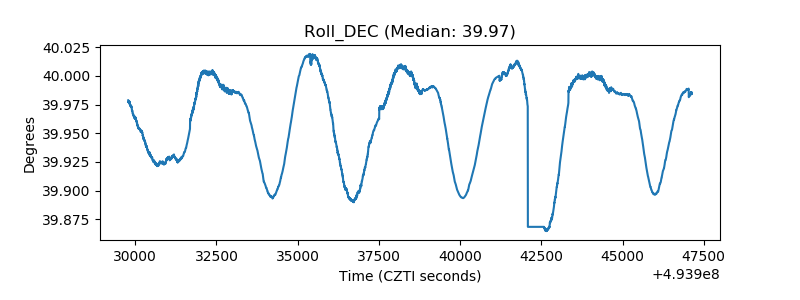 |
| _Roll_RA | 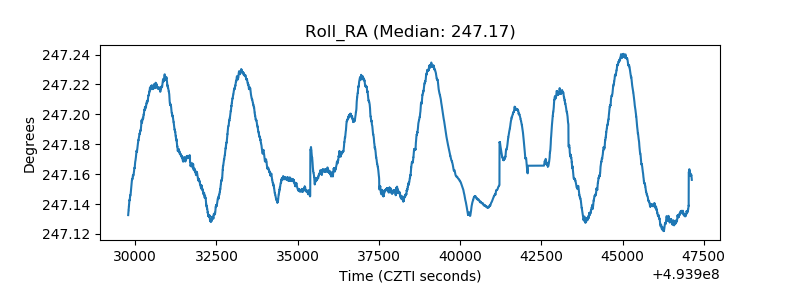 |
| Veto Counter | 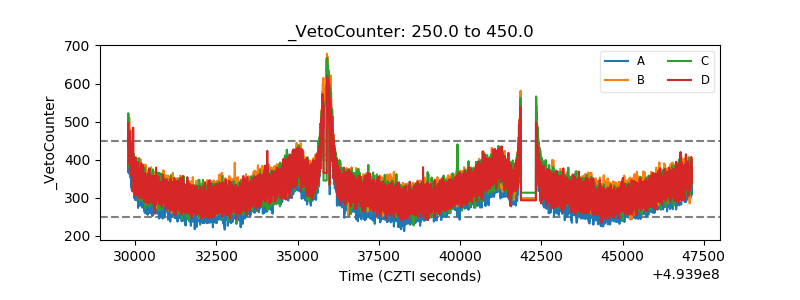 |