| Param | Original file | Final file |
|---|---|---|
| Filename | modeM0/AS1A14_004T05_9000006502_53625cztM0_level2.fits | modeM0/AS1A14_004T05_9000006502_53625cztM0_level2_quad_clean.evt |
| Size (bytes) | 1,001,102,400 | 100,658,880 |
| Size | 954.7 MB | 96.0 MB |
| Events in quadrant A | 11,333,407 | 571,858 |
| Events in quadrant B | 6,495,703 | 765,916 |
| Events in quadrant C | 11,213,781 | 532,745 |
| Events in quadrant D | 7,398,740 | 622,074 |
| Mode M9 | |||
|---|---|---|---|
| Quadrant | BADHDUFLAG | Total packets | Discarded packets |
| A | 0 | 16 | 0 |
| B | 0 | 16 | 0 |
| C | 0 | 16 | 0 |
| D | 0 | 16 | 0 |
| Mode SS | |||
|---|---|---|---|
| Quadrant | BADHDUFLAG | Total packets | Discarded packets |
| A | 0 | 162 | 0 |
| B | 0 | 162 | 0 |
| C | 0 | 162 | 0 |
| D | 0 | 162 | 0 |
| Mode M0 | |||
|---|---|---|---|
| Quadrant | BADHDUFLAG | Total packets | Discarded packets |
| A | 0 | 39125 | 2 |
| B | 0 | 24986 | 2 |
| C | 0 | 38814 | 2 |
| D | 0 | 27622 | 2 |
| Quadrant | Total seconds | Saturated seconds | Saturation percentage |
|---|---|---|---|
| A | 7983 | 2406 | 30.139045% |
| B | 7984 | 582 | 7.289579% |
| C | 7984 | 2464 | 30.861723% |
| D | 7984 | 938 | 11.748497% |
Noise dominated data is calculated using 1-second bins in cleaned event files. If a bin has >2000 counts, and if more than 50% of those come from <1% of pixels, then it is considered to be noise-dominated and hence unusable.
| Quadrant | # 1 sec bins | Bins with >0 counts | Bins with >2000 counts | High rate bins dominated by noise | Noise dominated (total time) | Noise dominated (detector-on time) | Marked lightcurve |
|---|---|---|---|---|---|---|---|
| A | 9487 | 7981 | 2448 | 2448 | 25.80% | 30.67% | 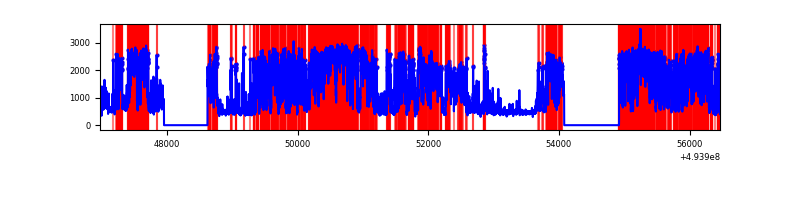 |
| B | 9488 | 7982 | 312 | 312 | 3.29% | 3.91% | 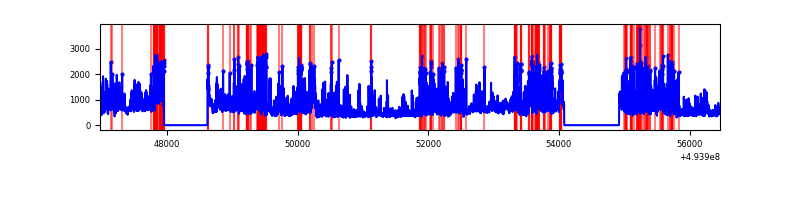 |
| C | 9488 | 7982 | 2436 | 2436 | 25.67% | 30.52% | 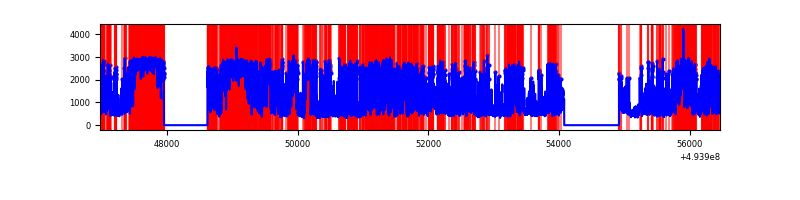 |
| D | 9488 | 7983 | 943 | 943 | 9.94% | 11.81% | 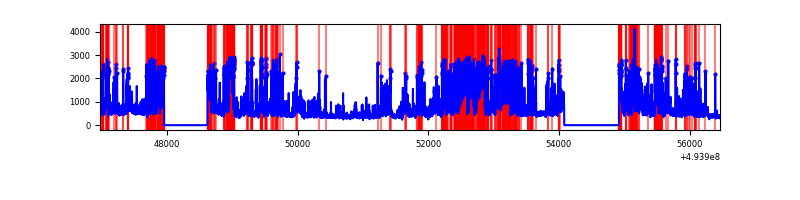 |
Top three noisy pixels from each quadrant. If the there are fewer than three noisy pixels in the level2.evt file, extra rows are filled as -1
| Pixel properties | Quadrant properties | ||||||
|---|---|---|---|---|---|---|---|
| Quadrant | DetID | PixID | Counts | Sigma | Mean | Median | Sigma |
| A | 4 | 95 | 4053860 | 20871.31 | 786 | 766 | 194.2 |
| A | 3 | 78 | 2280492 | 11739.39 | 786 | 766 | 194.2 |
| A | 3 | 130 | 520051 | 2674.05 | 786 | 766 | 194.2 |
| B | 15 | 20 | 1990983 | 11055.95 | 837 | 808 | 180.0 |
| B | 4 | 206 | 515273 | 2857.99 | 837 | 808 | 180.0 |
| B | 5 | 172 | 170445 | 942.38 | 837 | 808 | 180.0 |
| C | 15 | 224 | 3288756 | 16776.41 | 709 | 703 | 196.0 |
| C | 1 | 241 | 2112084 | 10772.76 | 709 | 703 | 196.0 |
| C | 13 | 3 | 1786971 | 9113.95 | 709 | 703 | 196.0 |
| D | 8 | 176 | 2957098 | 12685.72 | 805 | 770 | 233.0 |
| D | 2 | 153 | 473129 | 2026.91 | 805 | 770 | 233.0 |
| D | 10 | 172 | 296221 | 1267.79 | 805 | 770 | 233.0 |
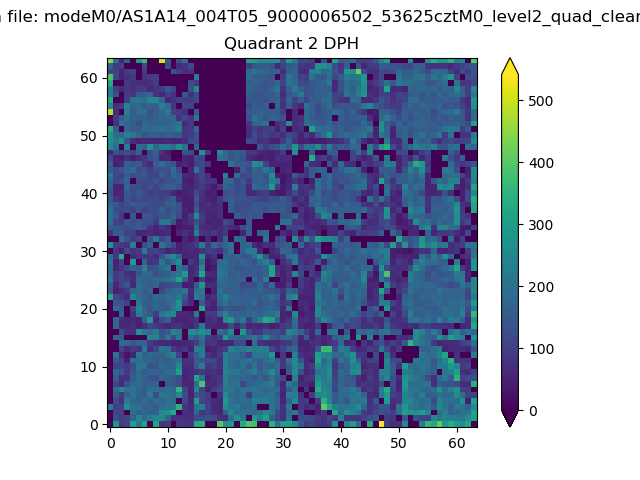
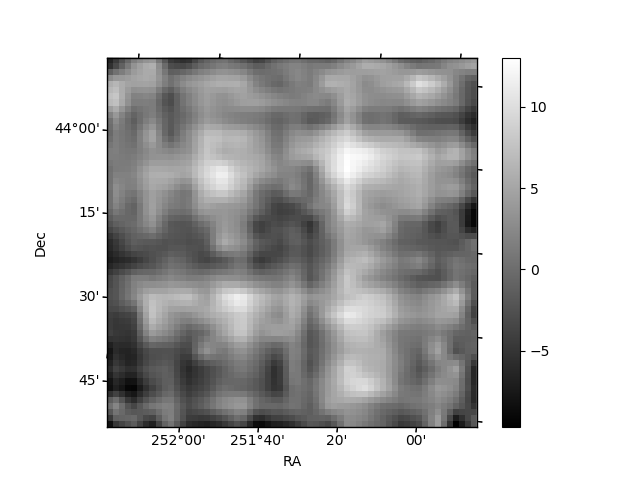
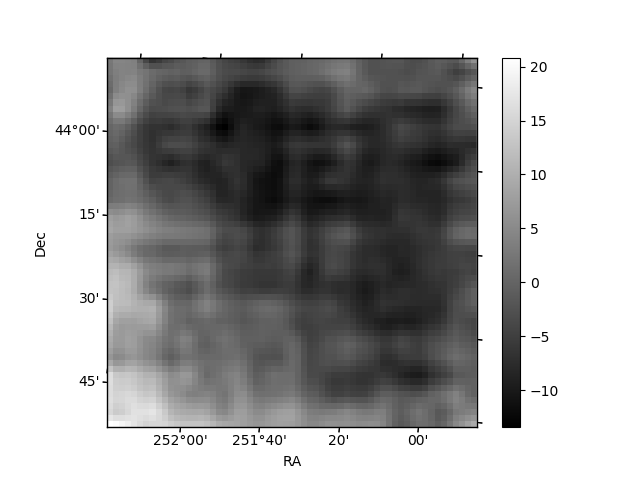
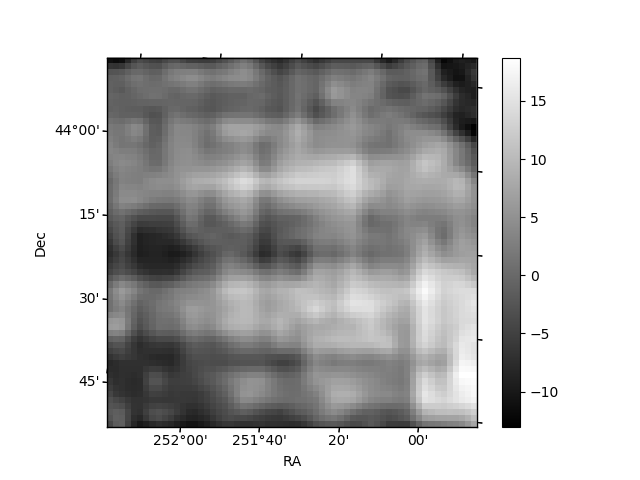
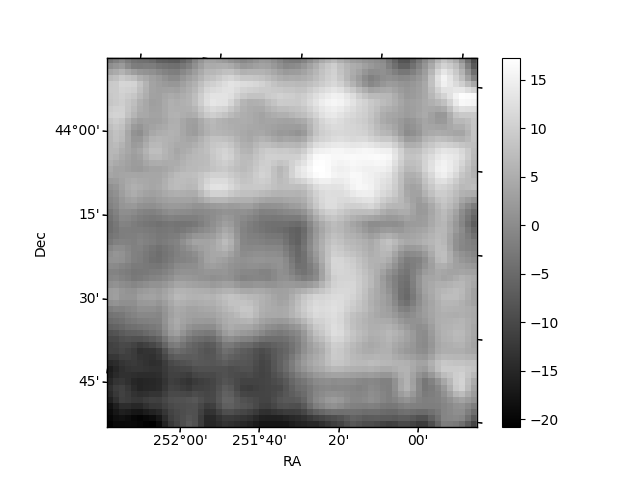
Histogram calculated using DETX and DETY for each event in the final _common_clean file
| Quadrant A | 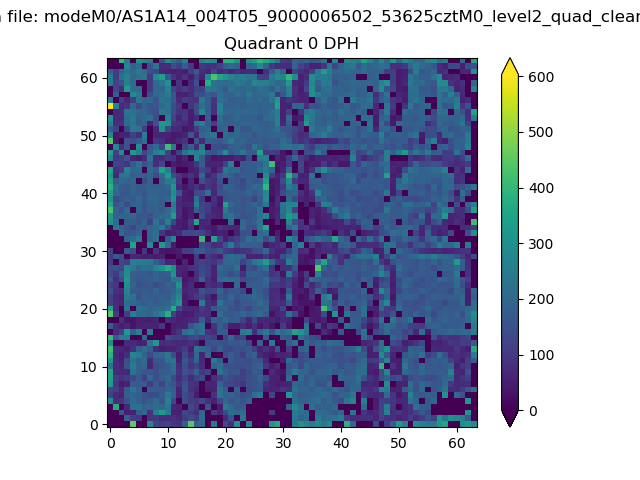 |
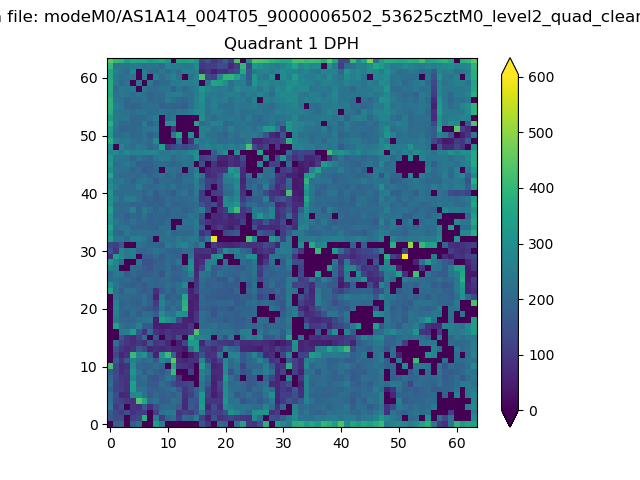 |
Quadrant B |
|---|---|---|---|
| Quadrant D | 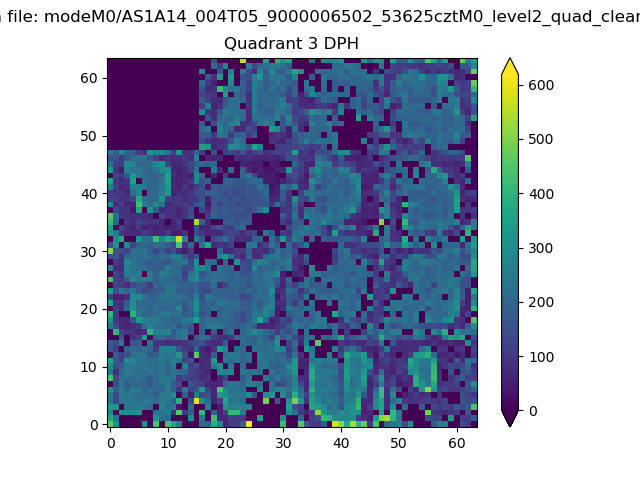 |
 |
Quadrant C |
| Plot type | Count rate plots | Images |
|---|---|---|
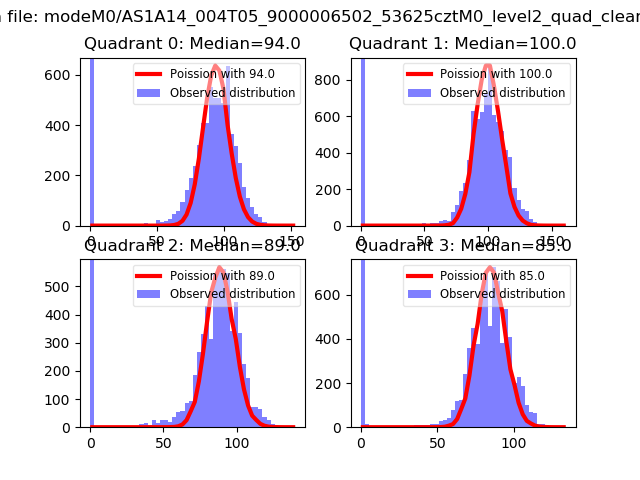
| Comparison with Poisson distribution Blue bars denote a histogram of data divided into 1 sec bins. Red curve is a Poisson curve with rate = median count rate of data. |
 |
 |
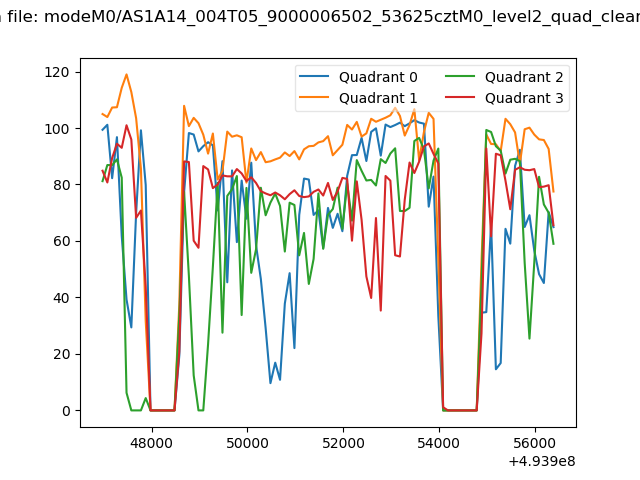
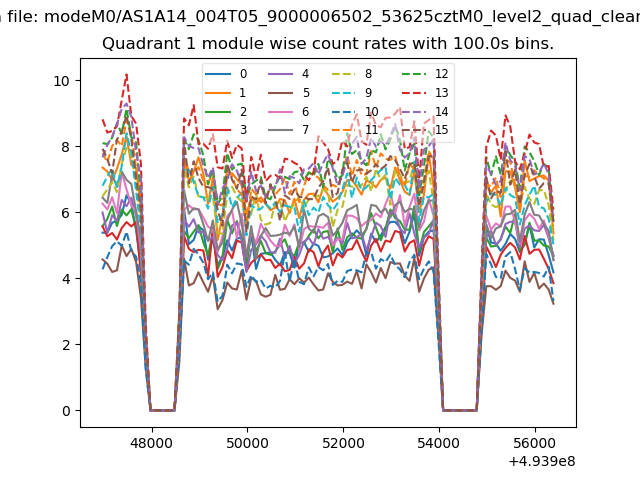
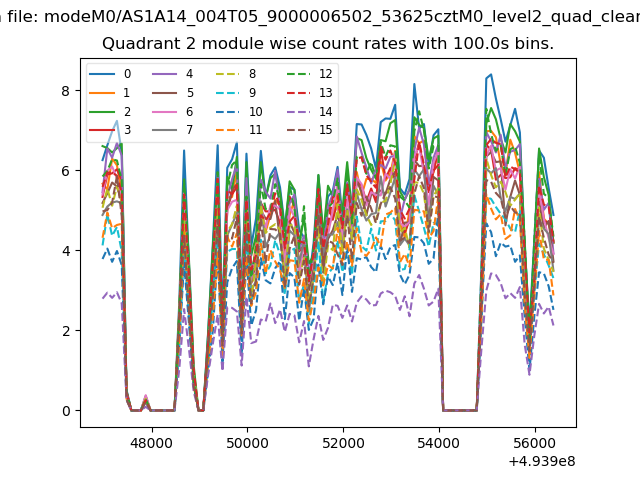
| Quadrant-wise count rates Data is divided into 100 sec bins |
 |
|
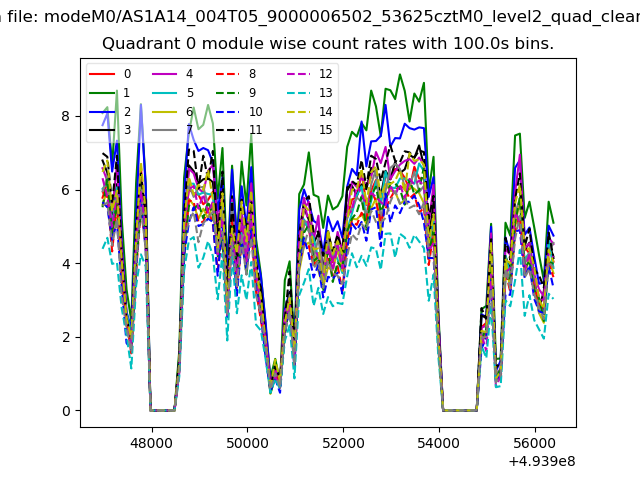
| Module-wise count rates for Quadrant A Data is divided into 100 sec bins |
 |
 |
| Module-wise count rates for Quadrant B Data is divided into 100 sec bins |
 |
 |
| Module-wise count rates for Quadrant C Data is divided into 100 sec bins |
 |
 |
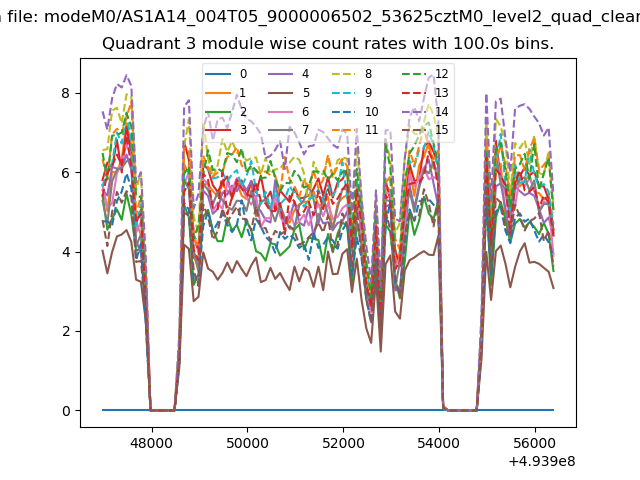
| Module-wise count rates for Quadrant D Data is divided into 100 sec bins |
 |
 |
| Parameter | Plot |
|---|---|
| CZT HV Monitor | 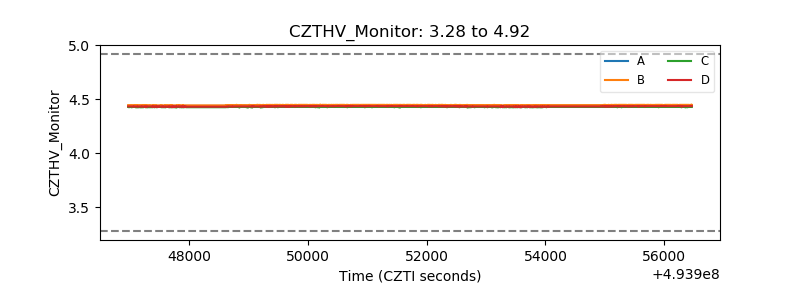 |
| D_VDD | 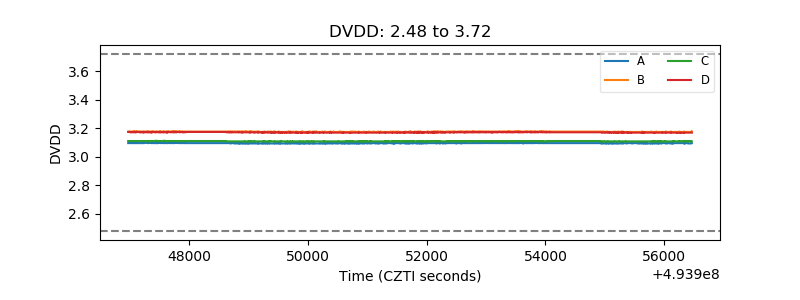 |
| Temperature 1 | 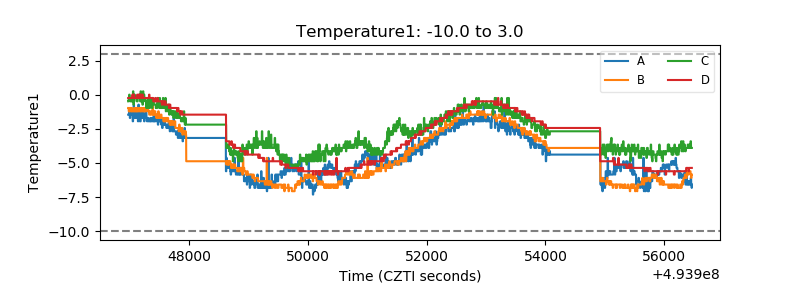 |
| Veto HV Monitor | 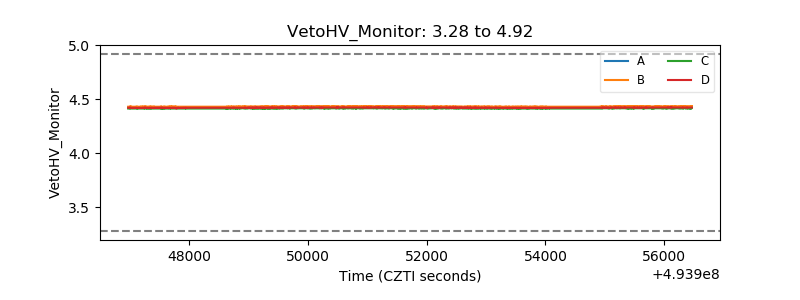 |
| Veto LLD | 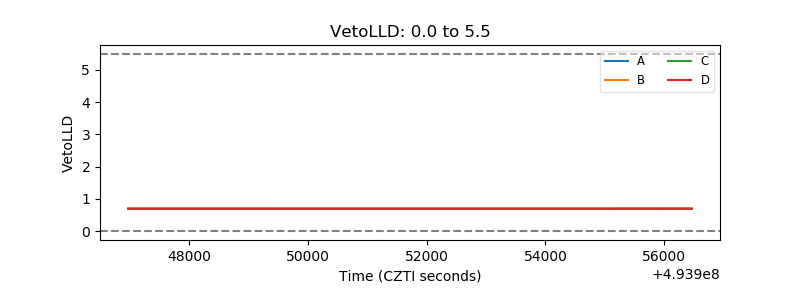 |
| Alpha Counter | 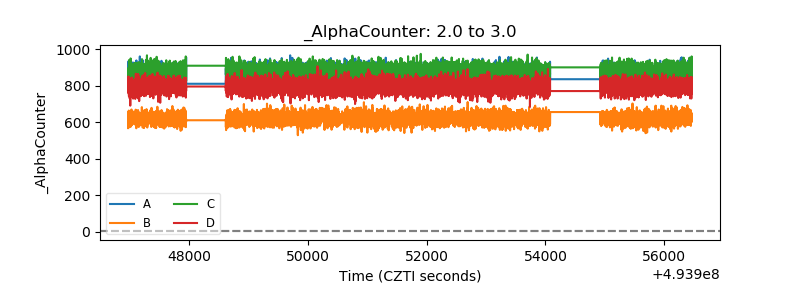 |
| _CPM_Rate | 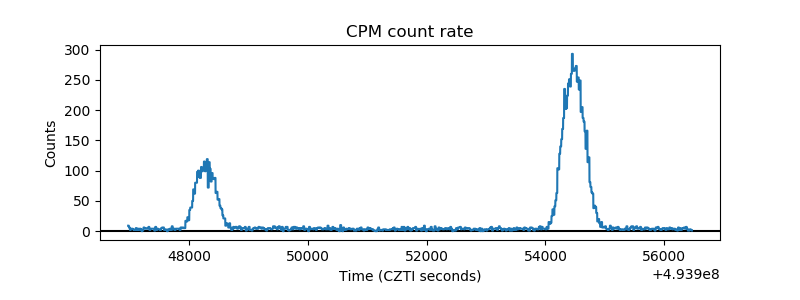 |
| CZT Counter | 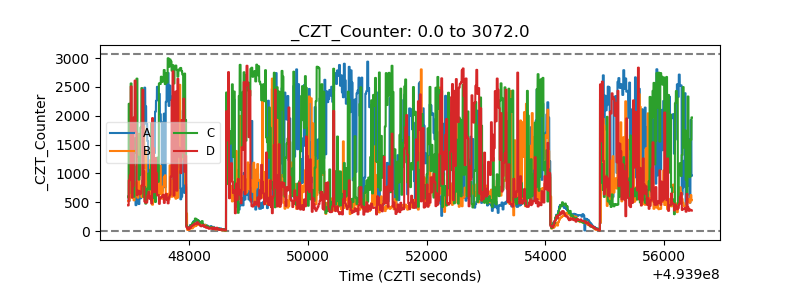 |
| +2.5 Volts monitor |  |
| +5 Volts monitor |  |
| _ROLL_ROT | 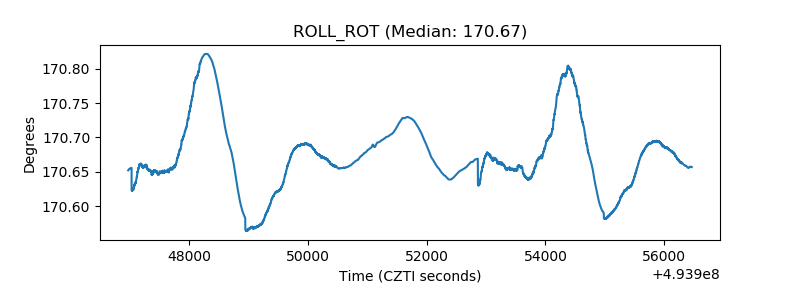 |
| _Roll_DEC | 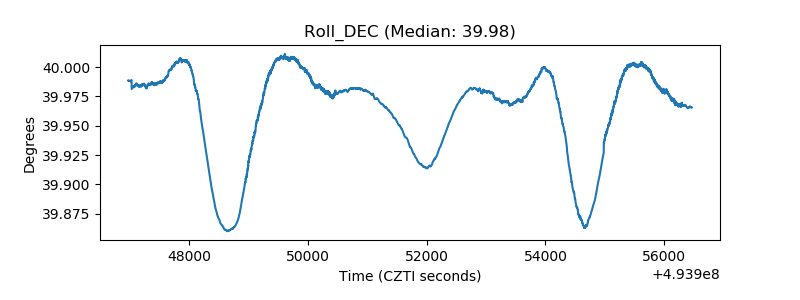 |
| _Roll_RA | 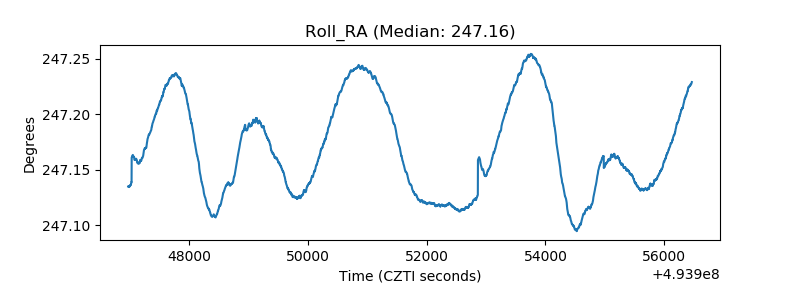 |
| Veto Counter | 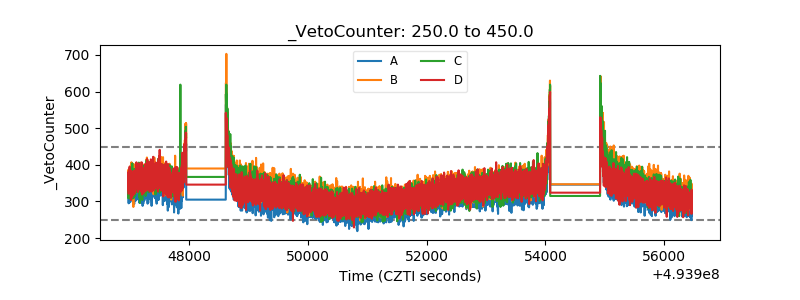 |