| Param | Original file | Final file |
|---|---|---|
| Filename | modeM0/AS1A14_004T05_9000006502_53627cztM0_level2.fits | modeM0/AS1A14_004T05_9000006502_53627cztM0_level2_quad_clean.evt |
| Size (bytes) | 862,732,800 | 77,460,480 |
| Size | 822.8 MB | 73.9 MB |
| Events in quadrant A | 8,819,609 | 471,379 |
| Events in quadrant B | 5,423,744 | 589,974 |
| Events in quadrant C | 11,269,738 | 332,324 |
| Events in quadrant D | 5,933,282 | 509,133 |
| Mode M9 | |||
|---|---|---|---|
| Quadrant | BADHDUFLAG | Total packets | Discarded packets |
| A | 0 | 10 | 0 |
| B | 0 | 10 | 0 |
| C | 0 | 10 | 0 |
| D | 0 | 10 | 0 |
| Mode SS | |||
|---|---|---|---|
| Quadrant | BADHDUFLAG | Total packets | Discarded packets |
| A | 0 | 128 | 0 |
| B | 0 | 128 | 0 |
| C | 0 | 128 | 0 |
| D | 0 | 128 | 0 |
| Mode M0 | |||
|---|---|---|---|
| Quadrant | BADHDUFLAG | Total packets | Discarded packets |
| A | 0 | 30528 | 1 |
| B | 0 | 20526 | 1 |
| C | 0 | 37714 | 1 |
| D | 0 | 22048 | 2 |
| Quadrant | Total seconds | Saturated seconds | Saturation percentage |
|---|---|---|---|
| A | 6336 | 1759 | 27.761995% |
| B | 6336 | 757 | 11.947601% |
| C | 6337 | 3009 | 47.483036% |
| D | 6336 | 564 | 8.901515% |
Noise dominated data is calculated using 1-second bins in cleaned event files. If a bin has >2000 counts, and if more than 50% of those come from <1% of pixels, then it is considered to be noise-dominated and hence unusable.
| Quadrant | # 1 sec bins | Bins with >0 counts | Bins with >2000 counts | High rate bins dominated by noise | Noise dominated (total time) | Noise dominated (detector-on time) | Marked lightcurve |
|---|---|---|---|---|---|---|---|
| A | 7317 | 6338 | 1785 | 1785 | 24.40% | 28.16% | 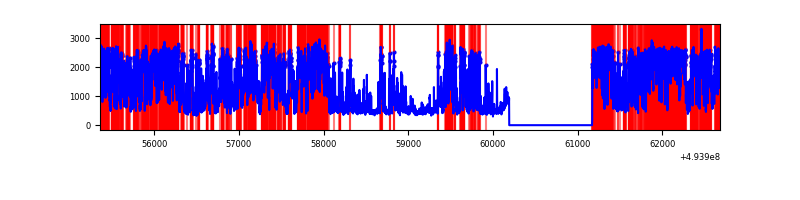 |
| B | 7317 | 6338 | 479 | 479 | 6.55% | 7.56% | 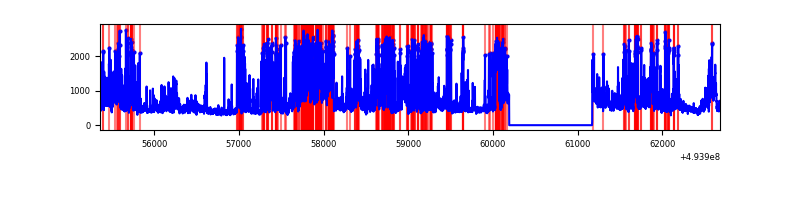 |
| C | 7318 | 6339 | 3001 | 3001 | 41.01% | 47.34% | 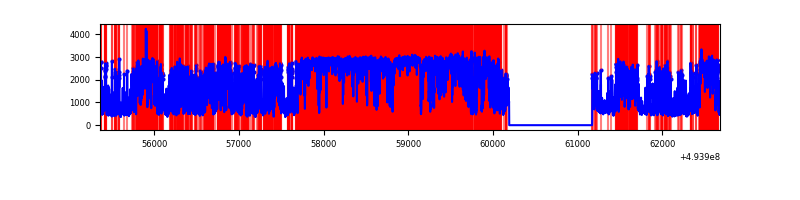 |
| D | 7317 | 6338 | 598 | 598 | 8.17% | 9.44% | 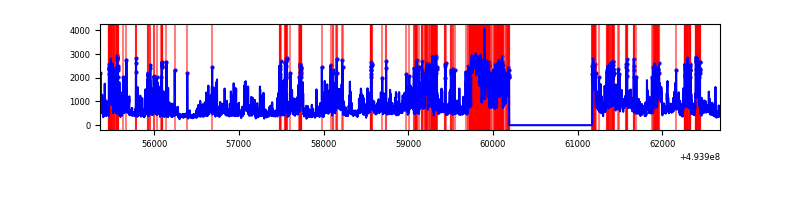 |
Top three noisy pixels from each quadrant. If the there are fewer than three noisy pixels in the level2.evt file, extra rows are filled as -1
| Pixel properties | Quadrant properties | ||||||
|---|---|---|---|---|---|---|---|
| Quadrant | DetID | PixID | Counts | Sigma | Mean | Median | Sigma |
| A | 4 | 95 | 3673064 | 23722.08 | 631 | 616 | 154.8 |
| A | 3 | 78 | 2255145 | 14563.07 | 631 | 616 | 154.8 |
| A | 3 | 63 | 166283 | 1070.12 | 631 | 616 | 154.8 |
| B | 15 | 20 | 1997997 | 14228.71 | 649 | 627 | 140.4 |
| B | 4 | 206 | 261052 | 1855.19 | 649 | 627 | 140.4 |
| B | 5 | 172 | 213801 | 1518.59 | 649 | 627 | 140.4 |
| C | 1 | 241 | 5508158 | 41299.73 | 481 | 479 | 133.4 |
| C | 15 | 224 | 2994315 | 22449.5 | 481 | 479 | 133.4 |
| C | 7 | 80 | 265648 | 1988.39 | 481 | 479 | 133.4 |
| D | 8 | 176 | 2016549 | 11027.87 | 634 | 605 | 182.8 |
| D | 10 | 172 | 522764 | 2856.38 | 634 | 605 | 182.8 |
| D | 2 | 153 | 197718 | 1078.27 | 634 | 605 | 182.8 |
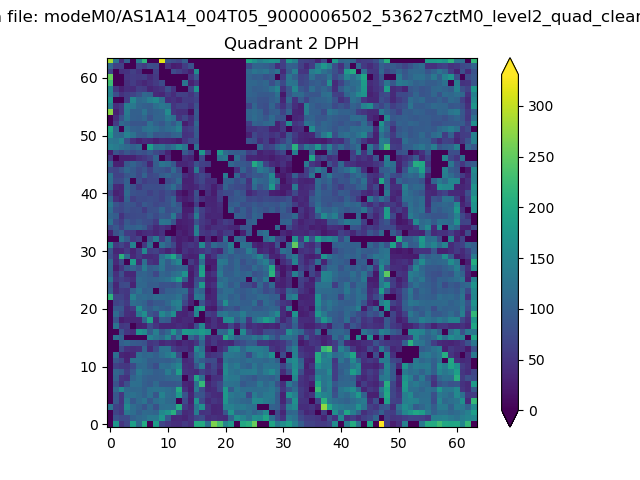
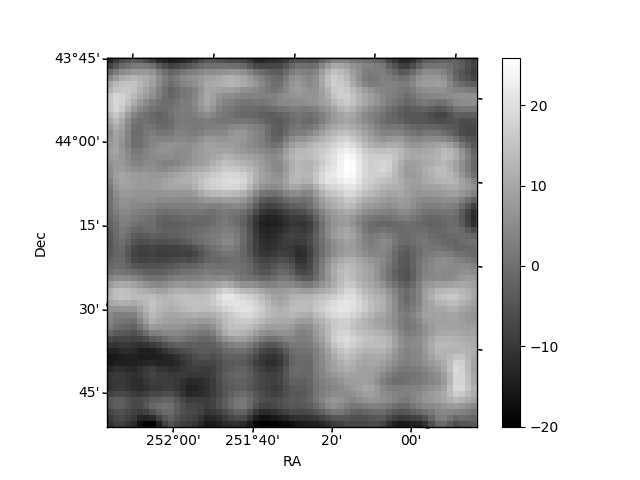
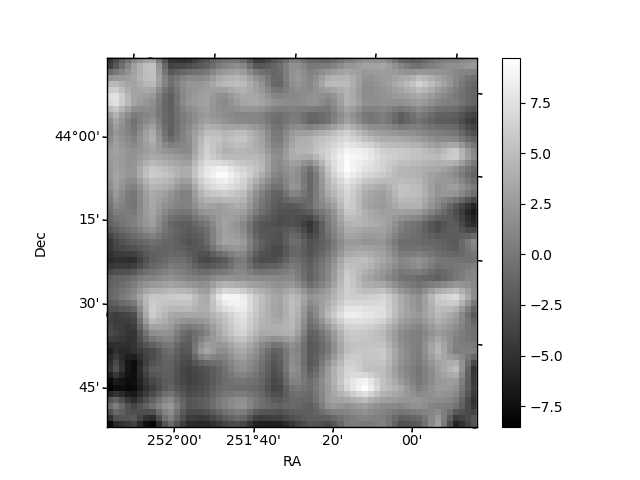
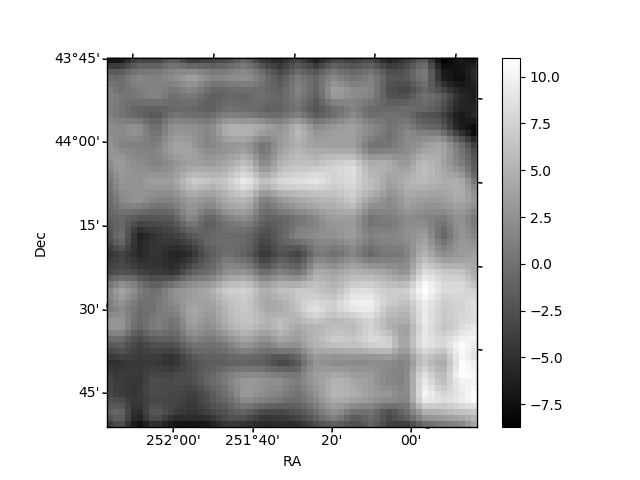
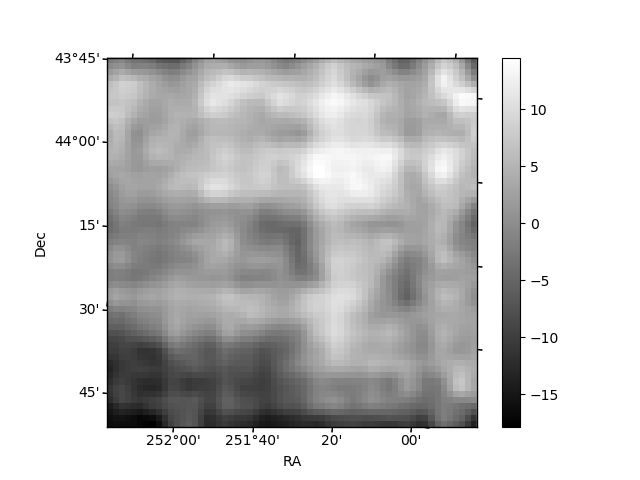
Histogram calculated using DETX and DETY for each event in the final _common_clean file
| Quadrant A | 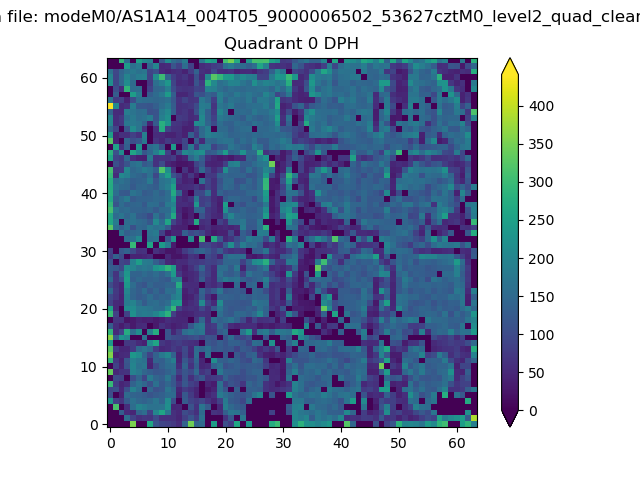 |
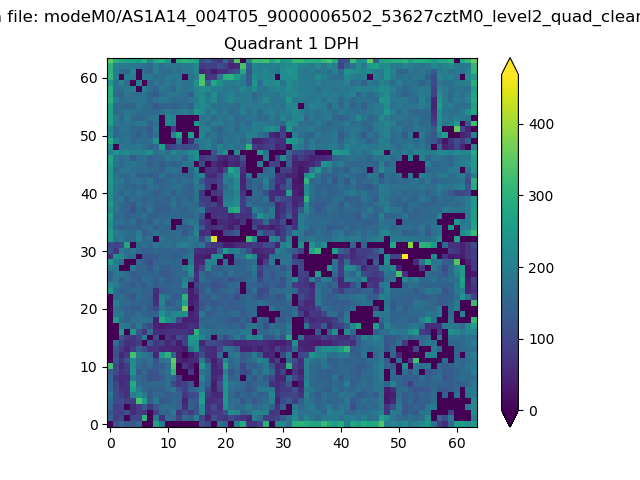 |
Quadrant B |
|---|---|---|---|
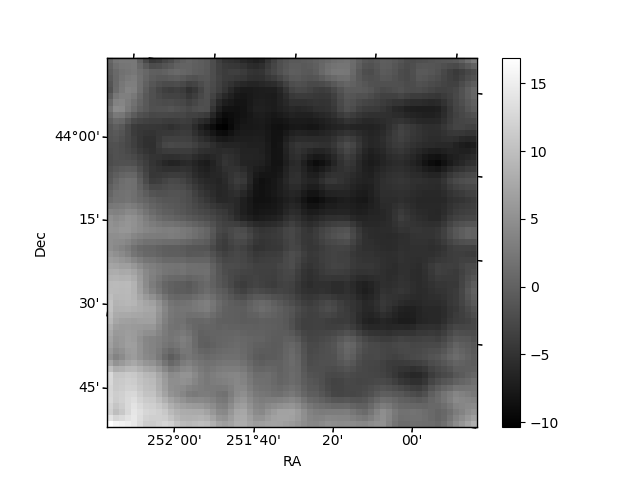
| Quadrant D | 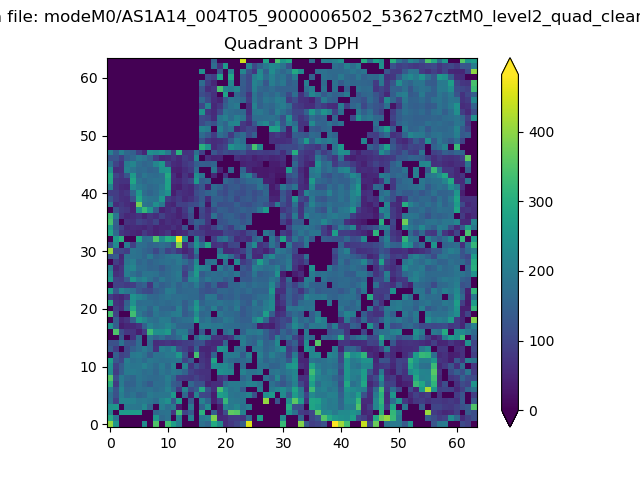 |
 |
Quadrant C |
| Plot type | Count rate plots | Images |
|---|---|---|
| Comparison with Poisson distribution Blue bars denote a histogram of data divided into 1 sec bins. Red curve is a Poisson curve with rate = median count rate of data. |
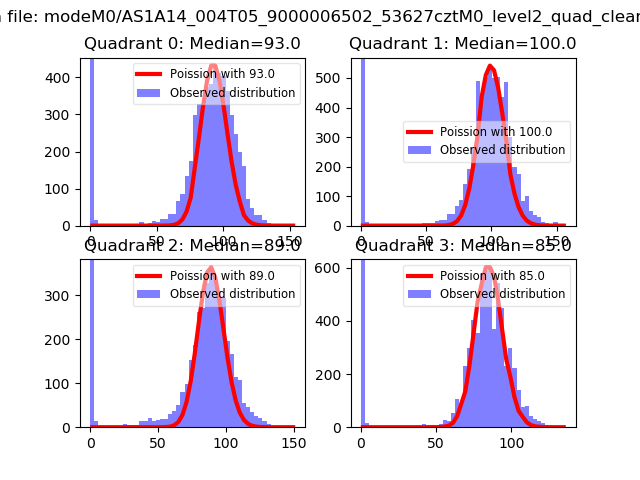 |
 |
| Quadrant-wise count rates Data is divided into 100 sec bins |
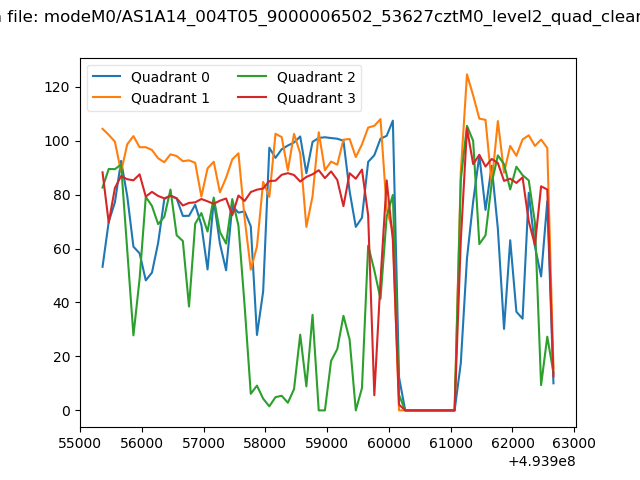 |
|
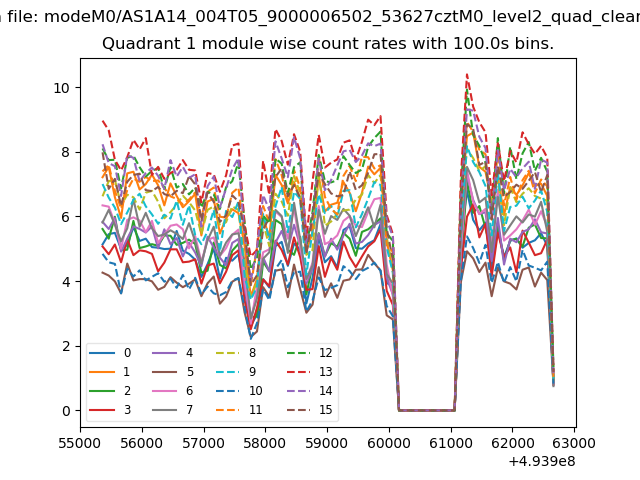
| Module-wise count rates for Quadrant A Data is divided into 100 sec bins |
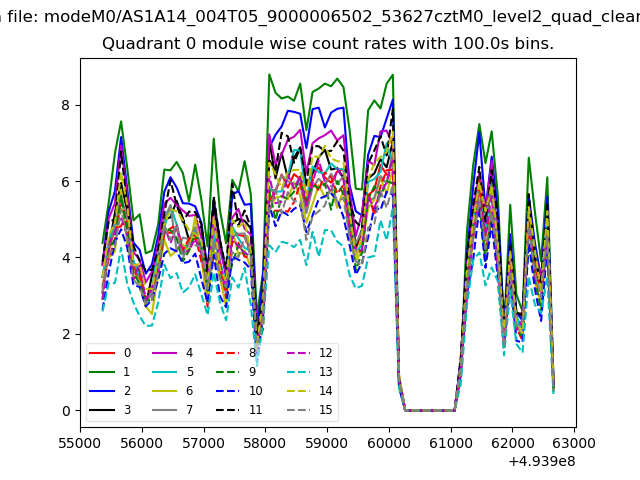 |
 |
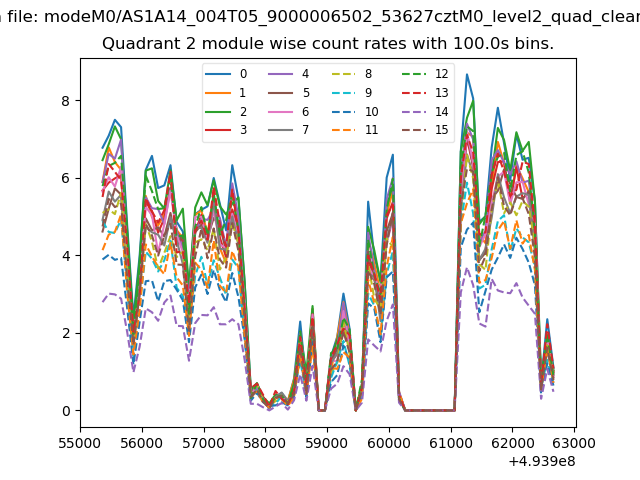
| Module-wise count rates for Quadrant B Data is divided into 100 sec bins |
 |
 |
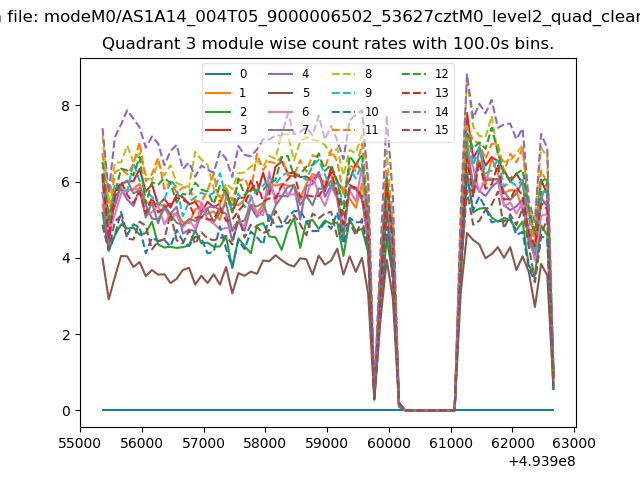
| Module-wise count rates for Quadrant C Data is divided into 100 sec bins |
 |
 |
| Module-wise count rates for Quadrant D Data is divided into 100 sec bins |
 |
 |
| Parameter | Plot |
|---|---|
| CZT HV Monitor | 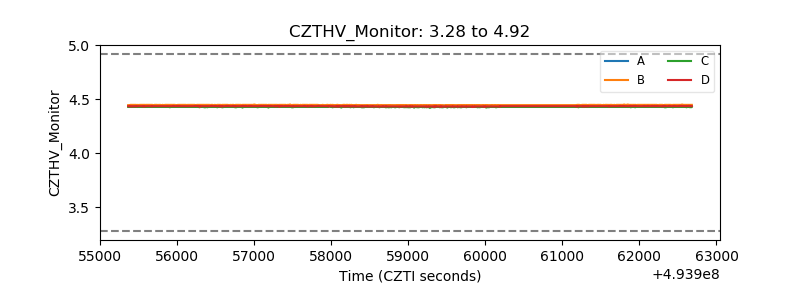 |
| D_VDD | 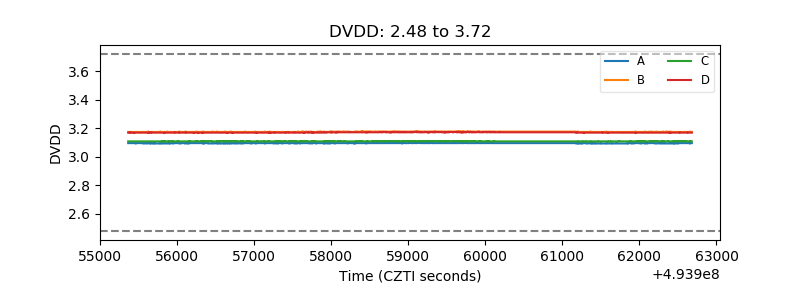 |
| Temperature 1 | 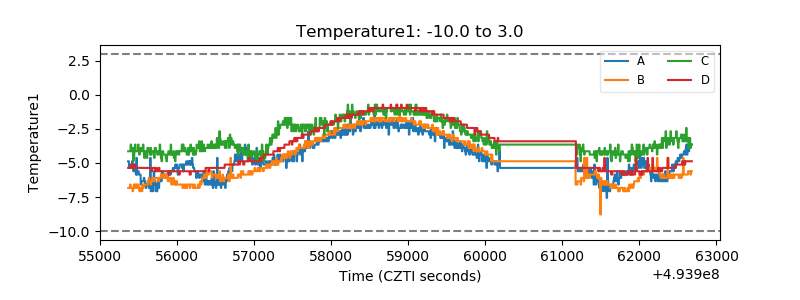 |
| Veto HV Monitor | 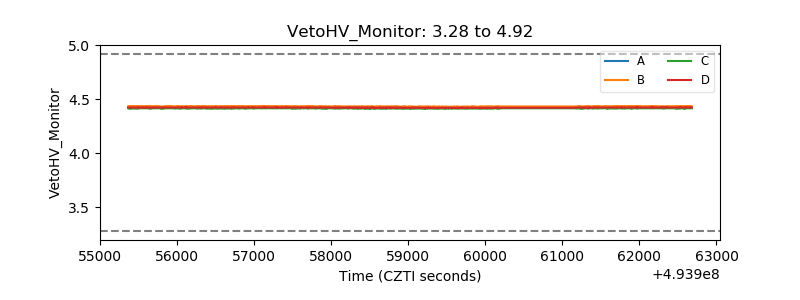 |
| Veto LLD | 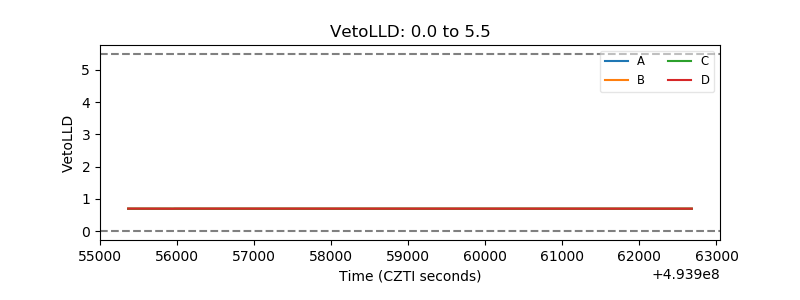 |
| Alpha Counter | 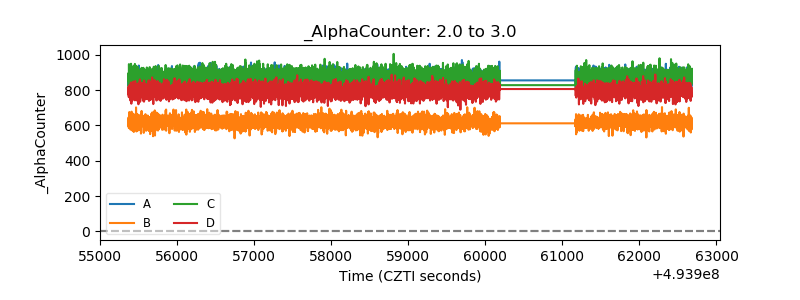 |
| _CPM_Rate | 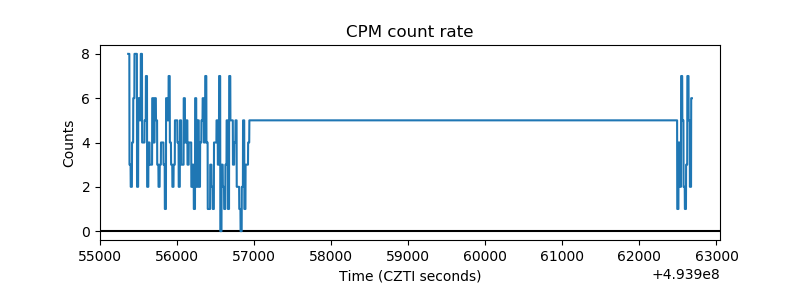 |
| CZT Counter | 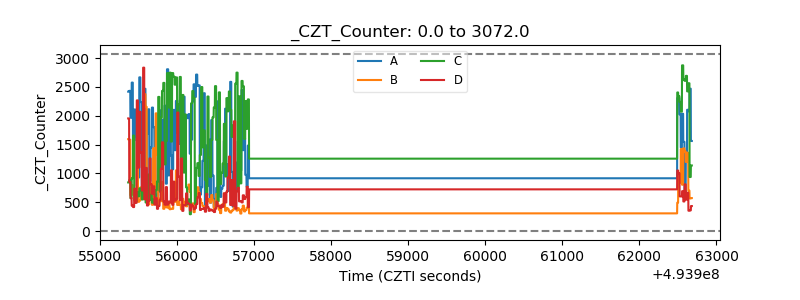 |
| +2.5 Volts monitor |  |
| +5 Volts monitor |  |
| _ROLL_ROT | 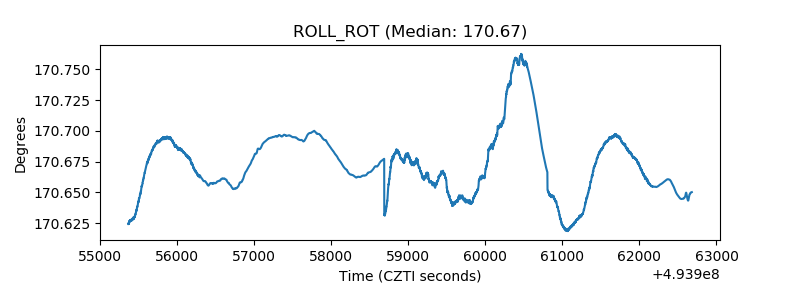 |
| _Roll_DEC | 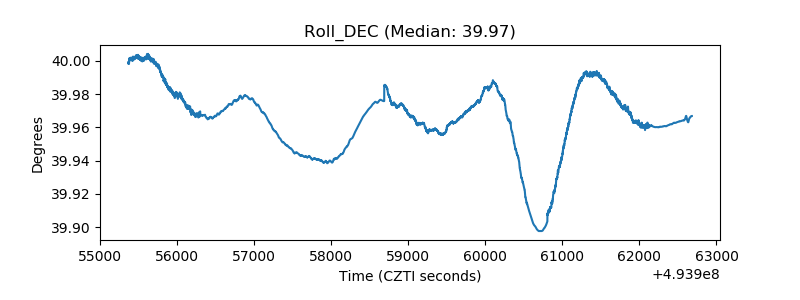 |
| _Roll_RA | 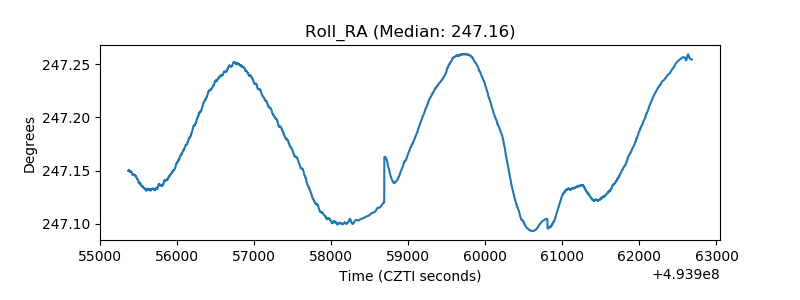 |
| Veto Counter | 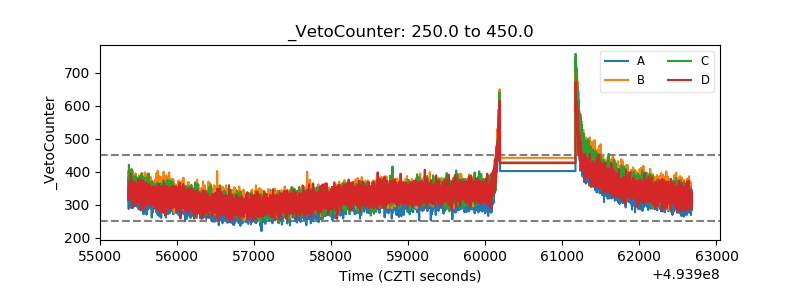 |