| Param | Original file | Final file |
|---|---|---|
| Filename | modeM0/AS1A14_004T05_9000006502_53628cztM0_level2.fits | modeM0/AS1A14_004T05_9000006502_53628cztM0_level2_quad_clean.evt |
| Size (bytes) | 871,778,880 | 83,234,880 |
| Size | 831.4 MB | 79.4 MB |
| Events in quadrant A | 8,019,517 | 533,523 |
| Events in quadrant B | 5,319,896 | 650,441 |
| Events in quadrant C | 9,910,299 | 419,677 |
| Events in quadrant D | 8,512,510 | 457,136 |
| Mode M9 | |||
|---|---|---|---|
| Quadrant | BADHDUFLAG | Total packets | Discarded packets |
| A | 0 | 11 | 0 |
| B | 0 | 11 | 0 |
| C | 0 | 11 | 0 |
| D | 0 | 11 | 0 |
| Mode SS | |||
|---|---|---|---|
| Quadrant | BADHDUFLAG | Total packets | Discarded packets |
| A | 0 | 134 | 0 |
| B | 0 | 134 | 0 |
| C | 0 | 134 | 0 |
| D | 0 | 134 | 0 |
| Mode M0 | |||
|---|---|---|---|
| Quadrant | BADHDUFLAG | Total packets | Discarded packets |
| A | 0 | 28341 | 2 |
| B | 0 | 20279 | 2 |
| C | 0 | 33947 | 3 |
| D | 0 | 29896 | 2 |
| Quadrant | Total seconds | Saturated seconds | Saturation percentage |
|---|---|---|---|
| A | 6583 | 1504 | 22.846726% |
| B | 6584 | 608 | 9.234508% |
| C | 6583 | 2433 | 36.958833% |
| D | 6583 | 1640 | 24.912654% |
Noise dominated data is calculated using 1-second bins in cleaned event files. If a bin has >2000 counts, and if more than 50% of those come from <1% of pixels, then it is considered to be noise-dominated and hence unusable.
| Quadrant | # 1 sec bins | Bins with >0 counts | Bins with >2000 counts | High rate bins dominated by noise | Noise dominated (total time) | Noise dominated (detector-on time) | Marked lightcurve |
|---|---|---|---|---|---|---|---|
| A | 7678 | 6587 | 1406 | 1406 | 18.31% | 21.35% | 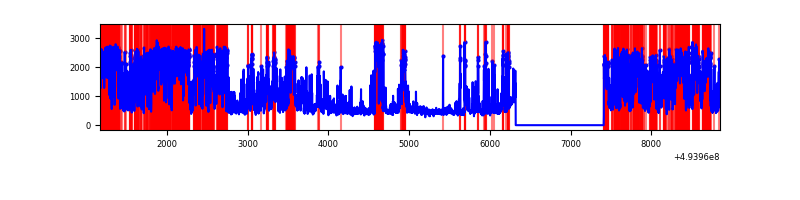 |
| B | 7679 | 6588 | 402 | 402 | 5.24% | 6.10% | 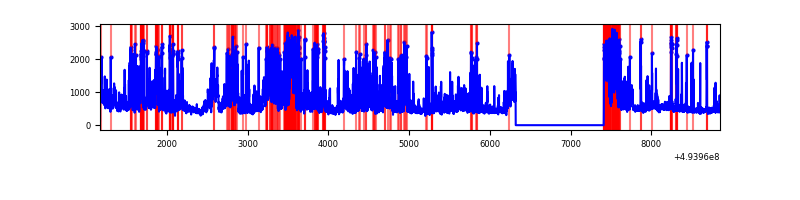 |
| C | 7678 | 6587 | 2354 | 2354 | 30.66% | 35.74% | 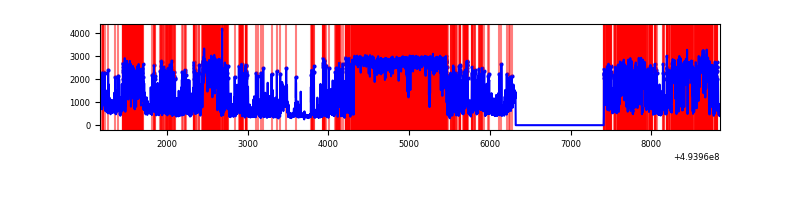 |
| D | 7678 | 6587 | 1699 | 1699 | 22.13% | 25.79% | 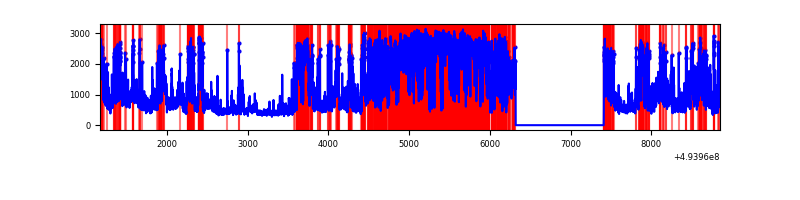 |
Top three noisy pixels from each quadrant. If the there are fewer than three noisy pixels in the level2.evt file, extra rows are filled as -1
| Pixel properties | Quadrant properties | ||||||
|---|---|---|---|---|---|---|---|
| Quadrant | DetID | PixID | Counts | Sigma | Mean | Median | Sigma |
| A | 4 | 95 | 3869382 | 23109.16 | 683 | 669 | 167.4 |
| A | 15 | 174 | 788722 | 4707.31 | 683 | 669 | 167.4 |
| A | 3 | 63 | 239244 | 1425.09 | 683 | 669 | 167.4 |
| B | 15 | 20 | 828164 | 5529.02 | 696 | 673 | 149.7 |
| B | 4 | 206 | 780275 | 5209.04 | 696 | 673 | 149.7 |
| B | 10 | 254 | 332530 | 2217.35 | 696 | 673 | 149.7 |
| C | 1 | 241 | 3814593 | 24339.14 | 570 | 568 | 156.7 |
| C | 15 | 224 | 3004976 | 19172.58 | 570 | 568 | 156.7 |
| C | 7 | 80 | 223278 | 1421.22 | 570 | 568 | 156.7 |
| D | 8 | 176 | 4599440 | 25588.65 | 626 | 599 | 179.7 |
| D | 2 | 153 | 399424 | 2219.12 | 626 | 599 | 179.7 |
| D | 10 | 172 | 328051 | 1821.99 | 626 | 599 | 179.7 |
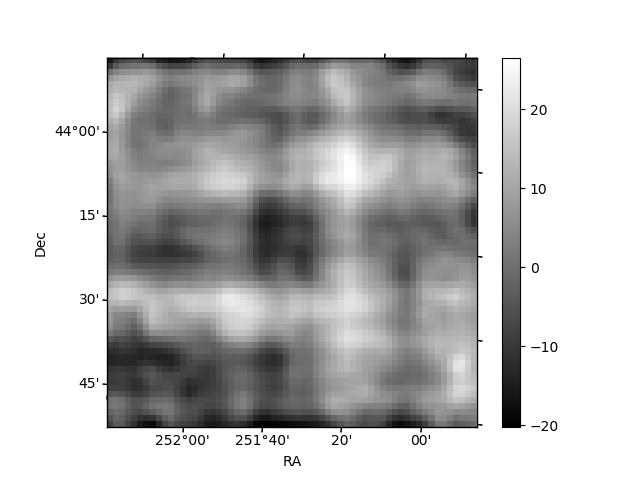
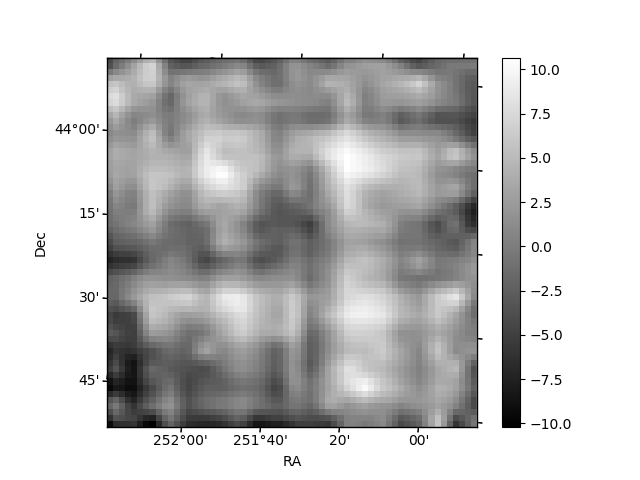
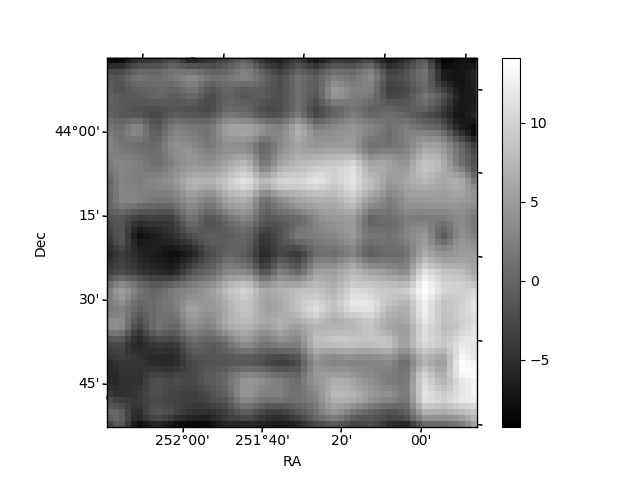
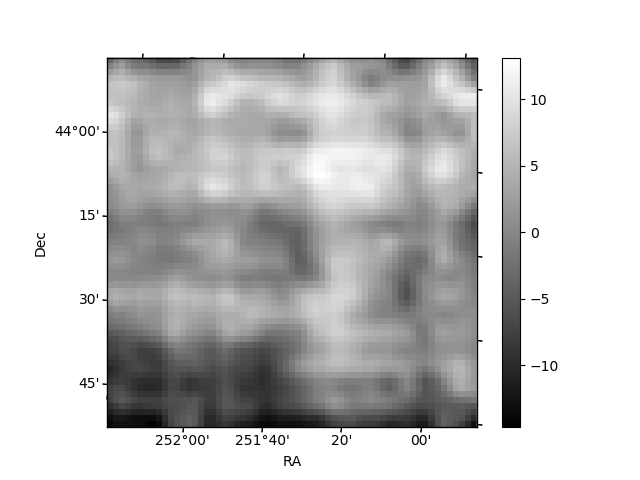
Histogram calculated using DETX and DETY for each event in the final _common_clean file
| Quadrant A | 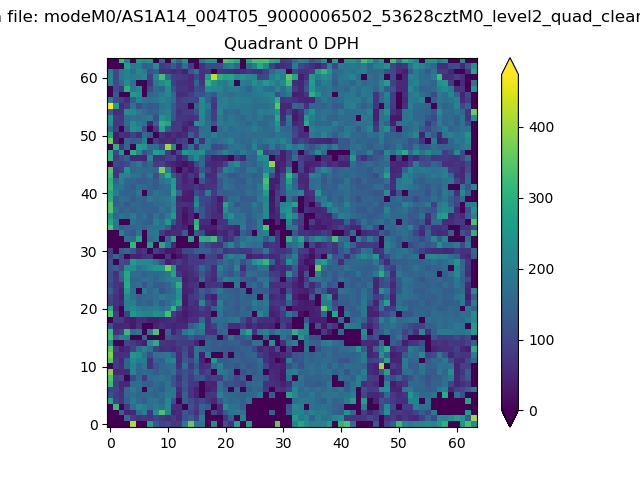 |
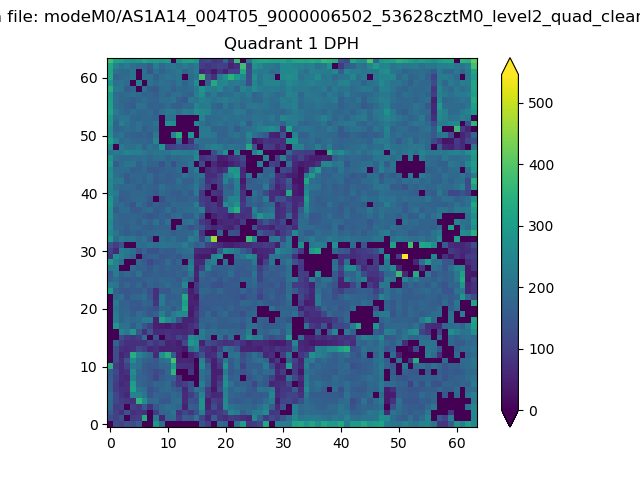 |
Quadrant B |
|---|---|---|---|
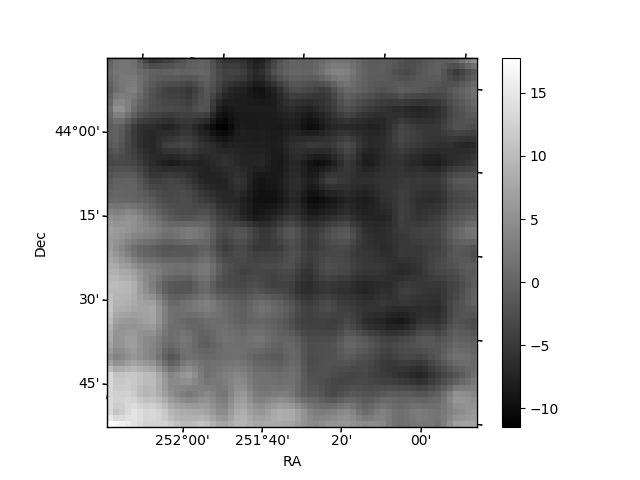
| Quadrant D | 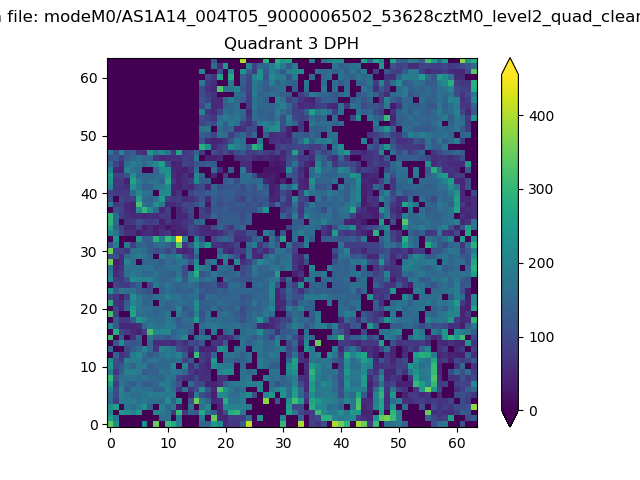 |
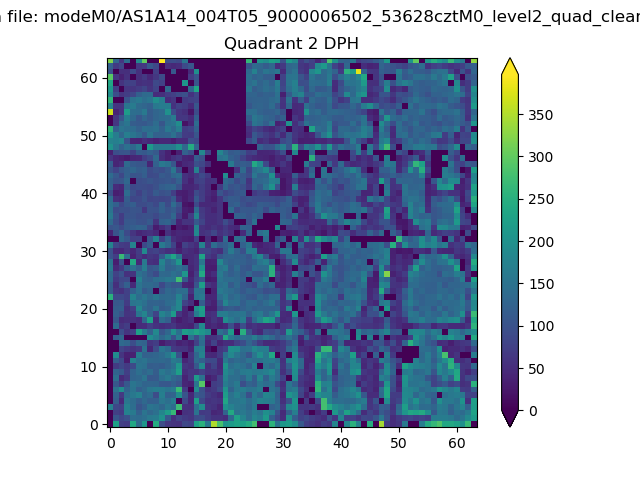 |
Quadrant C |
| Plot type | Count rate plots | Images |
|---|---|---|
| Comparison with Poisson distribution Blue bars denote a histogram of data divided into 1 sec bins. Red curve is a Poisson curve with rate = median count rate of data. |
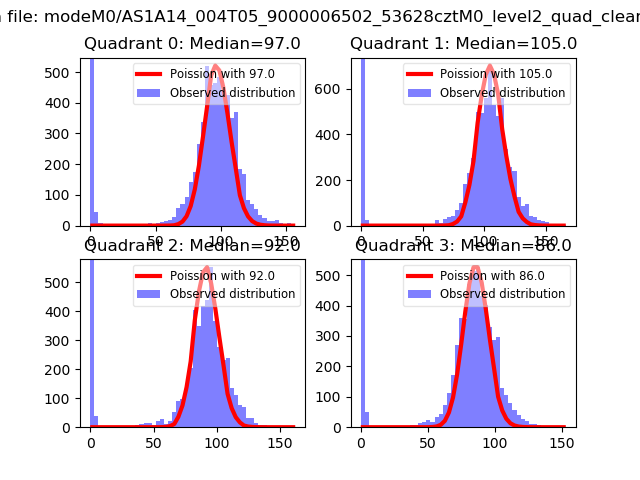 |
 |
| Quadrant-wise count rates Data is divided into 100 sec bins |
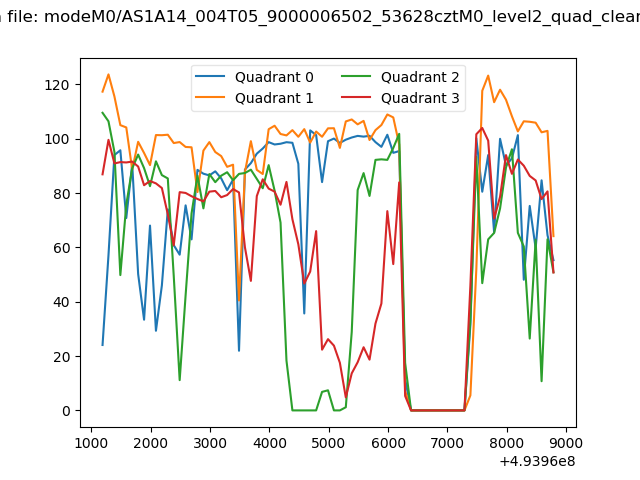 |
|
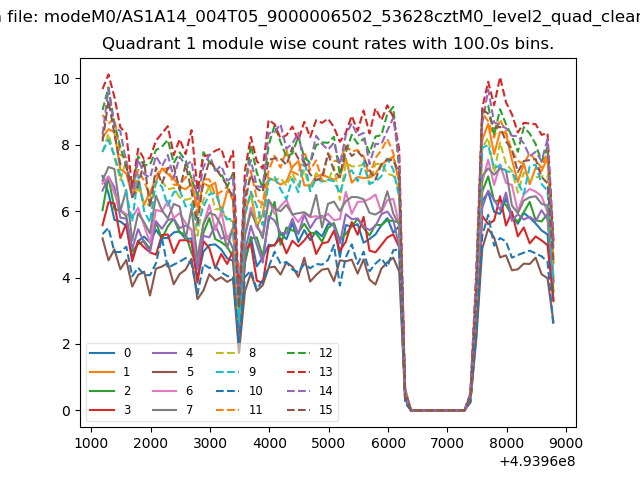
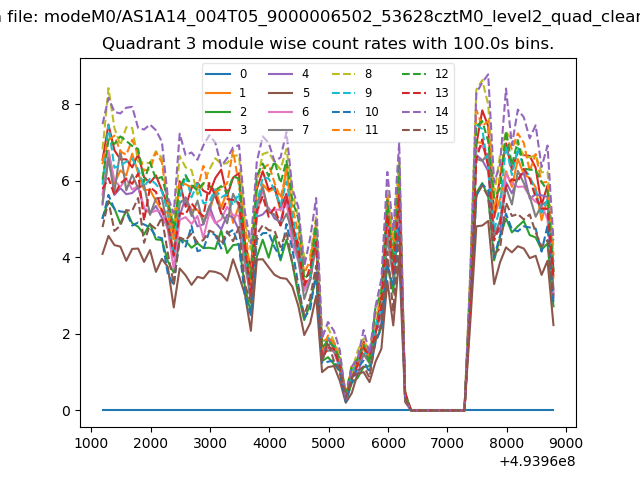
| Module-wise count rates for Quadrant A Data is divided into 100 sec bins |
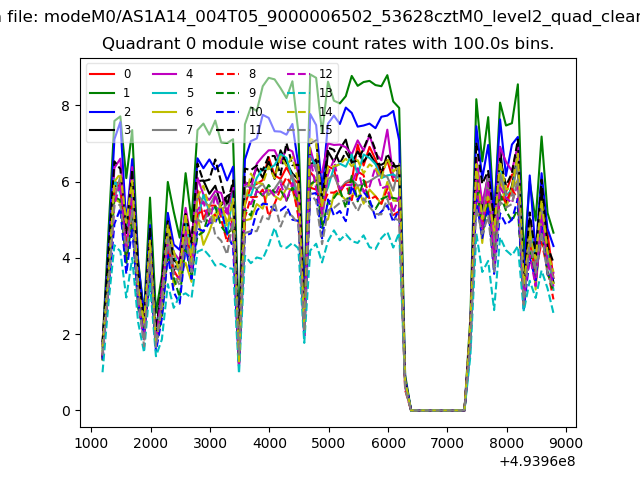 |
 |
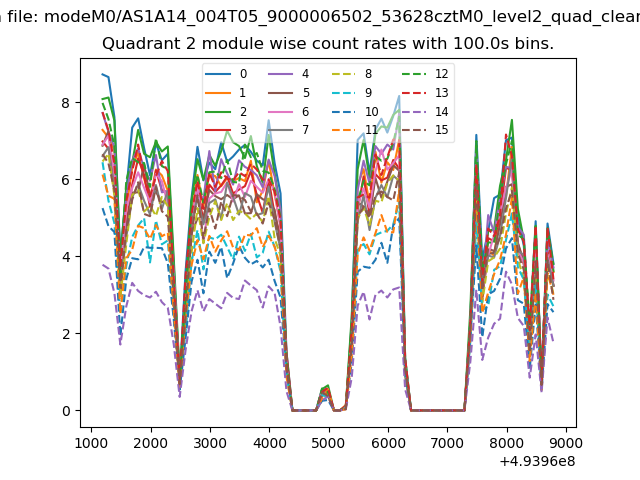
| Module-wise count rates for Quadrant B Data is divided into 100 sec bins |
 |
 |
| Module-wise count rates for Quadrant C Data is divided into 100 sec bins |
 |
 |
| Module-wise count rates for Quadrant D Data is divided into 100 sec bins |
 |
 |
| Parameter | Plot |
|---|---|
| CZT HV Monitor |  |
| D_VDD | 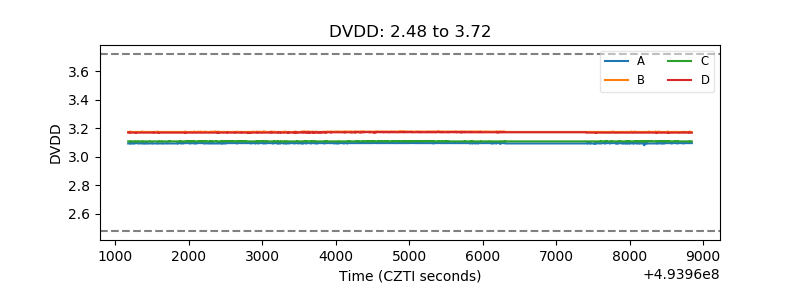 |
| Temperature 1 | 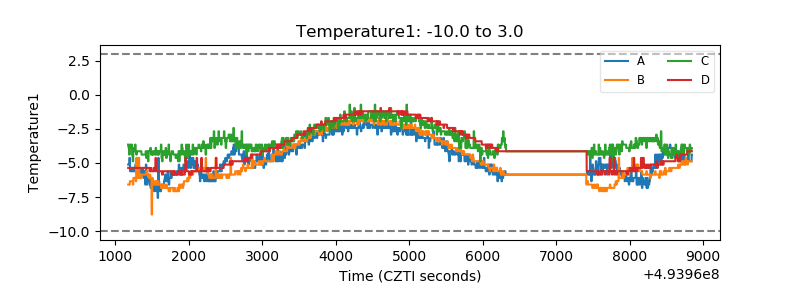 |
| Veto HV Monitor | 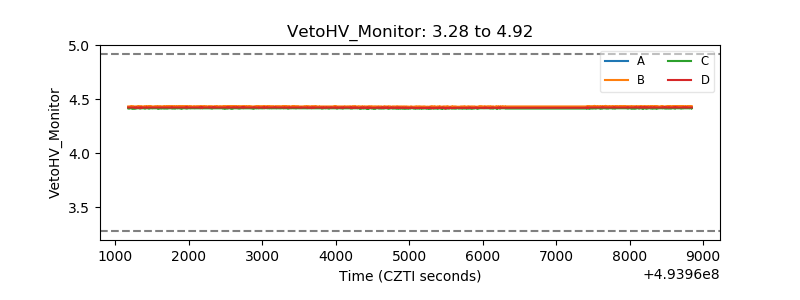 |
| Veto LLD | 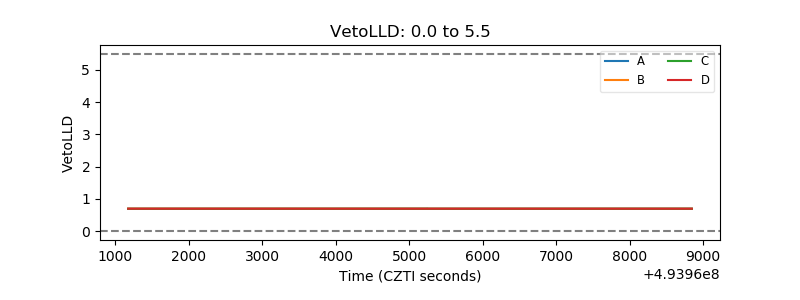 |
| Alpha Counter | 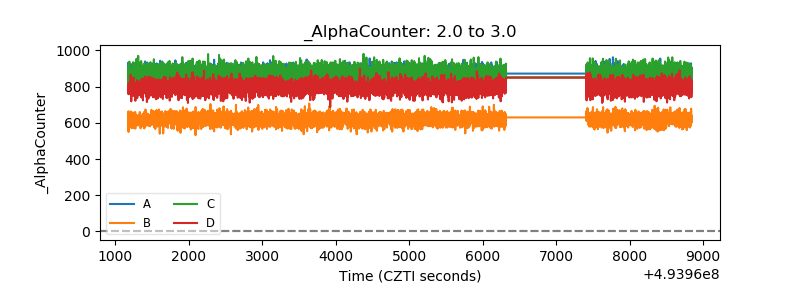 |
| _CPM_Rate | 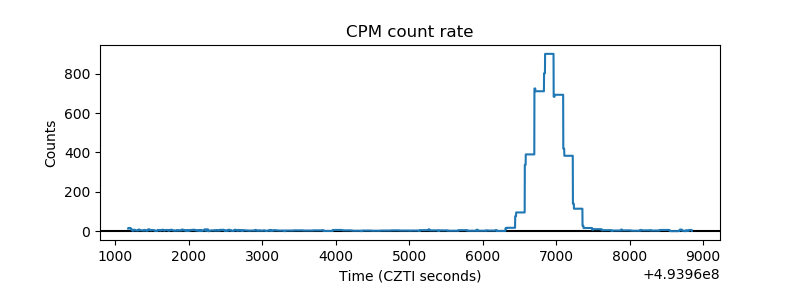 |
| CZT Counter | 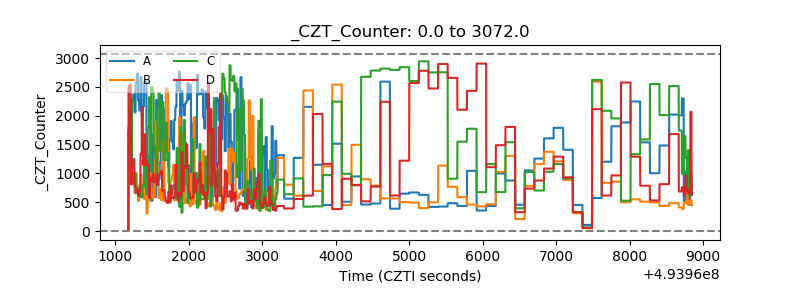 |
| +2.5 Volts monitor |  |
| +5 Volts monitor |  |
| _ROLL_ROT | 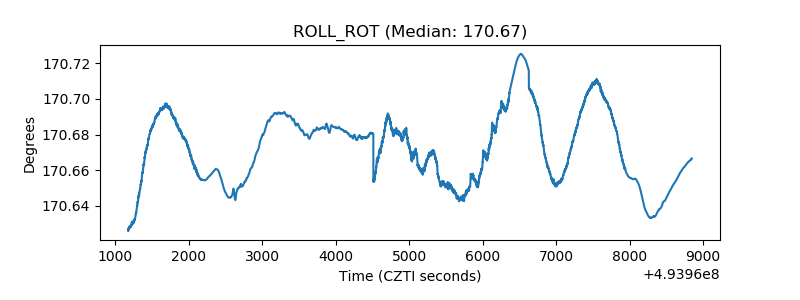 |
| _Roll_DEC | 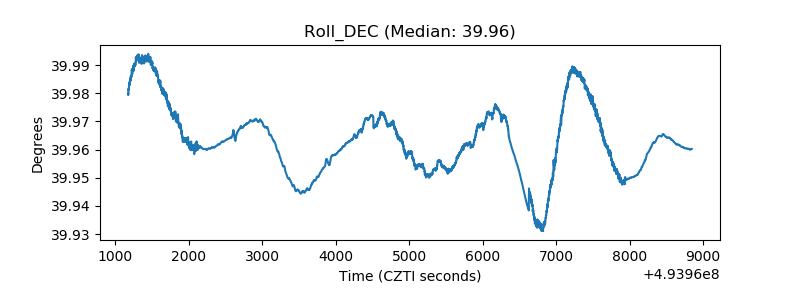 |
| _Roll_RA | 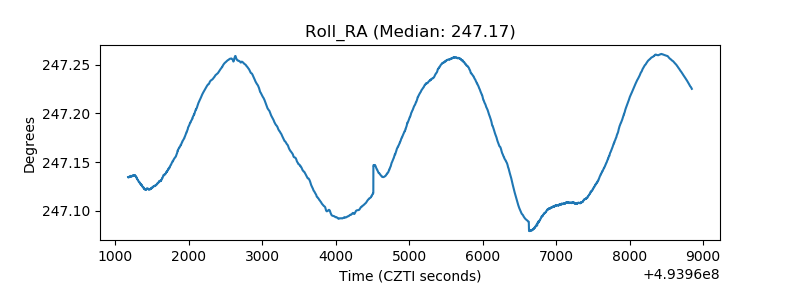 |
| Veto Counter | 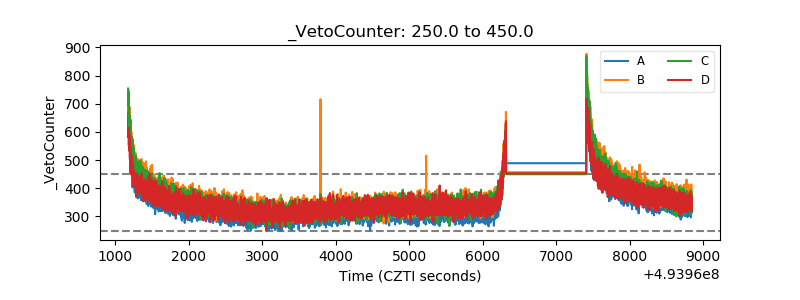 |