| Param | Original file | Final file |
|---|---|---|
| Filename | modeM0/AS1A14_004T05_9000006502_53629cztM0_level2.fits | modeM0/AS1A14_004T05_9000006502_53629cztM0_level2_quad_clean.evt |
| Size (bytes) | 545,279,040 | 56,030,400 |
| Size | 520.0 MB | 53.4 MB |
| Events in quadrant A | 3,980,588 | 395,012 |
| Events in quadrant B | 3,020,279 | 437,400 |
| Events in quadrant C | 7,276,399 | 248,933 |
| Events in quadrant D | 5,573,522 | 312,504 |
| Mode M9 | |||
|---|---|---|---|
| Quadrant | BADHDUFLAG | Total packets | Discarded packets |
| A | 0 | 6 | 0 |
| B | 0 | 6 | 0 |
| C | 0 | 7 | 0 |
| D | 0 | 7 | 0 |
| Mode SS | |||
|---|---|---|---|
| Quadrant | BADHDUFLAG | Total packets | Discarded packets |
| A | 0 | 86 | 0 |
| B | 0 | 86 | 0 |
| C | 0 | 86 | 0 |
| D | 0 | 86 | 0 |
| Mode M0 | |||
|---|---|---|---|
| Quadrant | BADHDUFLAG | Total packets | Discarded packets |
| A | 0 | 14793 | 1 |
| B | 0 | 11862 | 1 |
| C | 0 | 24495 | 2 |
| D | 0 | 19516 | 1 |
| Quadrant | Total seconds | Saturated seconds | Saturation percentage |
|---|---|---|---|
| A | 4299 | 568 | 13.212375% |
| B | 4299 | 302 | 7.024890% |
| C | 4298 | 1901 | 44.229874% |
| D | 4298 | 1028 | 23.918101% |
Noise dominated data is calculated using 1-second bins in cleaned event files. If a bin has >2000 counts, and if more than 50% of those come from <1% of pixels, then it is considered to be noise-dominated and hence unusable.
| Quadrant | # 1 sec bins | Bins with >0 counts | Bins with >2000 counts | High rate bins dominated by noise | Noise dominated (total time) | Noise dominated (detector-on time) | Marked lightcurve |
|---|---|---|---|---|---|---|---|
| A | 4303 | 4303 | 518 | 518 | 12.04% | 12.04% | 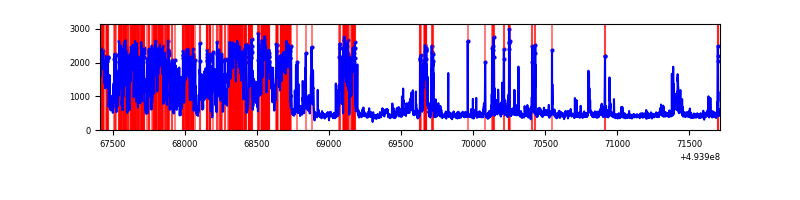 |
| B | 4303 | 4303 | 237 | 237 | 5.51% | 5.51% | 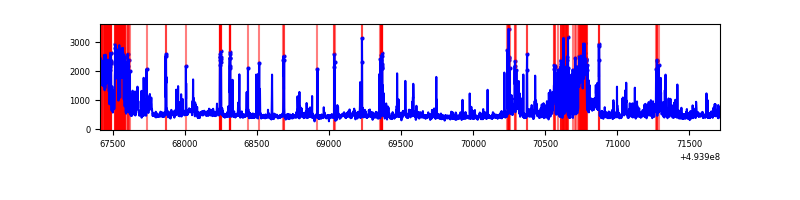 |
| C | 4303 | 4303 | 1885 | 1885 | 43.81% | 43.81% | 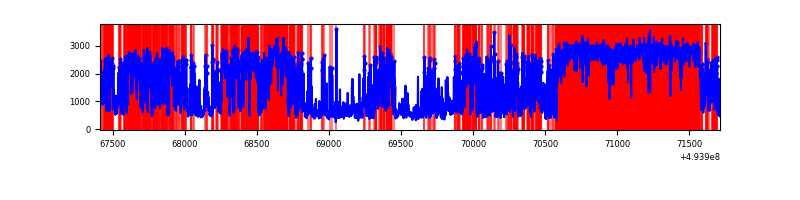 |
| D | 4303 | 4303 | 1098 | 1098 | 25.52% | 25.52% | 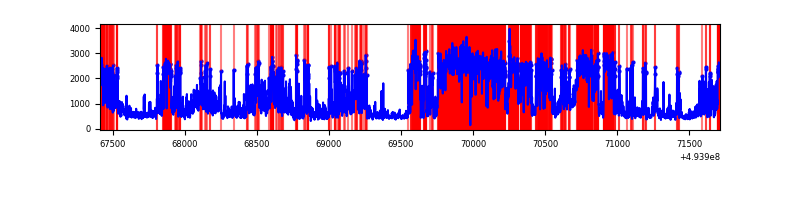 |
Top three noisy pixels from each quadrant. If the there are fewer than three noisy pixels in the level2.evt file, extra rows are filled as -1
| Pixel properties | Quadrant properties | ||||||
|---|---|---|---|---|---|---|---|
| Quadrant | DetID | PixID | Counts | Sigma | Mean | Median | Sigma |
| A | 4 | 95 | 1439282 | 12580.32 | 458 | 448 | 114.4 |
| A | 15 | 174 | 301427 | 2631.58 | 458 | 448 | 114.4 |
| A | 3 | 63 | 233746 | 2039.82 | 458 | 448 | 114.4 |
| B | 4 | 206 | 493712 | 5062.36 | 449 | 434 | 97.4 |
| B | 15 | 20 | 250745 | 2568.86 | 449 | 434 | 97.4 |
| B | 10 | 247 | 209001 | 2140.46 | 449 | 434 | 97.4 |
| C | 1 | 241 | 3043299 | 31983.35 | 340 | 337 | 95.1 |
| C | 15 | 224 | 2233887 | 23475.94 | 340 | 337 | 95.1 |
| C | 5 | 10 | 172591 | 1810.49 | 340 | 337 | 95.1 |
| D | 8 | 176 | 2709265 | 23062.57 | 408 | 391 | 117.5 |
| D | 0 | 5 | 324879 | 2762.6 | 408 | 391 | 117.5 |
| D | 2 | 153 | 204776 | 1740.08 | 408 | 391 | 117.5 |
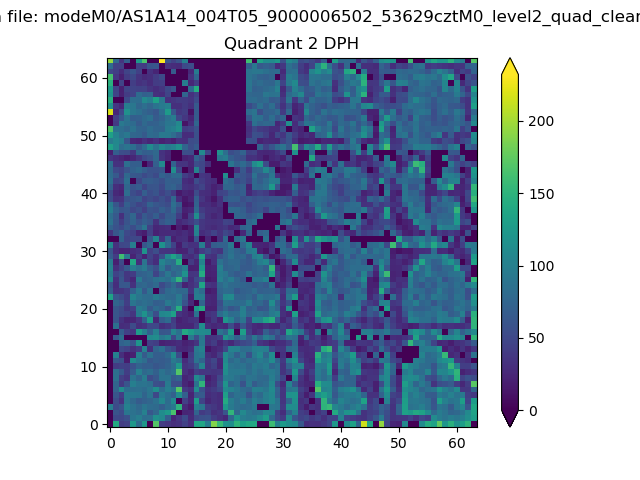
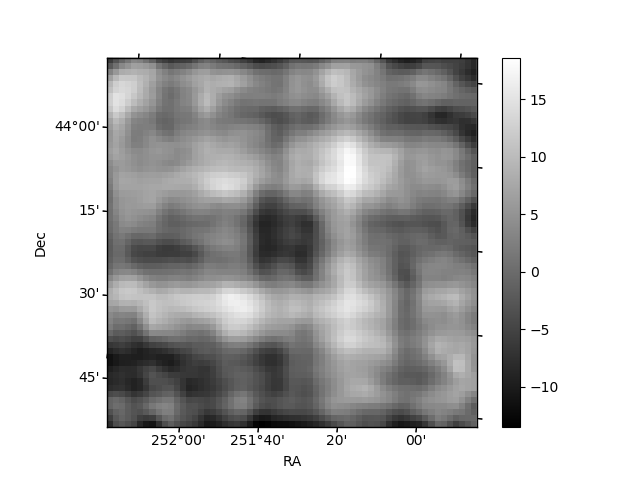
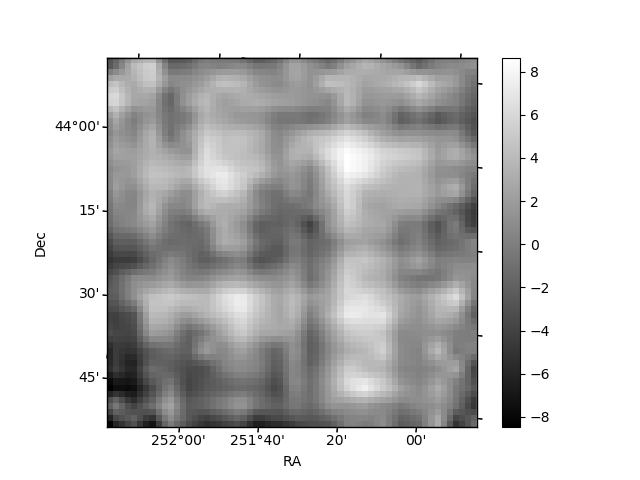
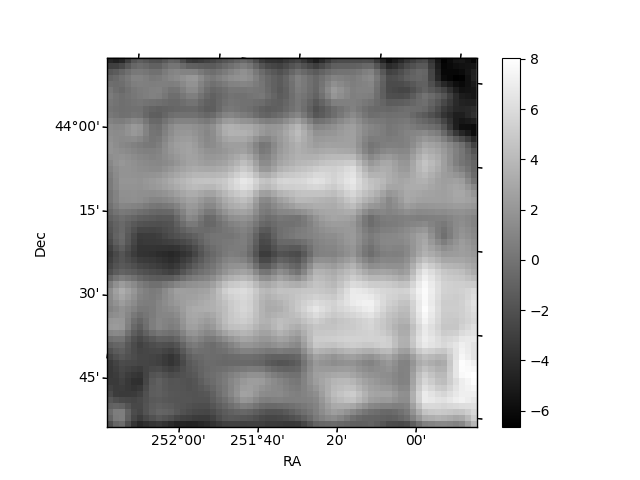
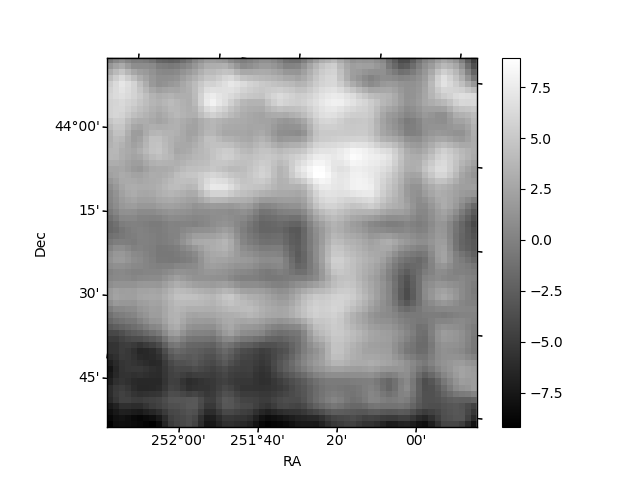
Histogram calculated using DETX and DETY for each event in the final _common_clean file
| Quadrant A | 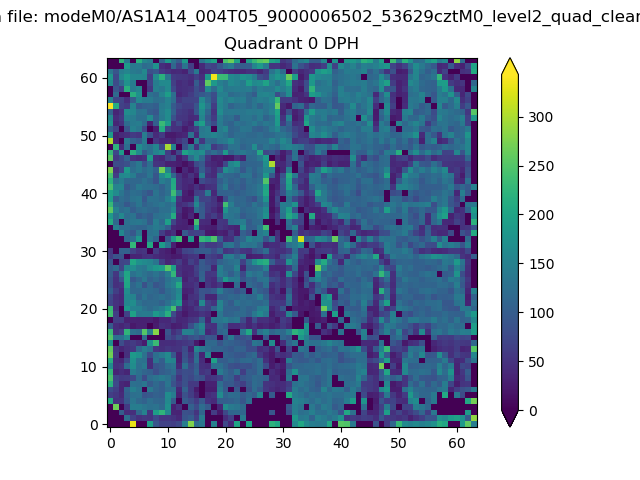 |
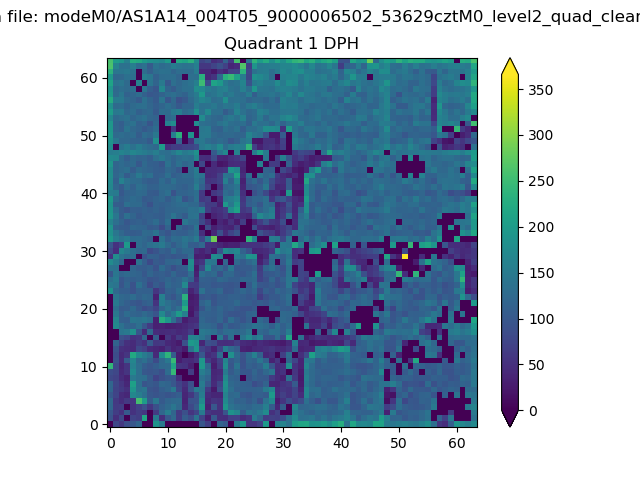 |
Quadrant B |
|---|---|---|---|
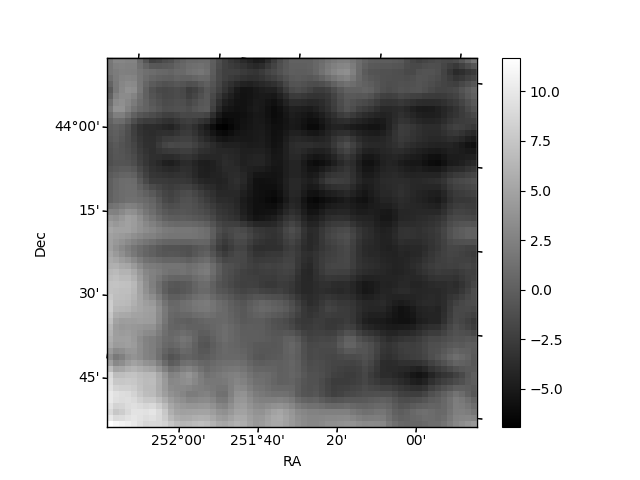
| Quadrant D | 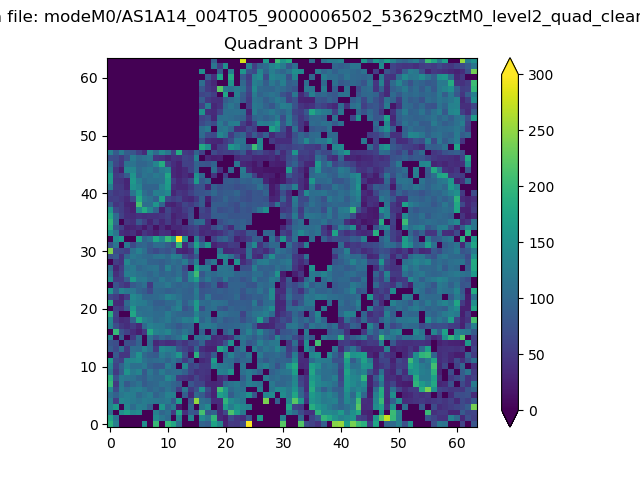 |
 |
Quadrant C |
| Plot type | Count rate plots | Images |
|---|---|---|
| Comparison with Poisson distribution Blue bars denote a histogram of data divided into 1 sec bins. Red curve is a Poisson curve with rate = median count rate of data. |
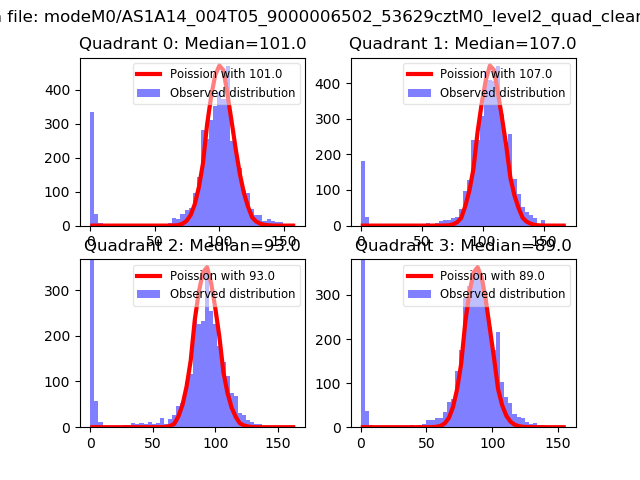 |
 |
| Quadrant-wise count rates Data is divided into 100 sec bins |
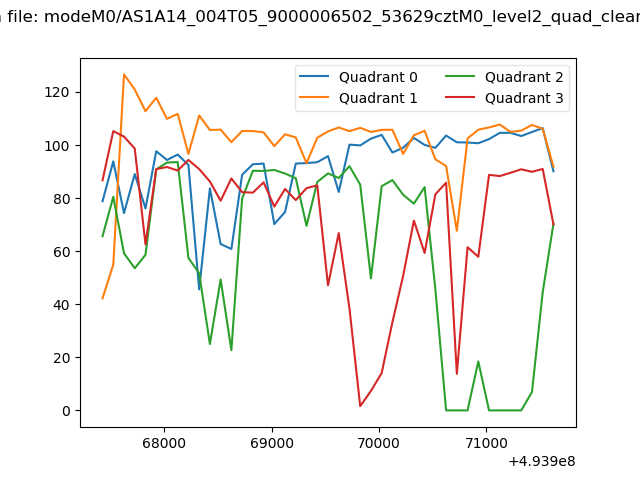 |
|
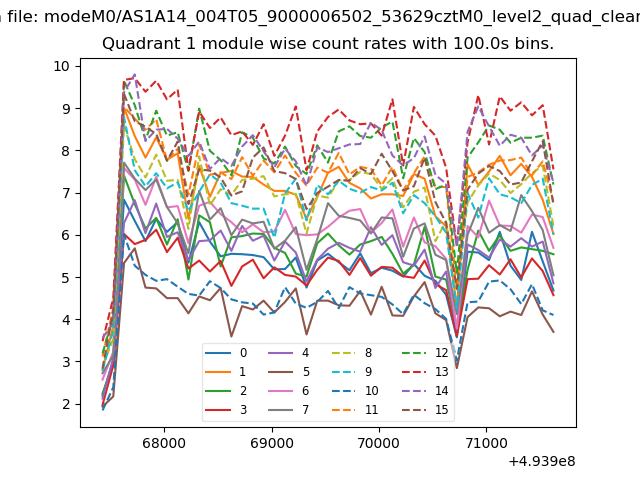
| Module-wise count rates for Quadrant A Data is divided into 100 sec bins |
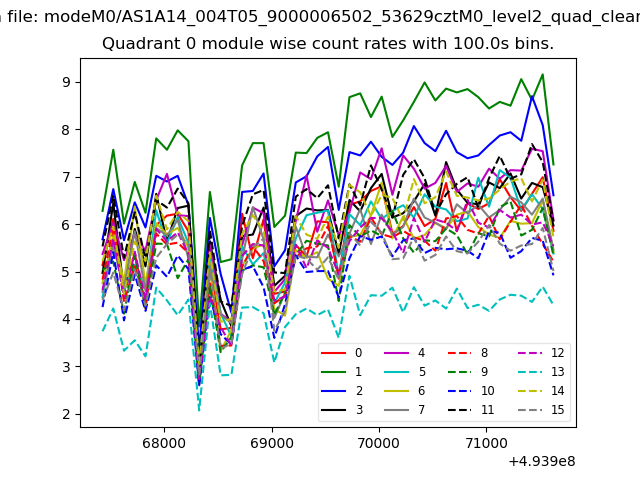 |
 |
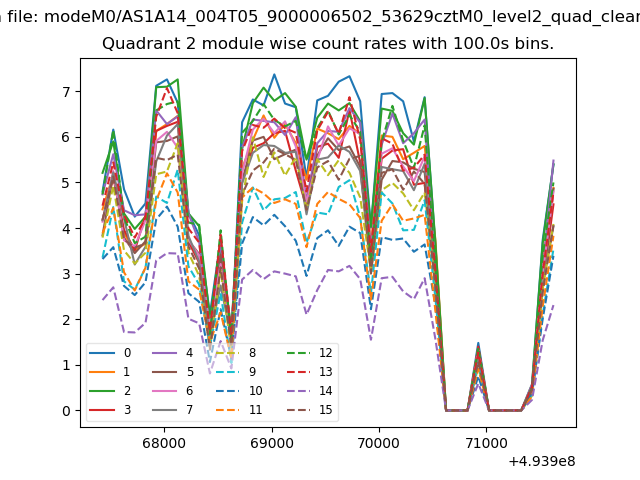
| Module-wise count rates for Quadrant B Data is divided into 100 sec bins |
 |
 |
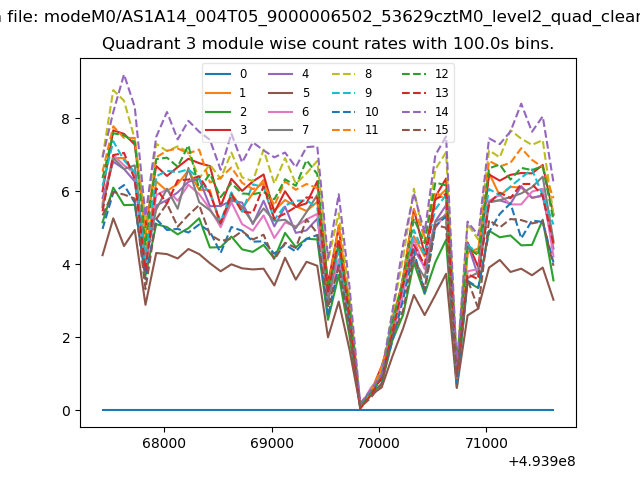
| Module-wise count rates for Quadrant C Data is divided into 100 sec bins |
 |
 |
| Module-wise count rates for Quadrant D Data is divided into 100 sec bins |
 |
 |
| Parameter | Plot |
|---|---|
| CZT HV Monitor | 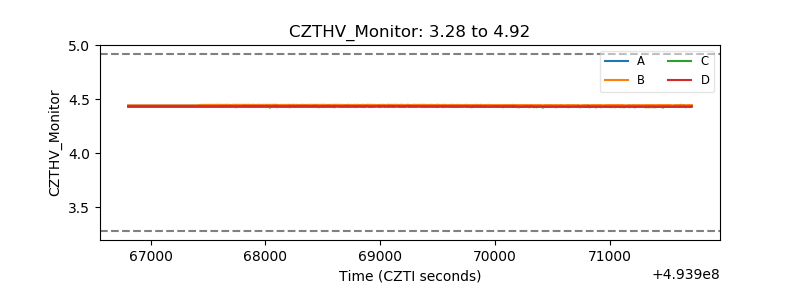 |
| D_VDD |  |
| Temperature 1 | 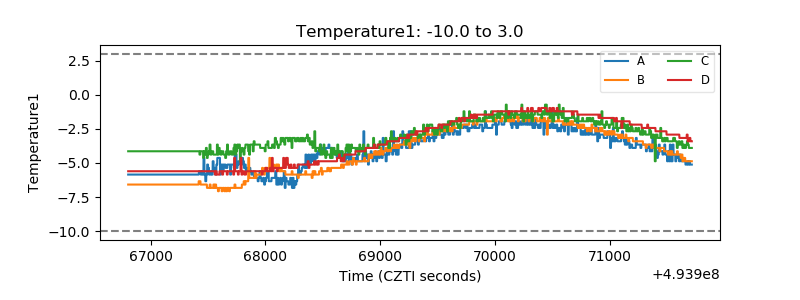 |
| Veto HV Monitor | 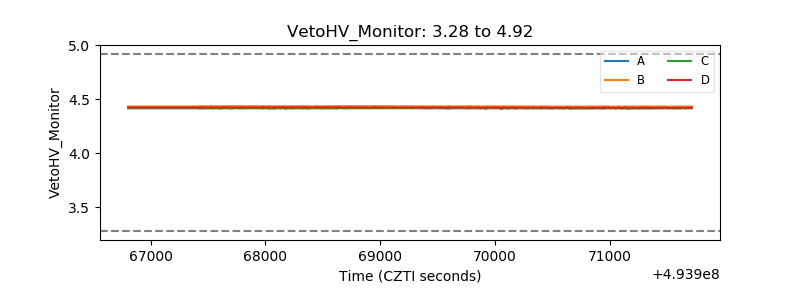 |
| Veto LLD | 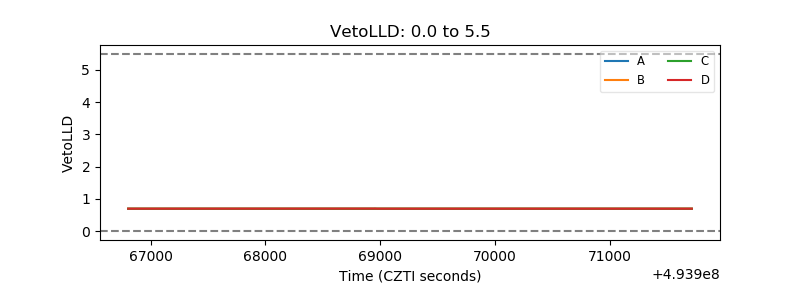 |
| Alpha Counter | 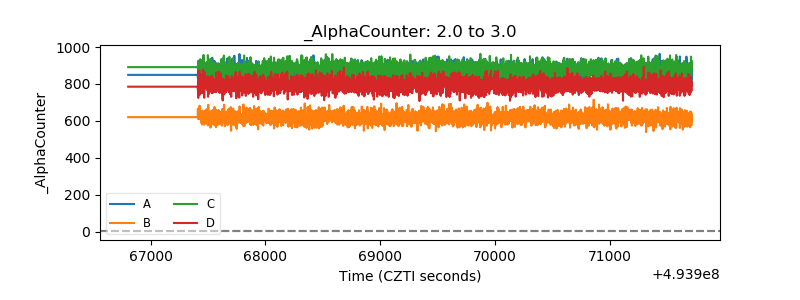 |
| _CPM_Rate | 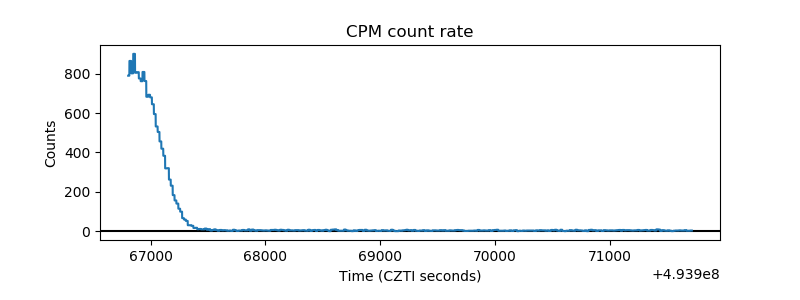 |
| CZT Counter | 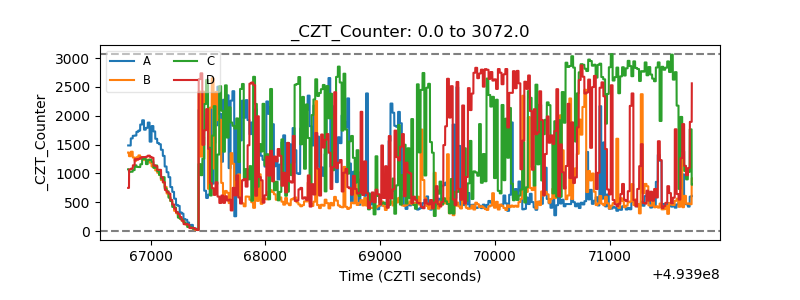 |
| +2.5 Volts monitor |  |
| +5 Volts monitor |  |
| _ROLL_ROT | 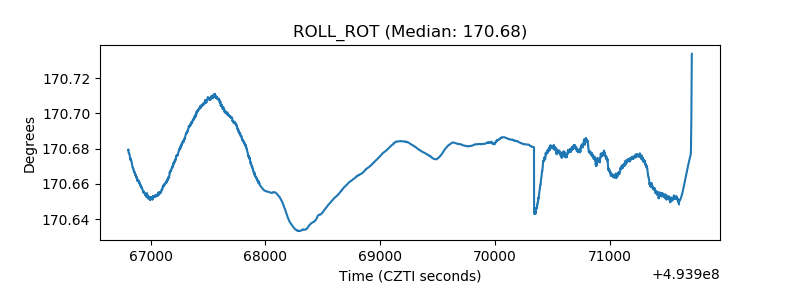 |
| _Roll_DEC | 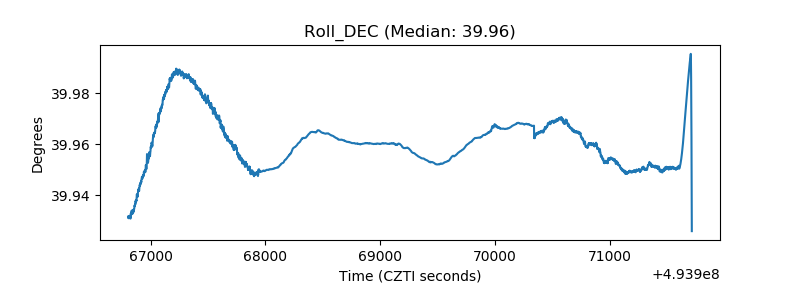 |
| _Roll_RA | 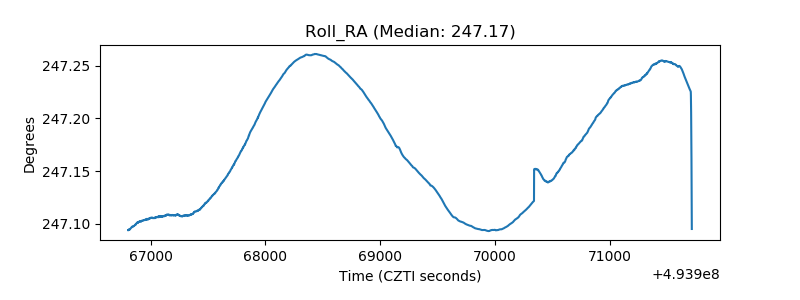 |
| Veto Counter | 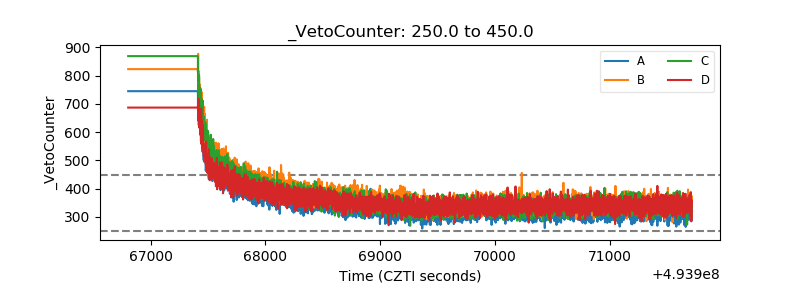 |