| Param | Original file | Final file |
|---|---|---|
| Filename | modeM0/AS1A14_022T05_9000006504cztM0_level2.fits | modeM0/AS1A14_022T05_9000006504cztM0_level2_quad_clean.evt |
| Size (bytes) | 2,671,269,120 | 1,146,484,800 |
| Size | 2.5 GB | 1.1 GB |
| Events in quadrant A | 12,663,096 | 1,999,927 |
| Events in quadrant B | 16,567,854 | 3,117,432 |
| Events in quadrant C | 11,650,506 | 1,487,406 |
| Events in quadrant D | 14,445,818 | 2,762,396 |
| Mode SS | |||
|---|---|---|---|
| Quadrant | BADHDUFLAG | Total packets | Discarded packets |
| A | 0 | 7526 | 0 |
| B | 0 | 7528 | 0 |
| C | 0 | 7522 | 0 |
| D | 0 | 7526 | 0 |
| Mode M9 | |||
|---|---|---|---|
| Quadrant | BADHDUFLAG | Total packets | Discarded packets |
| A | 0 | 447 | 0 |
| B | 0 | 451 | 0 |
| C | 0 | 447 | 0 |
| D | 0 | 449 | 0 |
| Mode M0 | |||
|---|---|---|---|
| Quadrant | BADHDUFLAG | Total packets | Discarded packets |
| A | 0 | 2247706 | 0 |
| B | 0 | 1171410 | 0 |
| C | 0 | 2227151 | 0 |
| D | 0 | 1364162 | 0 |
| Quadrant | Total seconds | Saturated seconds | Saturation percentage |
|---|---|---|---|
| A | 369130 | 206086 | 55.830195% |
| B | 370167 | 47183 | 12.746409% |
| C | 369439 | 196799 | 53.269687% |
| D | 370078 | 56104 | 15.160047% |
Noise dominated data is calculated using 1-second bins in cleaned event files. If a bin has >2000 counts, and if more than 50% of those come from <1% of pixels, then it is considered to be noise-dominated and hence unusable.
| Quadrant | # 1 sec bins | Bins with >0 counts | Bins with >2000 counts | High rate bins dominated by noise | Noise dominated (total time) | Noise dominated (detector-on time) | Marked lightcurve |
|---|---|---|---|---|---|---|---|
| A | 433903 | 364819 | 0 | 0 | 0.00% | 0.00% | 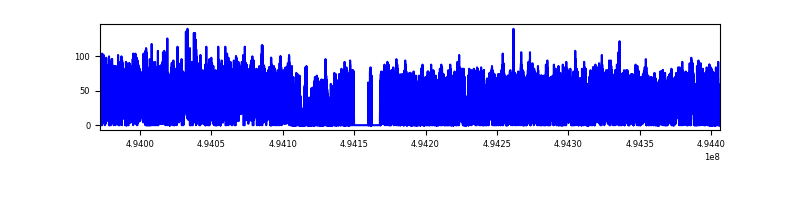 |
| B | 433901 | 367741 | 0 | 0 | 0.00% | 0.00% | 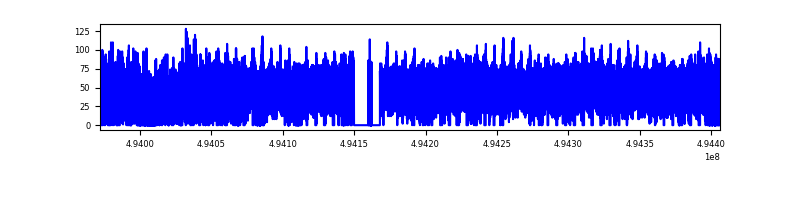 |
| C | 433901 | 360494 | 0 | 0 | 0.00% | 0.00% | 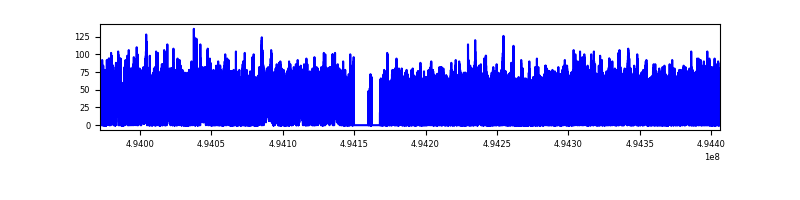 |
| D | 433901 | 366197 | 0 | 0 | 0.00% | 0.00% | 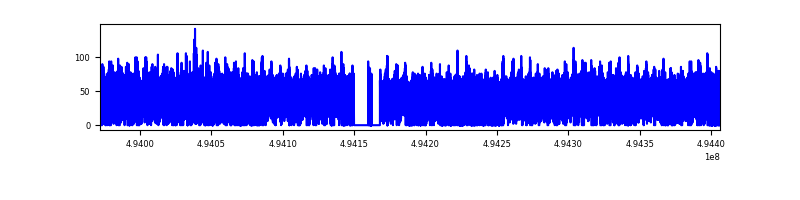 |
Top three noisy pixels from each quadrant. If the there are fewer than three noisy pixels in the level2.evt file, extra rows are filled as -1
| Pixel properties | Quadrant properties | ||||||
|---|---|---|---|---|---|---|---|
| Quadrant | DetID | PixID | Counts | Sigma | Mean | Median | Sigma |
| A | 14 | 188 | 14636 | 10.39 | 3345 | 3094 | 1110.6 |
| A | 9 | 255 | 13029 | 8.95 | 3345 | 3094 | 1110.6 |
| A | 14 | 204 | 11637 | 7.69 | 3345 | 3094 | 1110.6 |
| B | 2 | 9 | 19052 | 14.72 | 4391 | 4153 | 1012.3 |
| B | 2 | 8 | 17034 | 12.72 | 4391 | 4153 | 1012.3 |
| B | 3 | 25 | 13848 | 9.58 | 4391 | 4153 | 1012.3 |
| C | 2 | 31 | 9274 | 5.99 | 3142 | 2856 | 1071.2 |
| C | 3 | 203 | 9097 | 5.83 | 3142 | 2856 | 1071.2 |
| C | 3 | 202 | 9034 | 5.77 | 3142 | 2856 | 1071.2 |
| D | 6 | 218 | 18821 | 10.89 | 4149 | 3678 | 1390.0 |
| D | 15 | 11 | 14166 | 7.54 | 4149 | 3678 | 1390.0 |
| D | 8 | 12 | 13156 | 6.82 | 4149 | 3678 | 1390.0 |
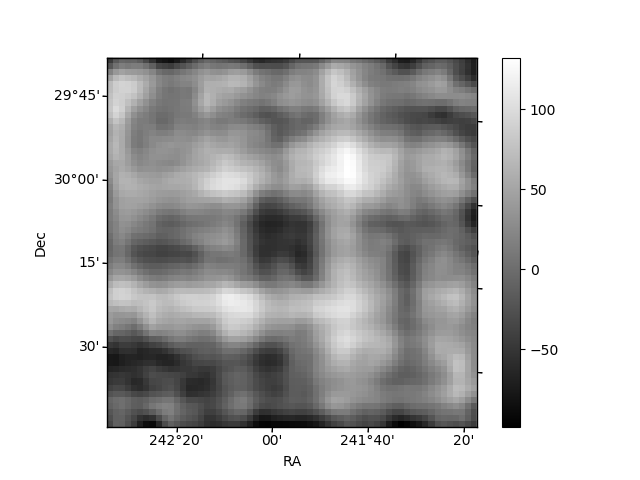
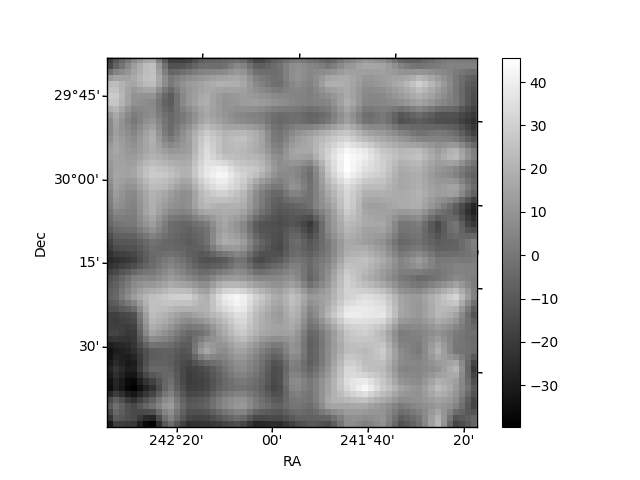
Histogram calculated using DETX and DETY for each event in the final _common_clean file
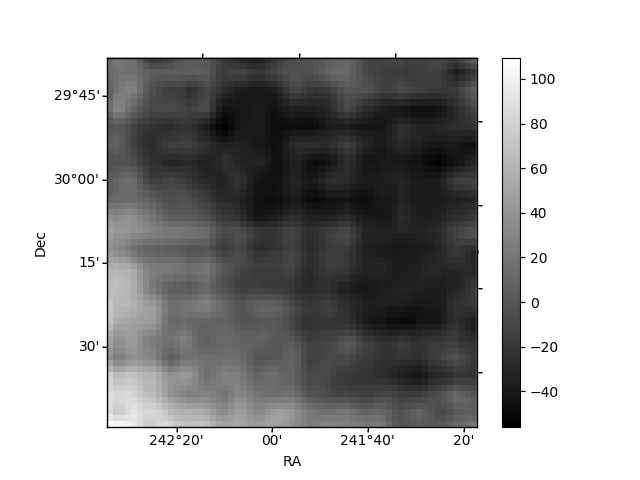
| Quadrant A | 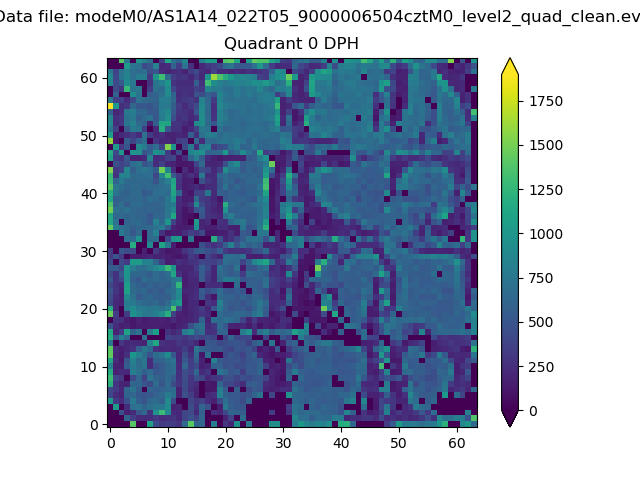 |
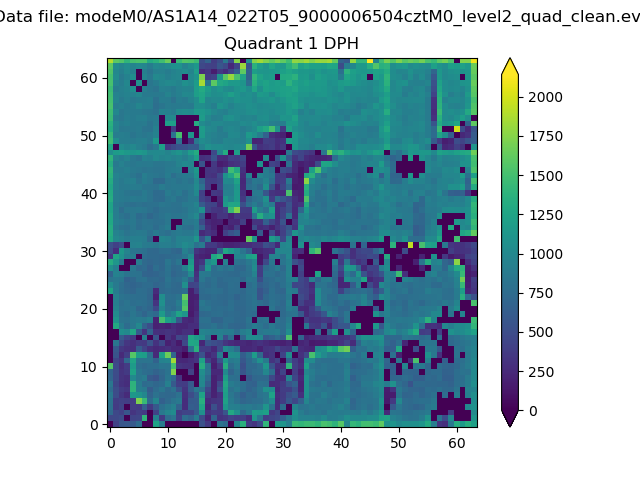 |
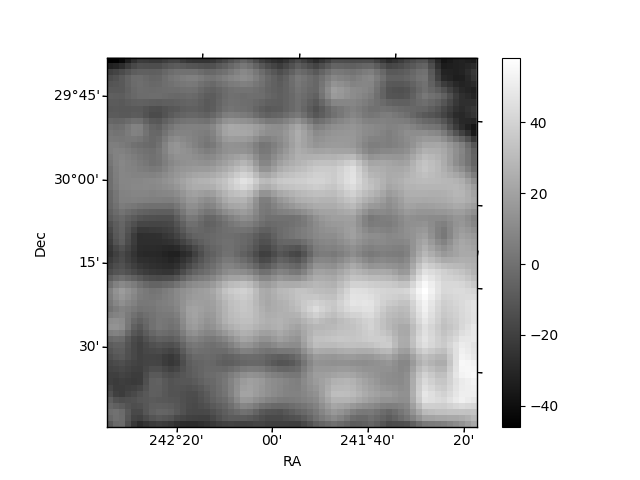
Quadrant B |
|---|---|---|---|
| Quadrant D |  |
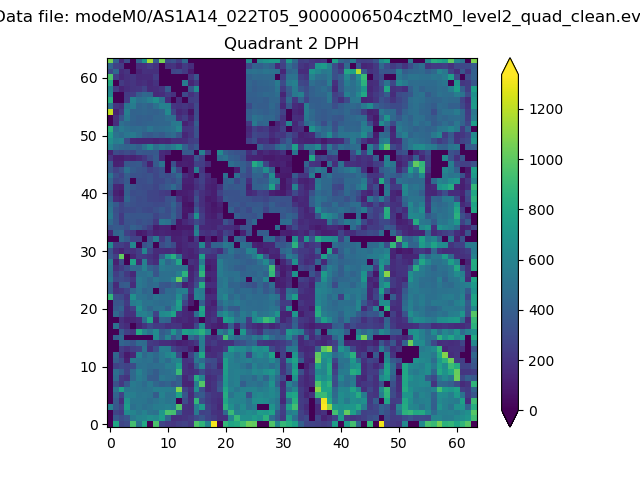 |
Quadrant C |
| Plot type | Count rate plots | Images |
|---|---|---|
| Comparison with Poisson distribution Blue bars denote a histogram of data divided into 1 sec bins. Red curve is a Poisson curve with rate = median count rate of data. |
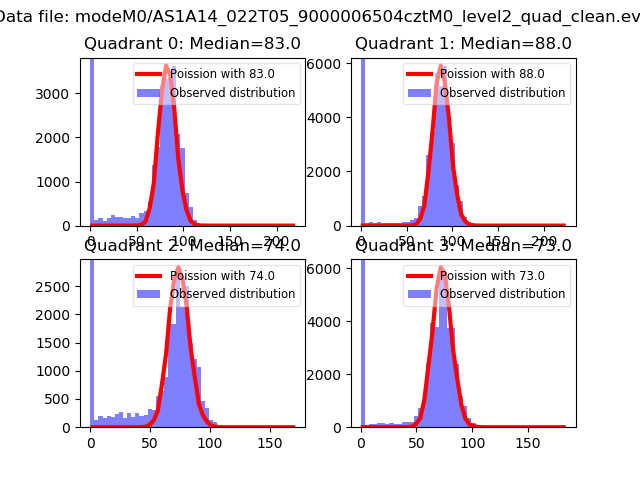 |
 |
| Quadrant-wise count rates Data is divided into 100 sec bins |
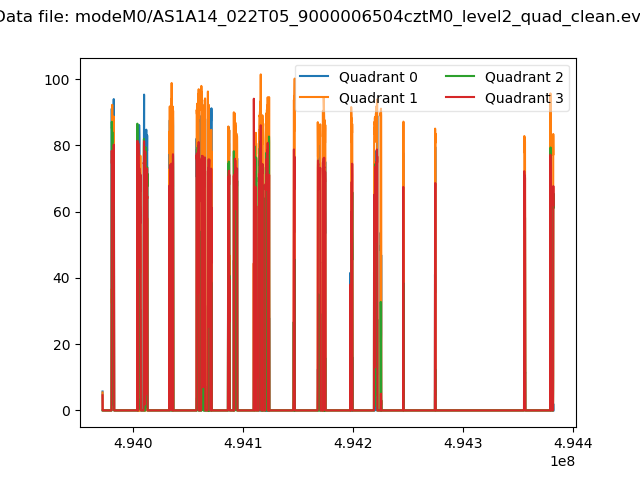 |
|
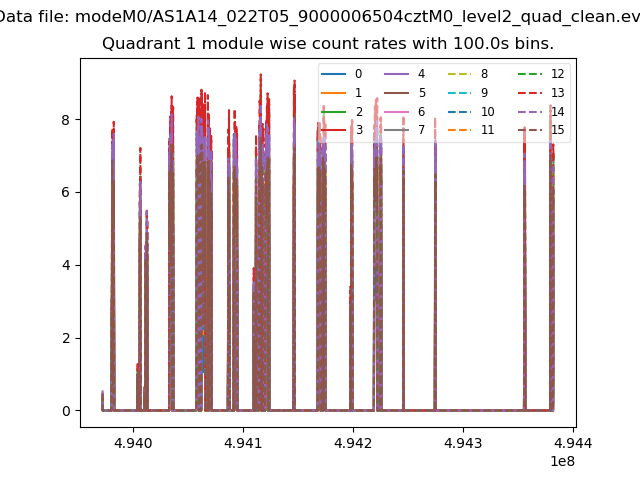
| Module-wise count rates for Quadrant A Data is divided into 100 sec bins |
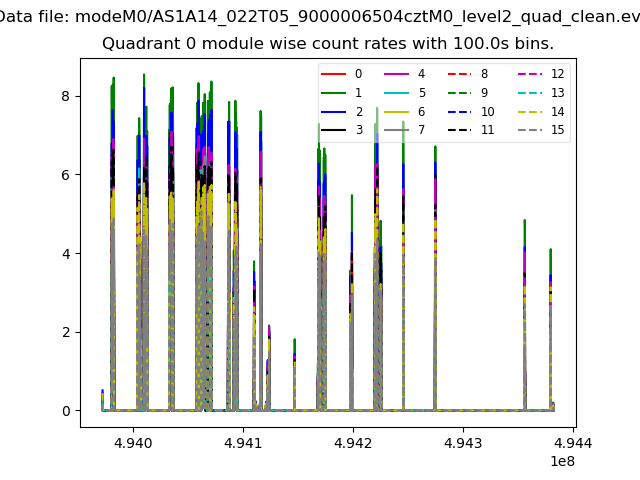 |
 |
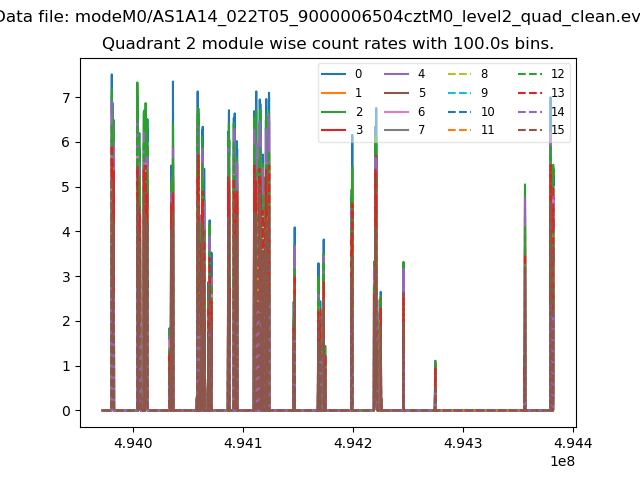
| Module-wise count rates for Quadrant B Data is divided into 100 sec bins |
 |
 |
| Module-wise count rates for Quadrant C Data is divided into 100 sec bins |
 |
 |
| Module-wise count rates for Quadrant D Data is divided into 100 sec bins |
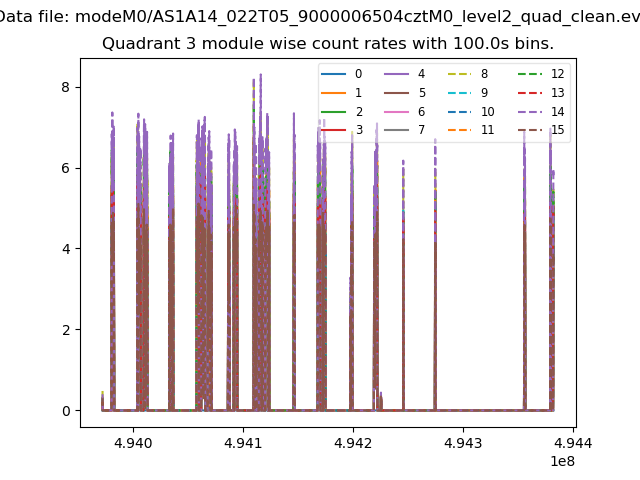 |
 |
| Parameter | Plot |
|---|---|
| CZT HV Monitor | 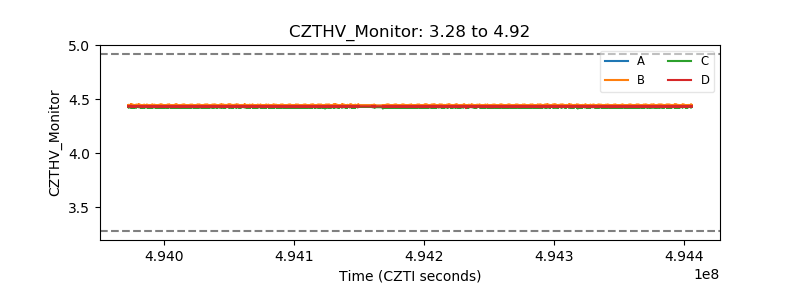 |
| D_VDD | 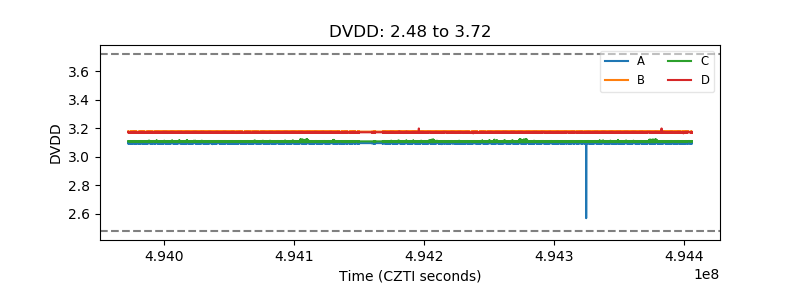 |
| Temperature 1 | 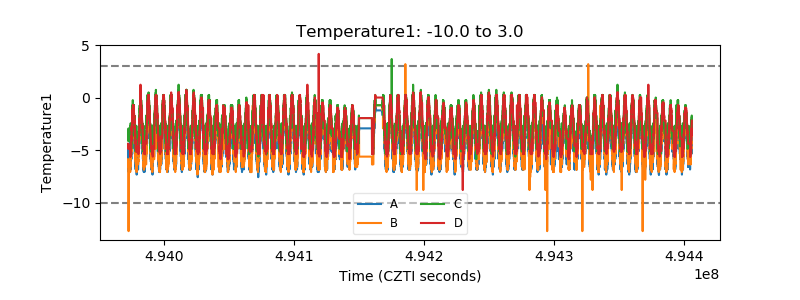 |
| Veto HV Monitor | 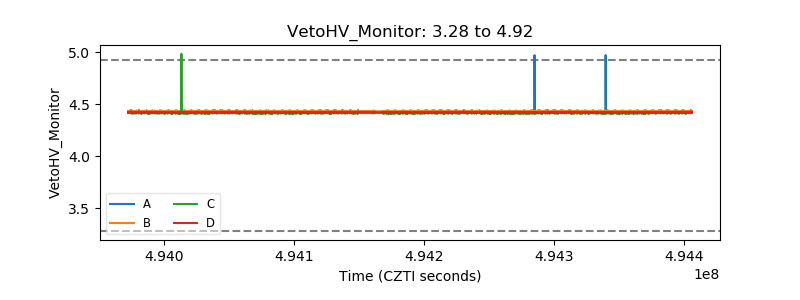 |
| Veto LLD | 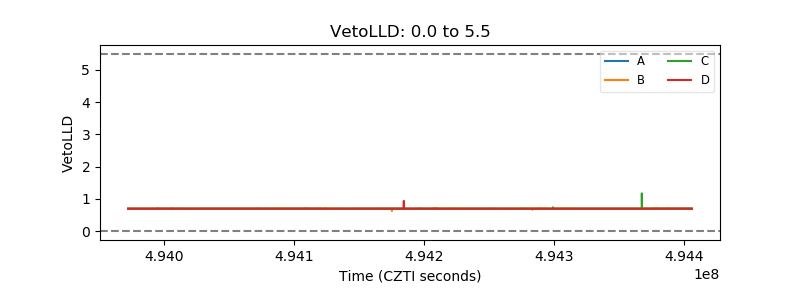 |
| Alpha Counter | 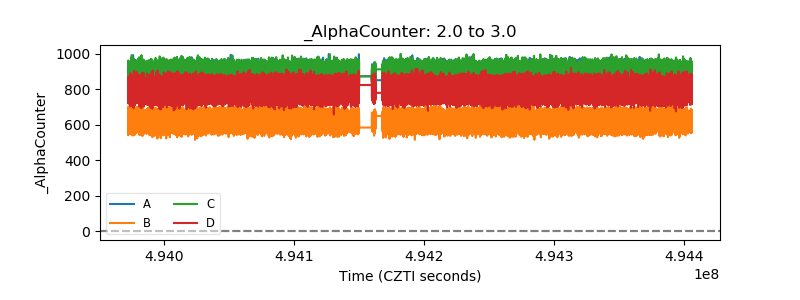 |
| _CPM_Rate | 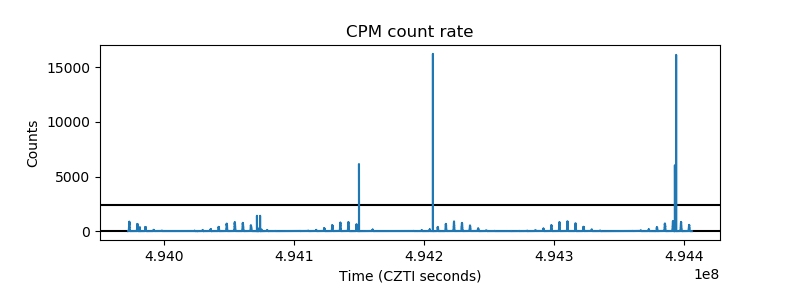 |
| CZT Counter | 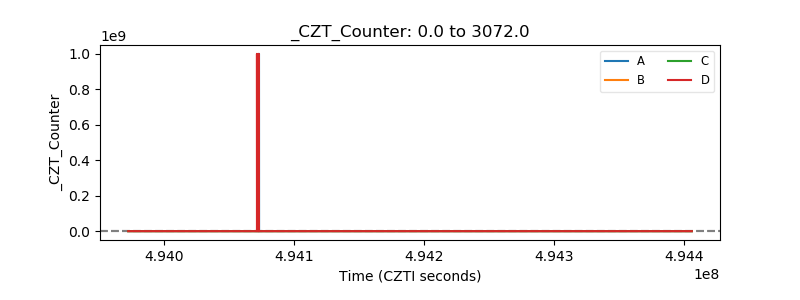 |
| +2.5 Volts monitor | 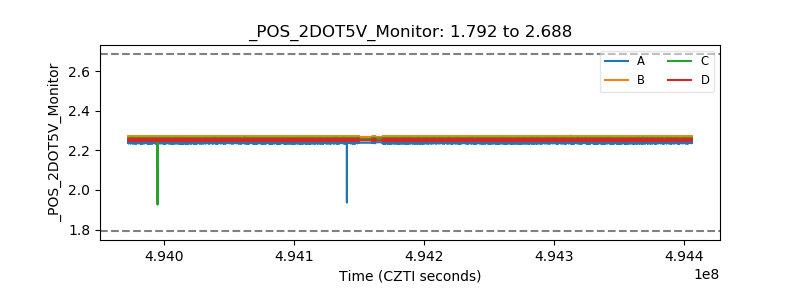 |
| +5 Volts monitor | 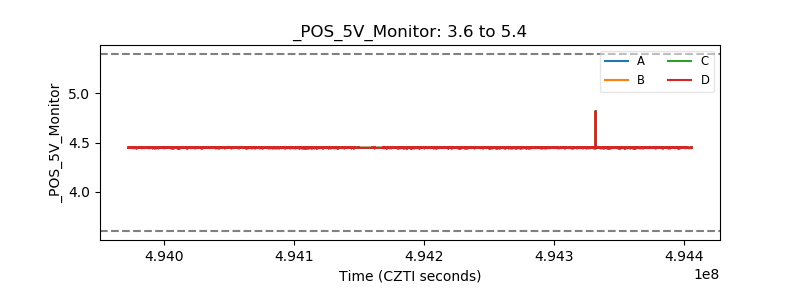 |
| _ROLL_ROT | 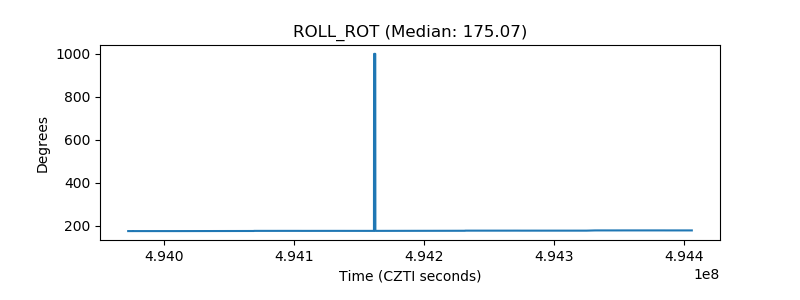 |
| _Roll_DEC | 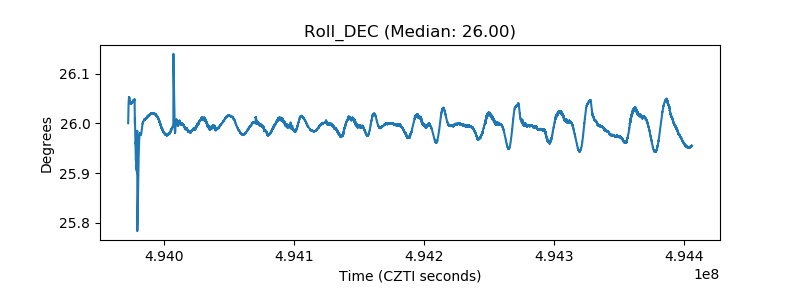 |
| _Roll_RA | 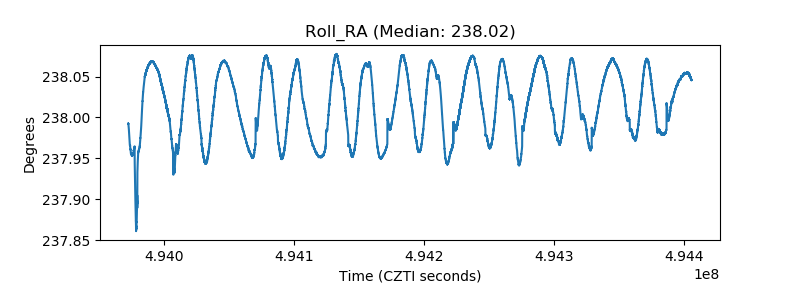 |
| Veto Counter | 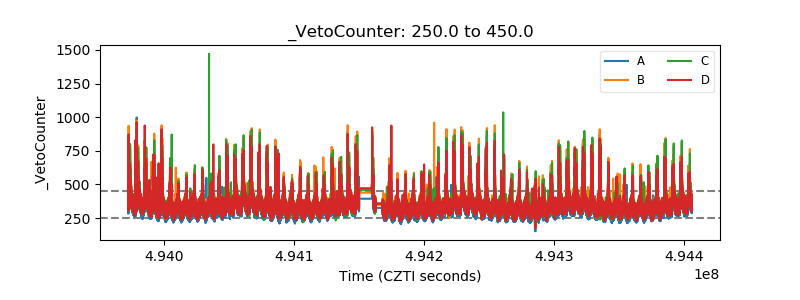 |