| Param | Original file | Final file |
|---|---|---|
| Filename | modeM0/AS1A14_022T05_9000006504_53629cztM0_level2.fits | modeM0/AS1A14_022T05_9000006504_53629cztM0_level2_quad_clean.evt |
| Size (bytes) | 275,878,080 | 19,779,840 |
| Size | 263.1 MB | 18.9 MB |
| Events in quadrant A | 2,056,791 | 138,561 |
| Events in quadrant B | 1,656,201 | 172,603 |
| Events in quadrant C | 4,123,943 | 28,761 |
| Events in quadrant D | 2,241,193 | 133,701 |
| Mode SS | |||
|---|---|---|---|
| Quadrant | BADHDUFLAG | Total packets | Discarded packets |
| A | 0 | 38 | 0 |
| B | 0 | 38 | 0 |
| C | 0 | 38 | 0 |
| D | 0 | 38 | 0 |
| Mode M9 | |||
|---|---|---|---|
| Quadrant | BADHDUFLAG | Total packets | Discarded packets |
| A | 0 | 11 | 0 |
| B | 0 | 11 | 0 |
| C | 0 | 11 | 0 |
| D | 0 | 11 | 0 |
| Mode M0 | |||
|---|---|---|---|
| Quadrant | BADHDUFLAG | Total packets | Discarded packets |
| A | 0 | 7254 | 1 |
| B | 0 | 6090 | 1 |
| C | 0 | 13375 | 1 |
| D | 0 | 7829 | 4 |
| Quadrant | Total seconds | Saturated seconds | Saturation percentage |
|---|---|---|---|
| A | 1702 | 509 | 29.905993% |
| B | 1702 | 328 | 19.271445% |
| C | 1702 | 1474 | 86.603995% |
| D | 1701 | 445 | 26.161082% |
Noise dominated data is calculated using 1-second bins in cleaned event files. If a bin has >2000 counts, and if more than 50% of those come from <1% of pixels, then it is considered to be noise-dominated and hence unusable.
| Quadrant | # 1 sec bins | Bins with >0 counts | Bins with >2000 counts | High rate bins dominated by noise | Noise dominated (total time) | Noise dominated (detector-on time) | Marked lightcurve |
|---|---|---|---|---|---|---|---|
| A | 2857 | 1703 | 379 | 379 | 13.27% | 22.25% | 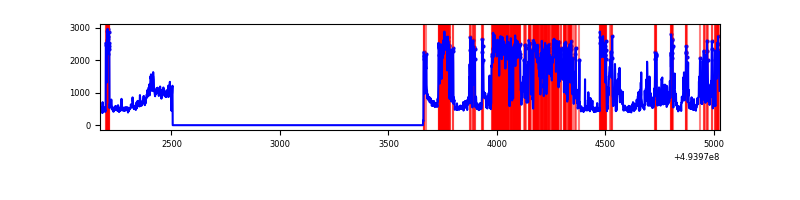 |
| B | 2857 | 1703 | 114 | 114 | 3.99% | 6.69% | 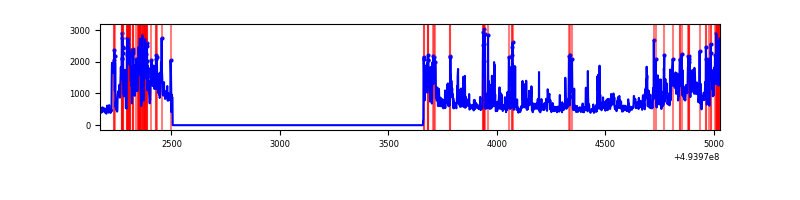 |
| C | 2857 | 1703 | 1427 | 1427 | 49.95% | 83.79% | 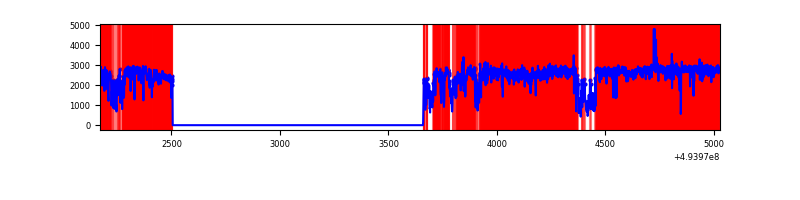 |
| D | 2856 | 1702 | 357 | 357 | 12.50% | 20.98% | 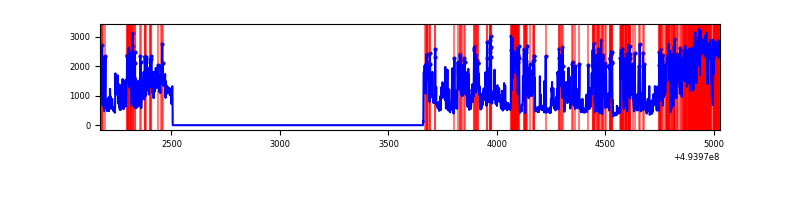 |
Top three noisy pixels from each quadrant. If the there are fewer than three noisy pixels in the level2.evt file, extra rows are filled as -1
| Pixel properties | Quadrant properties | ||||||
|---|---|---|---|---|---|---|---|
| Quadrant | DetID | PixID | Counts | Sigma | Mean | Median | Sigma |
| A | 4 | 95 | 847843 | 16395.5 | 205 | 199 | 51.7 |
| A | 3 | 78 | 285846 | 5525.11 | 205 | 199 | 51.7 |
| A | 3 | 63 | 56598 | 1090.89 | 205 | 199 | 51.7 |
| B | 15 | 20 | 309195 | 6778.76 | 205 | 198 | 45.6 |
| B | 4 | 206 | 231391 | 5071.9 | 205 | 198 | 45.6 |
| B | 4 | 170 | 147884 | 3239.93 | 205 | 198 | 45.6 |
| C | 1 | 241 | 3068209 | 107416.68 | 99 | 98 | 28.6 |
| C | 15 | 224 | 426847 | 14940.78 | 99 | 98 | 28.6 |
| C | 13 | 3 | 83440 | 2917.86 | 99 | 98 | 28.6 |
| D | 8 | 176 | 1246932 | 21791.01 | 196 | 186 | 57.2 |
| D | 2 | 153 | 62036 | 1081.03 | 196 | 186 | 57.2 |
| D | 7 | 70 | 57115 | 995.02 | 196 | 186 | 57.2 |
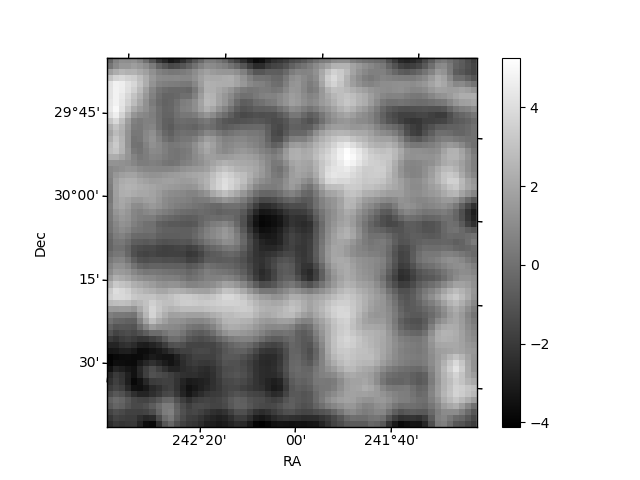
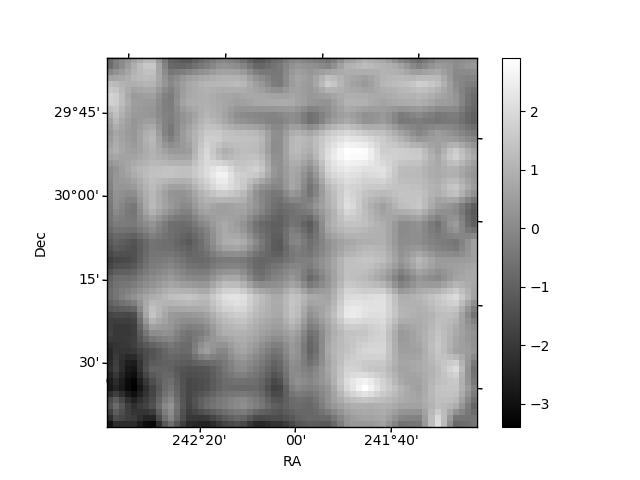
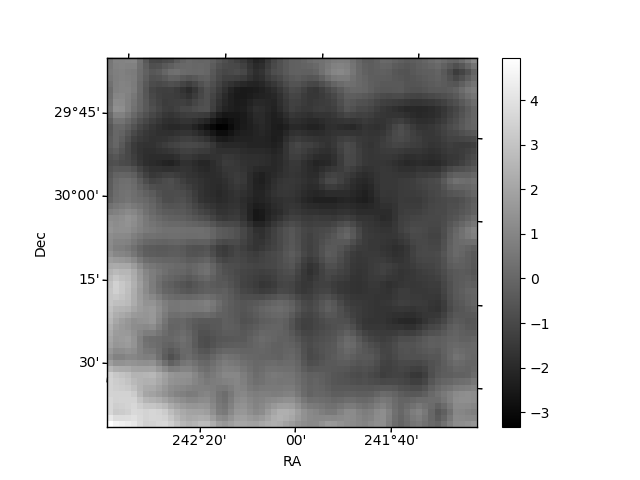
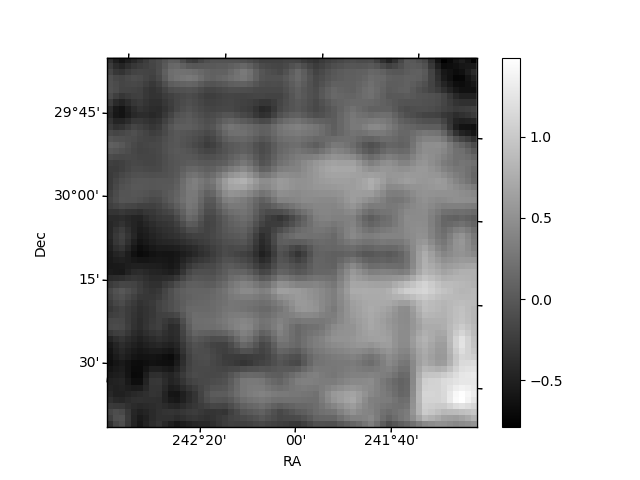
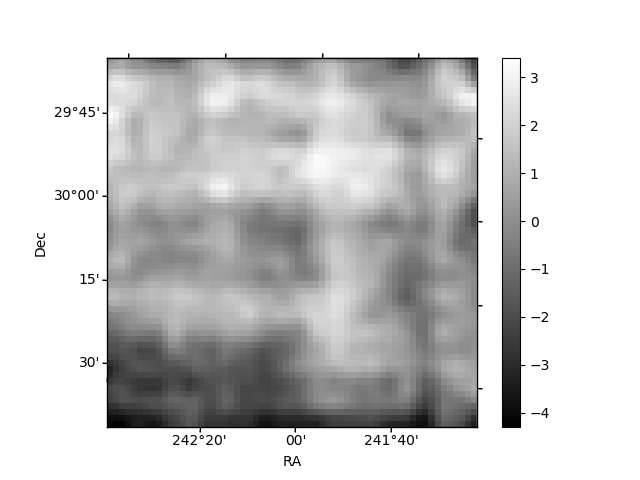
Histogram calculated using DETX and DETY for each event in the final _common_clean file
| Quadrant A | 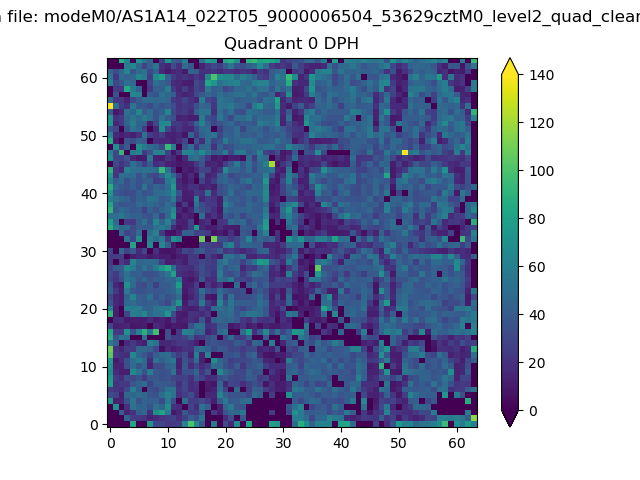 |
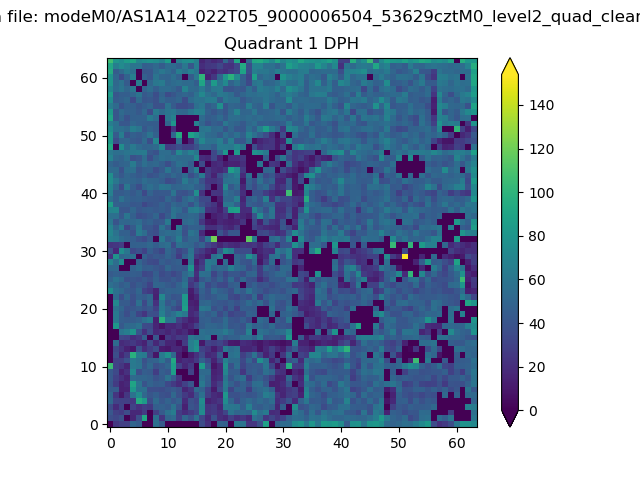 |
Quadrant B |
|---|---|---|---|
| Quadrant D | 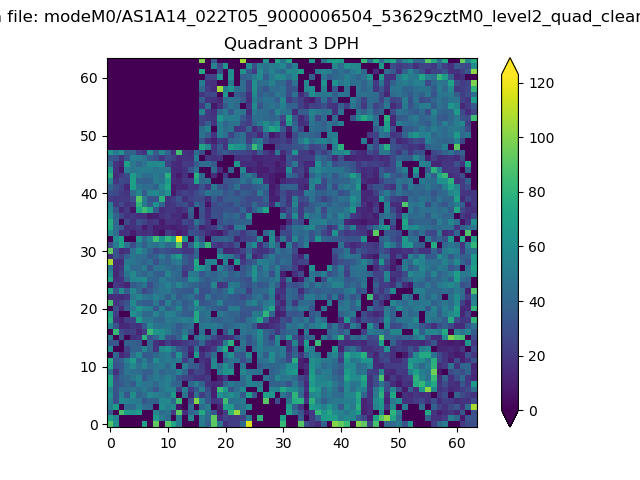 |
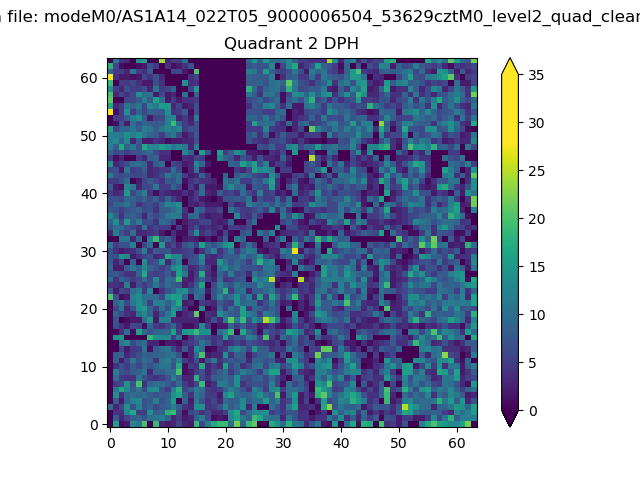 |
Quadrant C |
| Plot type | Count rate plots | Images |
|---|---|---|
| Comparison with Poisson distribution Blue bars denote a histogram of data divided into 1 sec bins. Red curve is a Poisson curve with rate = median count rate of data. |
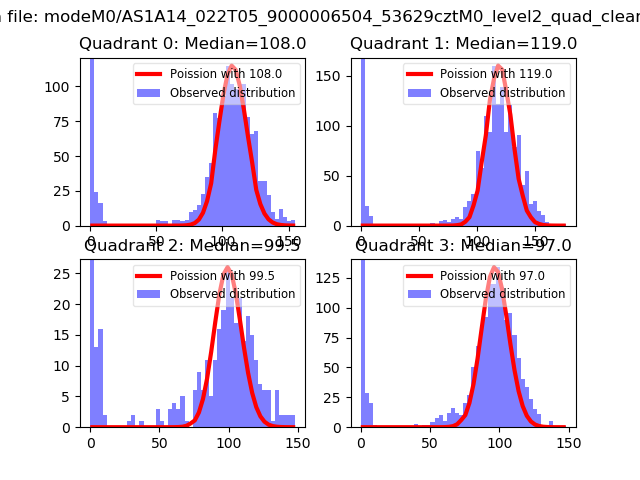 |
 |
| Quadrant-wise count rates Data is divided into 100 sec bins |
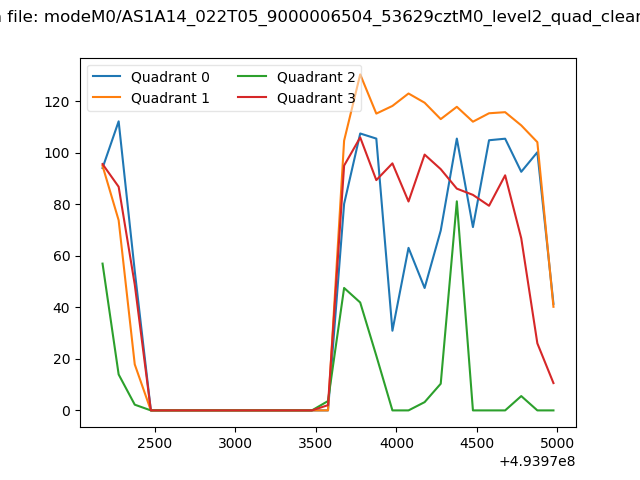 |
|
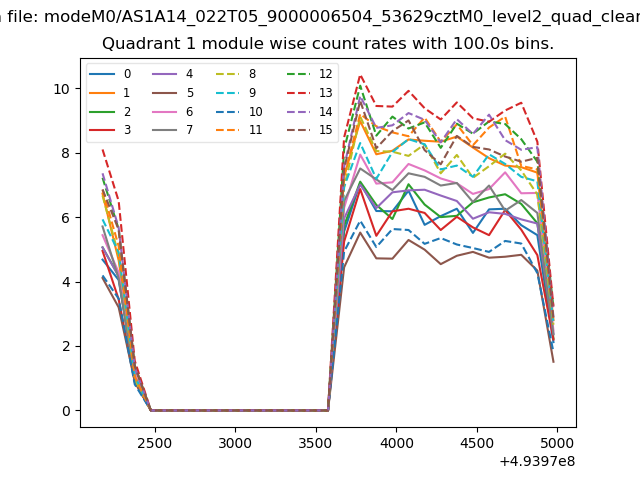
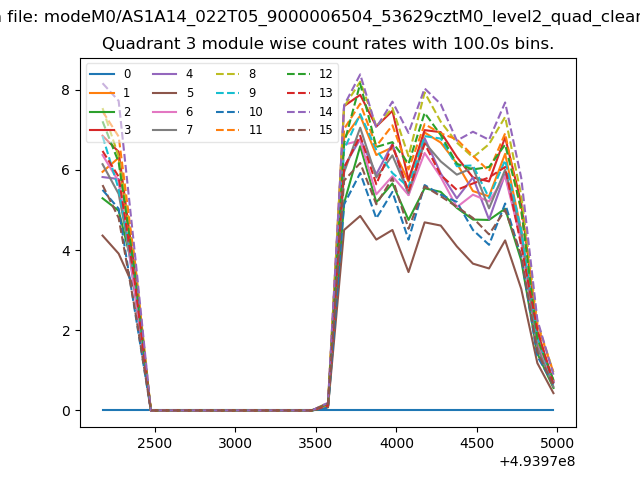
| Module-wise count rates for Quadrant A Data is divided into 100 sec bins |
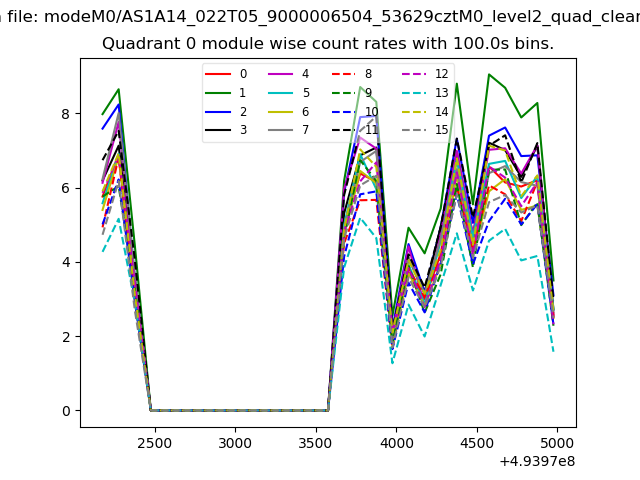 |
 |
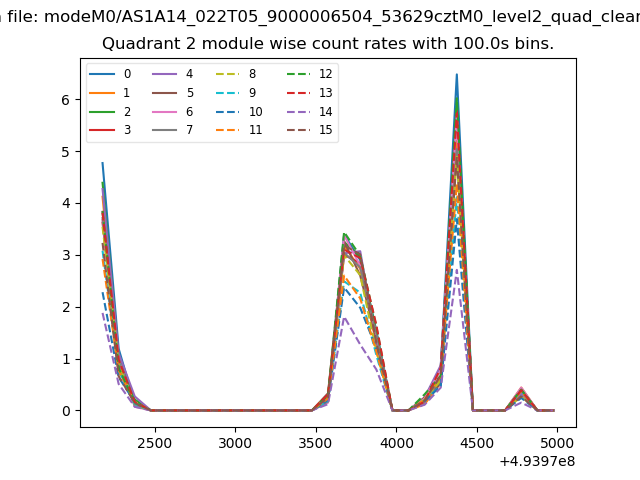
| Module-wise count rates for Quadrant B Data is divided into 100 sec bins |
 |
 |
| Module-wise count rates for Quadrant C Data is divided into 100 sec bins |
 |
 |
| Module-wise count rates for Quadrant D Data is divided into 100 sec bins |
 |
 |
| Parameter | Plot |
|---|---|
| CZT HV Monitor | 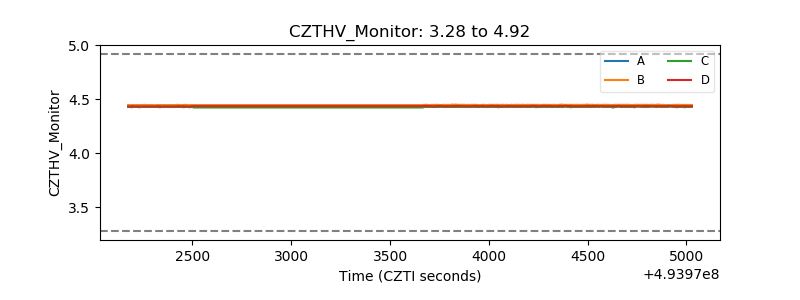 |
| D_VDD | 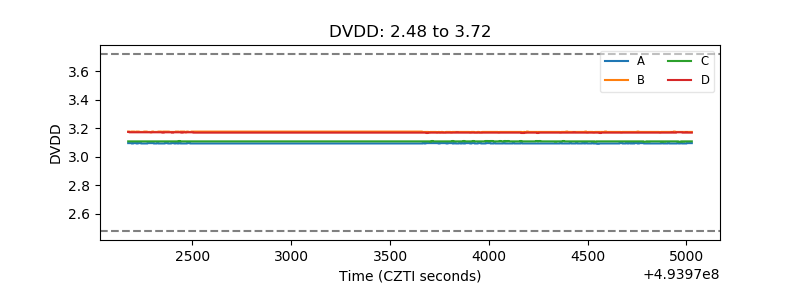 |
| Temperature 1 | 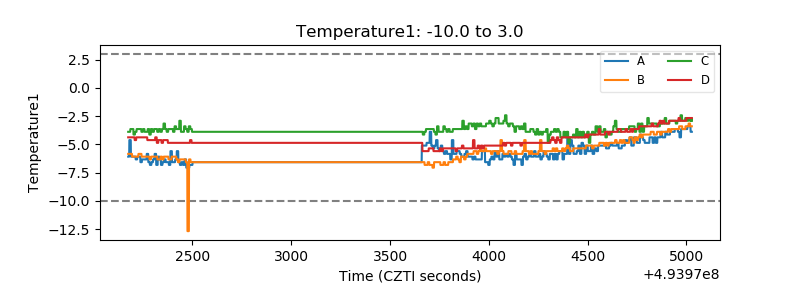 |
| Veto HV Monitor | 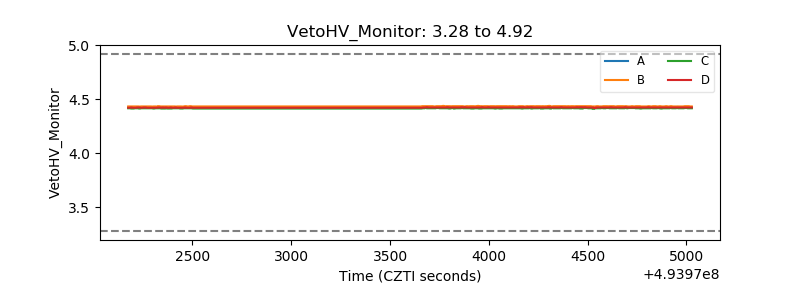 |
| Veto LLD | 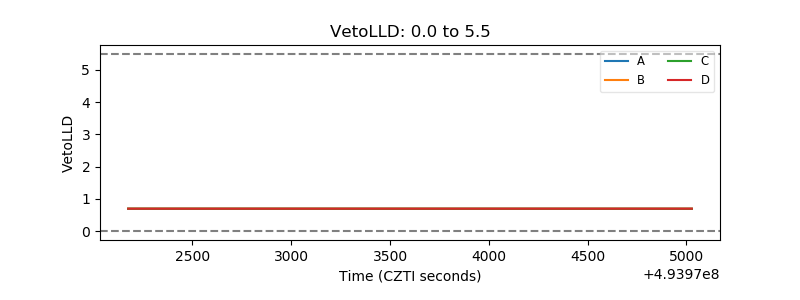 |
| Alpha Counter | 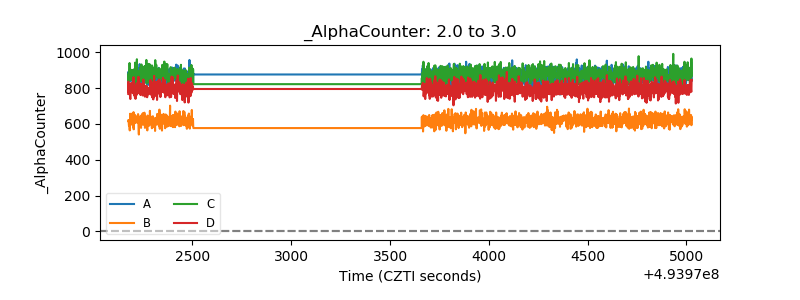 |
| _CPM_Rate | 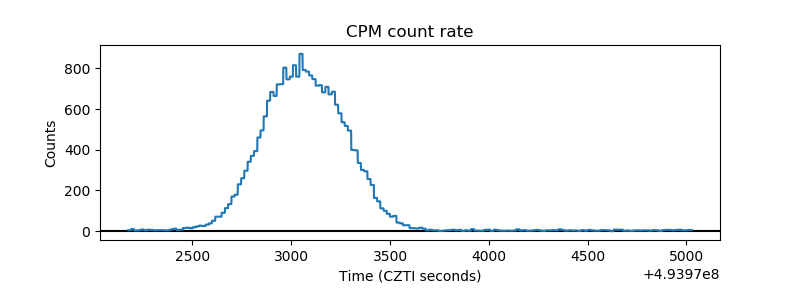 |
| CZT Counter | 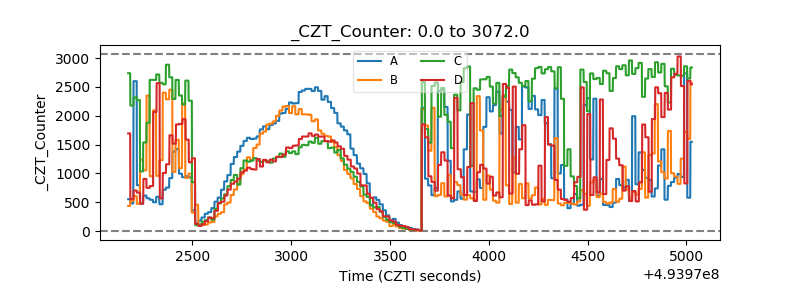 |
| +2.5 Volts monitor |  |
| +5 Volts monitor |  |
| _ROLL_ROT | 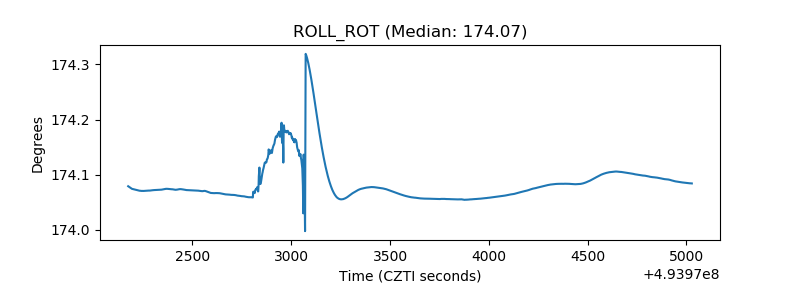 |
| _Roll_DEC | 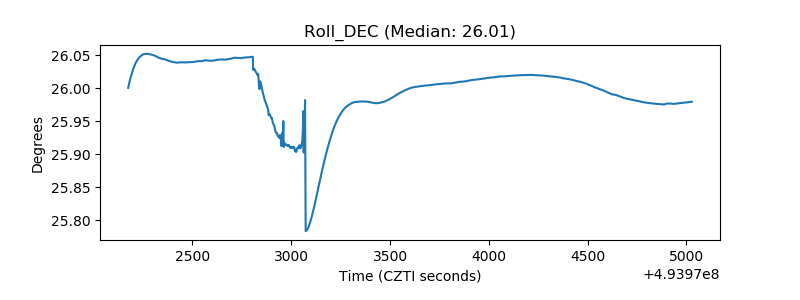 |
| _Roll_RA | 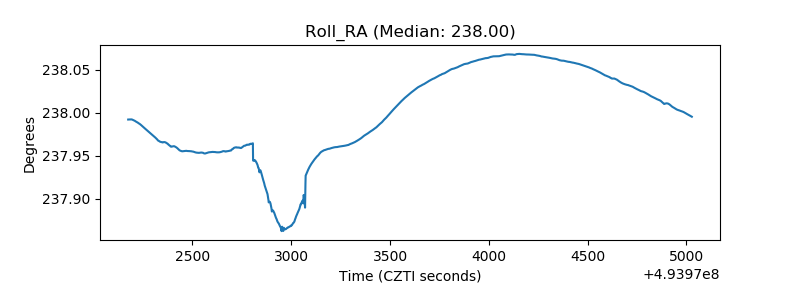 |
| Veto Counter | 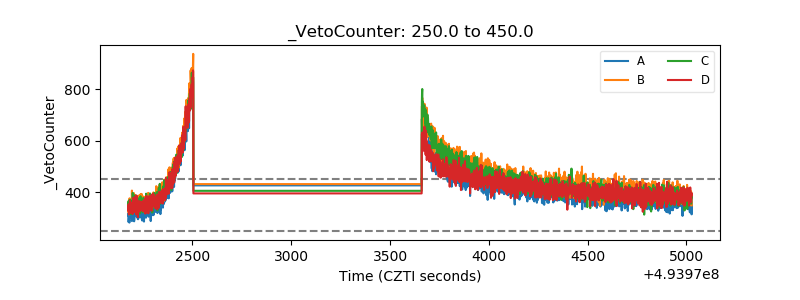 |