| Param | Original file | Final file |
|---|---|---|
| Filename | modeM0/AS1A14_022T05_9000006504_53630cztM0_level2.fits | modeM0/AS1A14_022T05_9000006504_53630cztM0_level2_quad_clean.evt |
| Size (bytes) | 970,637,760 | 75,905,280 |
| Size | 925.7 MB | 72.4 MB |
| Events in quadrant A | 8,979,872 | 457,768 |
| Events in quadrant B | 7,563,597 | 550,117 |
| Events in quadrant C | 10,620,675 | 354,169 |
| Events in quadrant D | 8,275,483 | 491,860 |
| Mode SS | |||
|---|---|---|---|
| Quadrant | BADHDUFLAG | Total packets | Discarded packets |
| A | 0 | 132 | 0 |
| B | 0 | 132 | 0 |
| C | 0 | 132 | 0 |
| D | 0 | 132 | 0 |
| Mode M9 | |||
|---|---|---|---|
| Quadrant | BADHDUFLAG | Total packets | Discarded packets |
| A | 0 | 11 | 0 |
| B | 0 | 11 | 0 |
| C | 0 | 11 | 0 |
| D | 0 | 11 | 0 |
| Mode M0 | |||
|---|---|---|---|
| Quadrant | BADHDUFLAG | Total packets | Discarded packets |
| A | 0 | 30973 | 2 |
| B | 0 | 26836 | 2 |
| C | 0 | 35785 | 2 |
| D | 0 | 28934 | 2 |
| Quadrant | Total seconds | Saturated seconds | Saturation percentage |
|---|---|---|---|
| A | 6354 | 2239 | 35.237646% |
| B | 6354 | 1768 | 27.824992% |
| C | 6355 | 2996 | 47.143981% |
| D | 6355 | 1431 | 22.517703% |
Noise dominated data is calculated using 1-second bins in cleaned event files. If a bin has >2000 counts, and if more than 50% of those come from <1% of pixels, then it is considered to be noise-dominated and hence unusable.
| Quadrant | # 1 sec bins | Bins with >0 counts | Bins with >2000 counts | High rate bins dominated by noise | Noise dominated (total time) | Noise dominated (detector-on time) | Marked lightcurve |
|---|---|---|---|---|---|---|---|
| A | 7524 | 6361 | 2132 | 2132 | 28.34% | 33.52% | 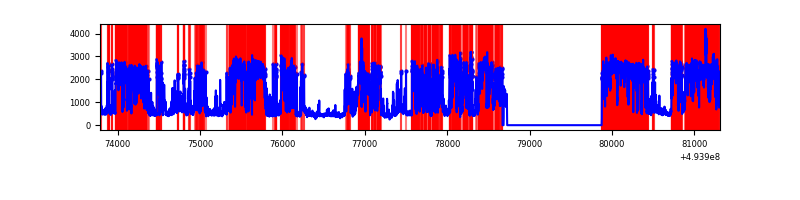 |
| B | 7524 | 6361 | 1375 | 1375 | 18.27% | 21.62% | 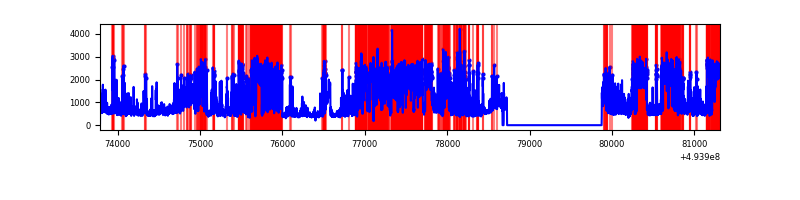 |
| C | 7525 | 6362 | 2835 | 2835 | 37.67% | 44.56% | 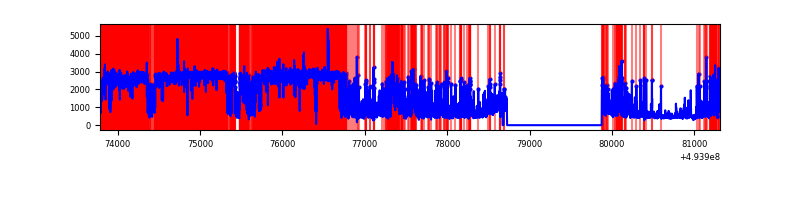 |
| D | 7525 | 6362 | 1453 | 1453 | 19.31% | 22.84% | 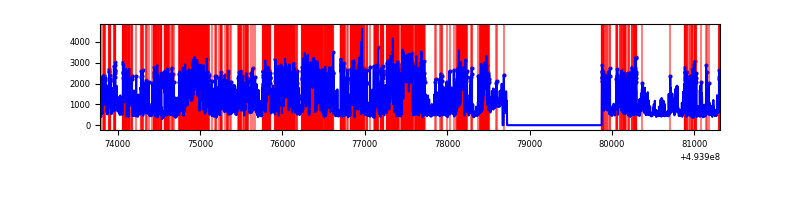 |
Top three noisy pixels from each quadrant. If the there are fewer than three noisy pixels in the level2.evt file, extra rows are filled as -1
| Pixel properties | Quadrant properties | ||||||
|---|---|---|---|---|---|---|---|
| Quadrant | DetID | PixID | Counts | Sigma | Mean | Median | Sigma |
| A | 4 | 95 | 3135133 | 19716.03 | 641 | 624 | 159.0 |
| A | 3 | 78 | 1985410 | 12484.28 | 641 | 624 | 159.0 |
| A | 10 | 253 | 746803 | 4693.46 | 641 | 624 | 159.0 |
| B | 15 | 20 | 3581696 | 25357.56 | 655 | 632 | 141.2 |
| B | 4 | 206 | 649418 | 4594.06 | 655 | 632 | 141.2 |
| B | 10 | 254 | 176550 | 1245.68 | 655 | 632 | 141.2 |
| C | 1 | 241 | 5912274 | 41736.65 | 511 | 506 | 141.6 |
| C | 15 | 224 | 2111803 | 14905.6 | 511 | 506 | 141.6 |
| C | 13 | 3 | 179170 | 1261.35 | 511 | 506 | 141.6 |
| D | 8 | 176 | 4566086 | 24024.98 | 657 | 624 | 190.0 |
| D | 2 | 153 | 229771 | 1205.85 | 657 | 624 | 190.0 |
| D | 2 | 120 | 180143 | 944.69 | 657 | 624 | 190.0 |
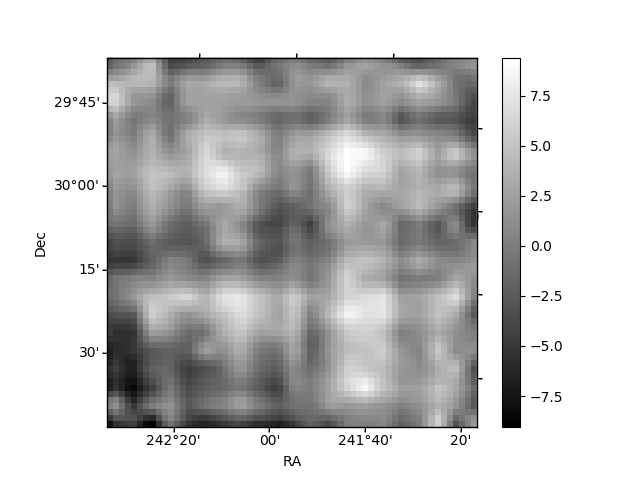
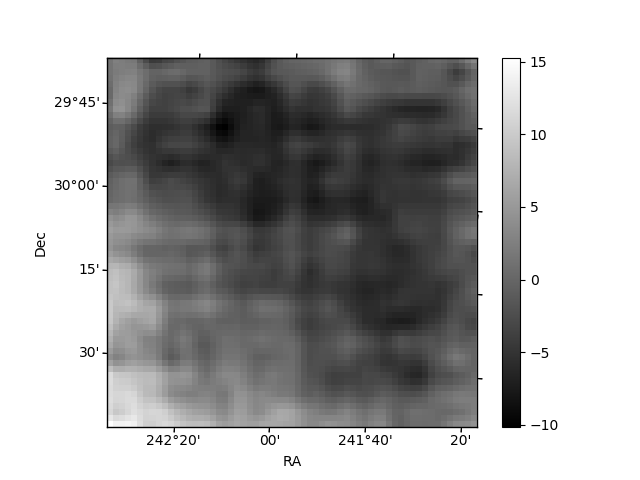
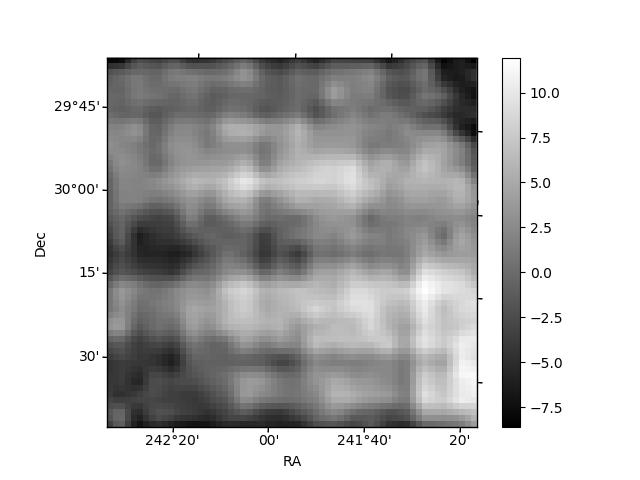
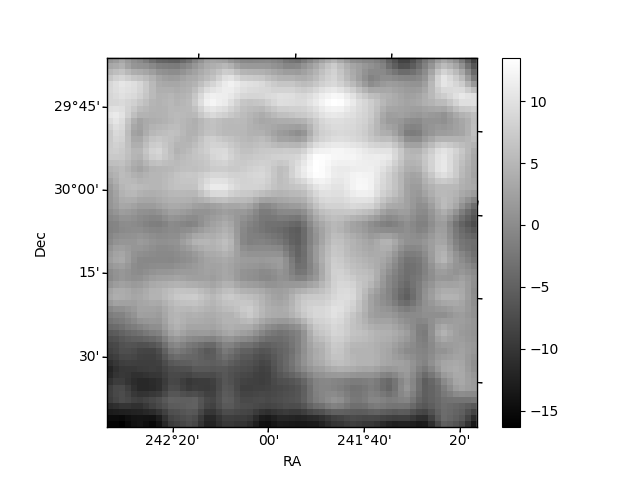
Histogram calculated using DETX and DETY for each event in the final _common_clean file
| Quadrant A | 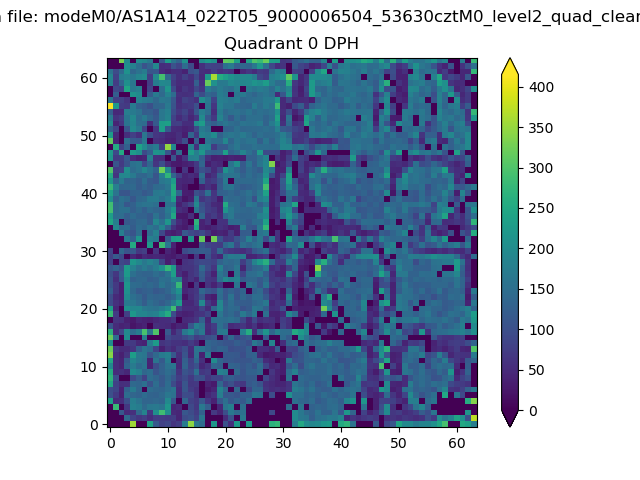 |
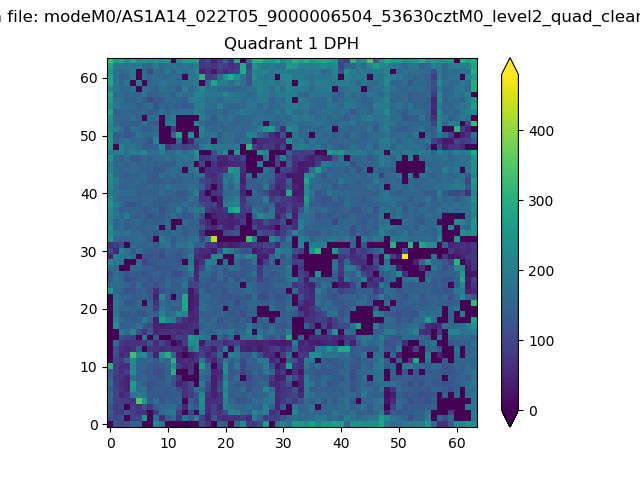 |
Quadrant B |
|---|---|---|---|
| Quadrant D | 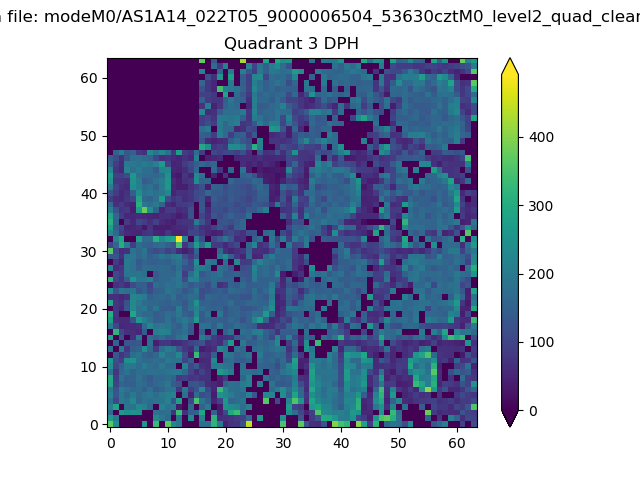 |
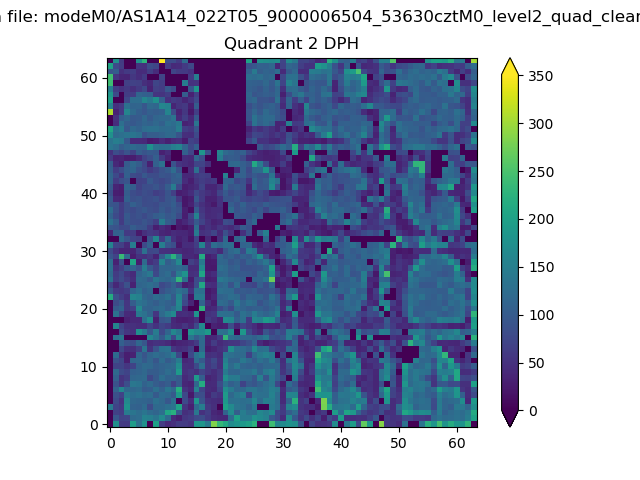 |
Quadrant C |
| Plot type | Count rate plots | Images |
|---|---|---|
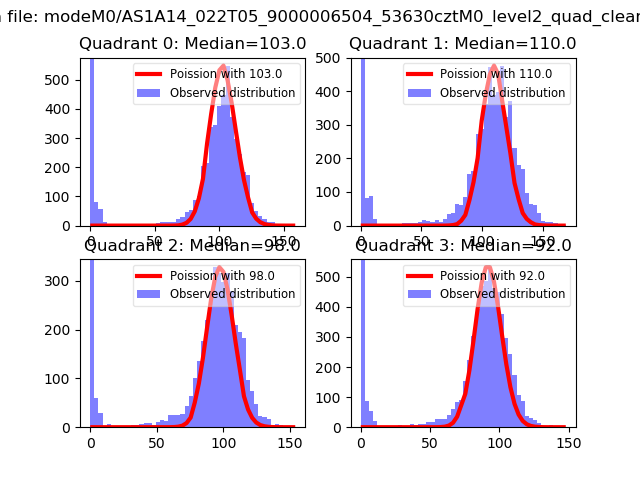
| Comparison with Poisson distribution Blue bars denote a histogram of data divided into 1 sec bins. Red curve is a Poisson curve with rate = median count rate of data. |
 |
 |
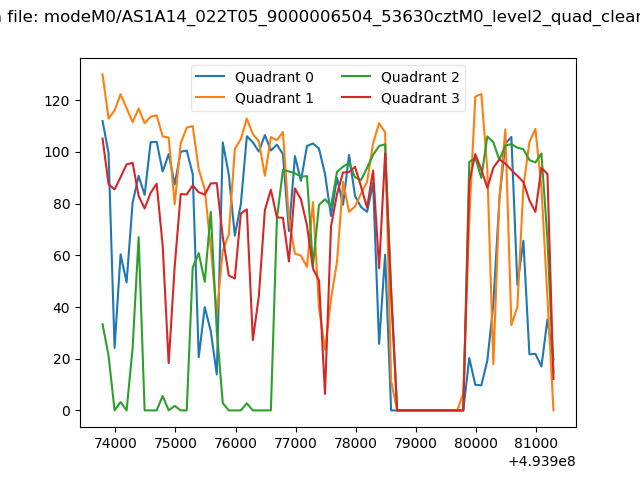
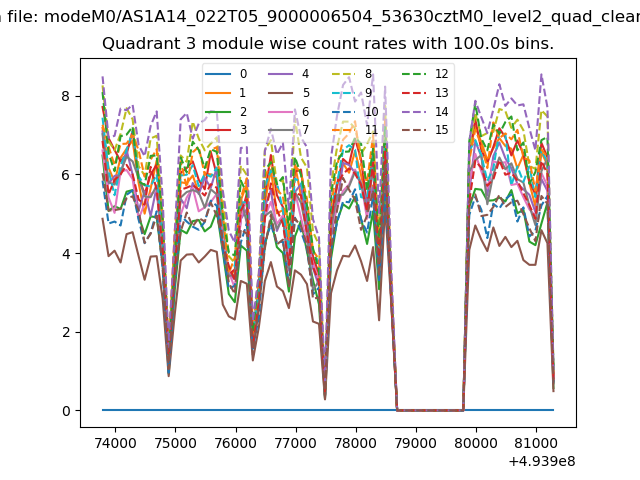
| Quadrant-wise count rates Data is divided into 100 sec bins |
 |
|
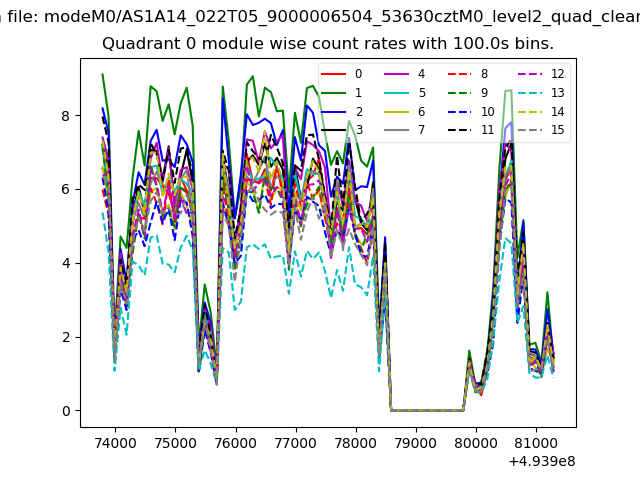
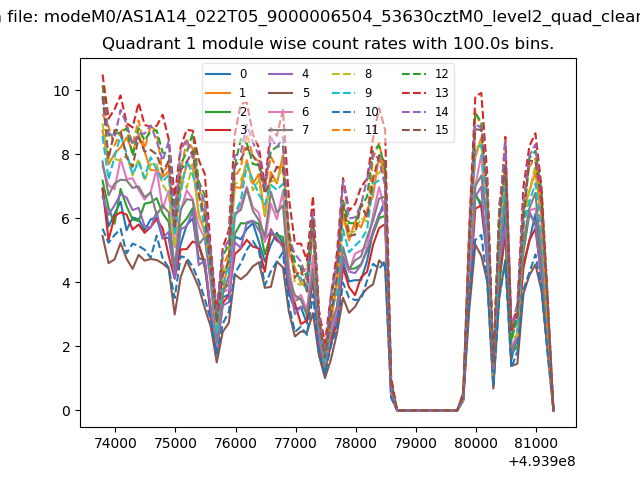
| Module-wise count rates for Quadrant A Data is divided into 100 sec bins |
 |
 |
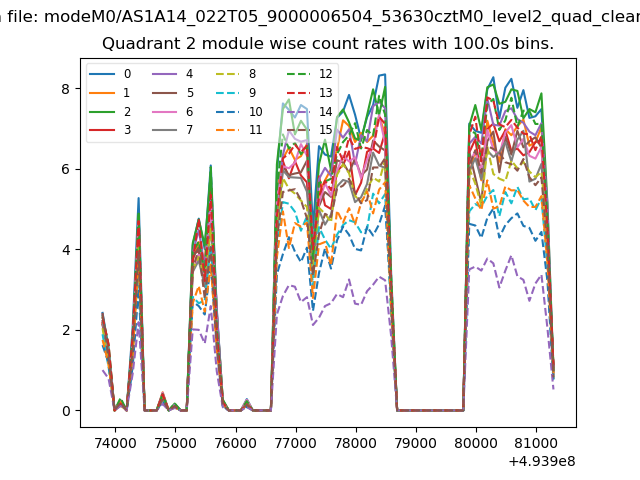
| Module-wise count rates for Quadrant B Data is divided into 100 sec bins |
 |
 |
| Module-wise count rates for Quadrant C Data is divided into 100 sec bins |
 |
 |
| Module-wise count rates for Quadrant D Data is divided into 100 sec bins |
 |
 |
| Parameter | Plot |
|---|---|
| CZT HV Monitor |  |
| D_VDD | 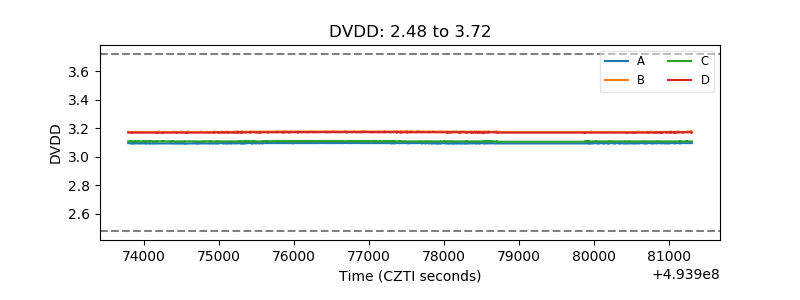 |
| Temperature 1 | 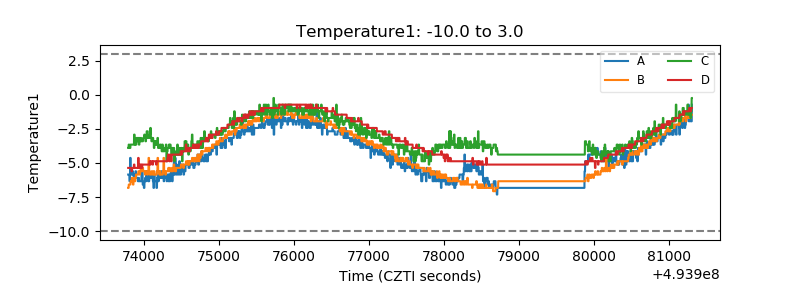 |
| Veto HV Monitor | 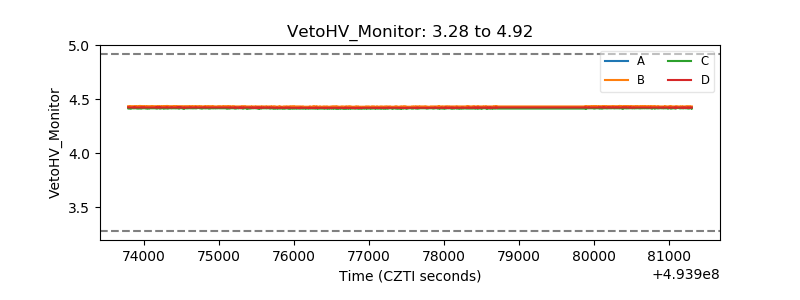 |
| Veto LLD | 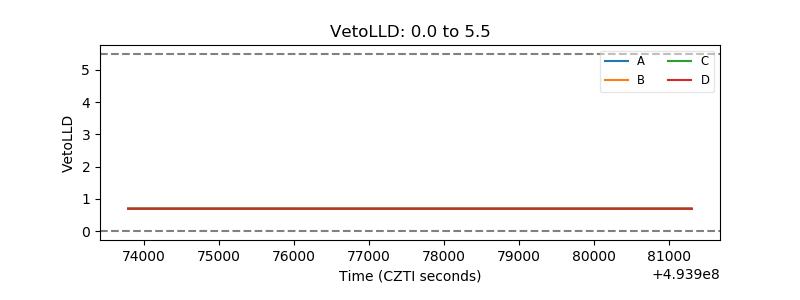 |
| Alpha Counter | 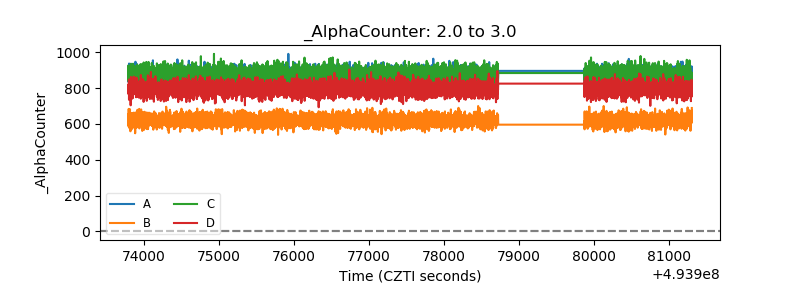 |
| _CPM_Rate | 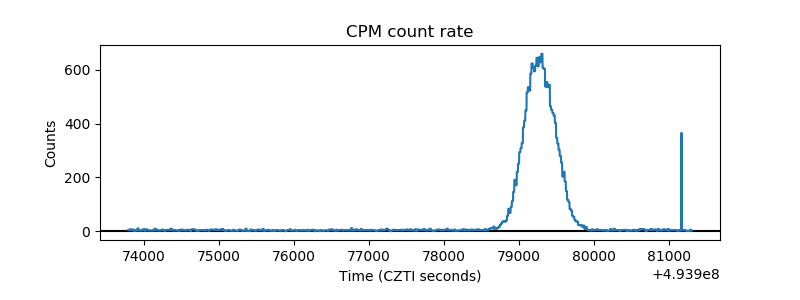 |
| CZT Counter | 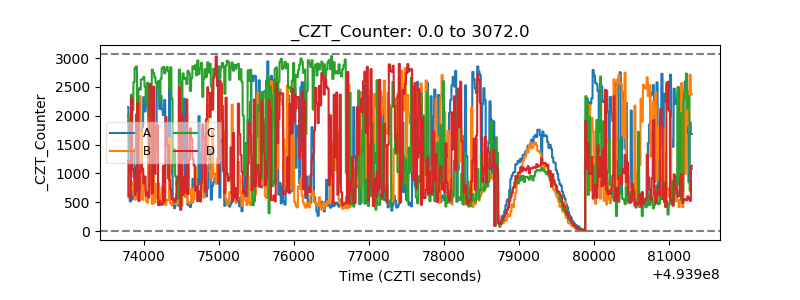 |
| +2.5 Volts monitor |  |
| +5 Volts monitor |  |
| _ROLL_ROT | 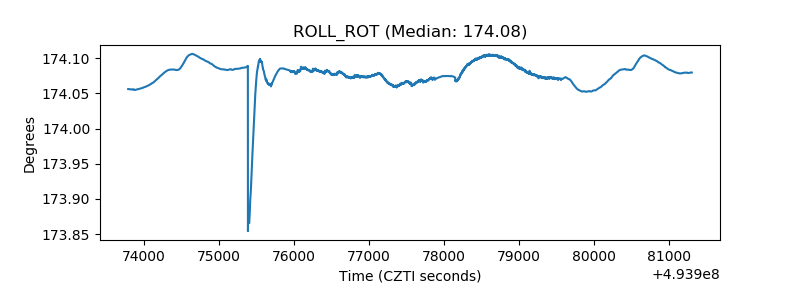 |
| _Roll_DEC | 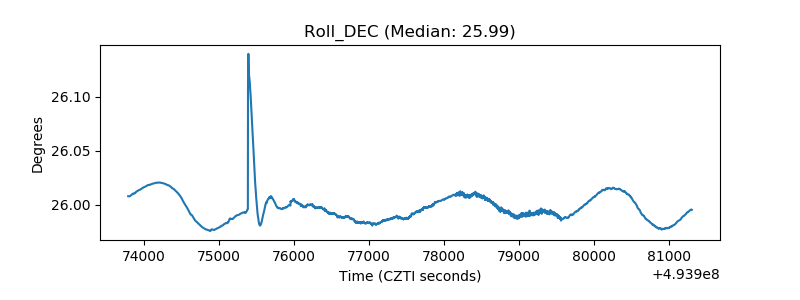 |
| _Roll_RA | 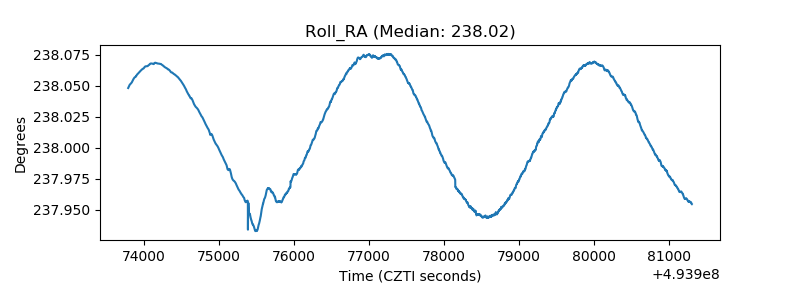 |
| Veto Counter | 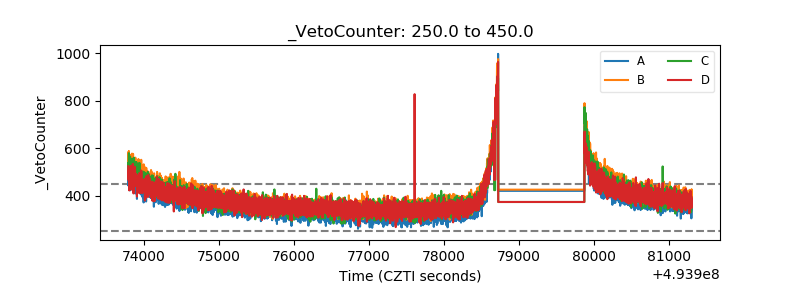 |