| Param | Original file | Final file |
|---|---|---|
| Filename | modeM0/AS1A14_022T05_9000006504_53631cztM0_level2.fits | modeM0/AS1A14_022T05_9000006504_53631cztM0_level2_quad_clean.evt |
| Size (bytes) | 837,123,840 | 82,900,800 |
| Size | 798.3 MB | 79.1 MB |
| Events in quadrant A | 8,327,853 | 475,970 |
| Events in quadrant B | 6,914,245 | 591,012 |
| Events in quadrant C | 9,546,037 | 417,630 |
| Events in quadrant D | 5,697,421 | 572,923 |
| Mode SS | |||
|---|---|---|---|
| Quadrant | BADHDUFLAG | Total packets | Discarded packets |
| A | 0 | 132 | 0 |
| B | 0 | 132 | 0 |
| C | 0 | 132 | 0 |
| D | 0 | 132 | 0 |
| Mode M9 | |||
|---|---|---|---|
| Quadrant | BADHDUFLAG | Total packets | Discarded packets |
| A | 0 | 13 | 0 |
| B | 0 | 14 | 0 |
| C | 0 | 14 | 0 |
| D | 0 | 14 | 0 |
| Mode M0 | |||
|---|---|---|---|
| Quadrant | BADHDUFLAG | Total packets | Discarded packets |
| A | 0 | 29178 | 2 |
| B | 0 | 25004 | 2 |
| C | 0 | 32647 | 3 |
| D | 0 | 21341 | 2 |
| Quadrant | Total seconds | Saturated seconds | Saturation percentage |
|---|---|---|---|
| A | 6486 | 2126 | 32.778292% |
| B | 6486 | 1366 | 21.060746% |
| C | 6485 | 2488 | 38.365459% |
| D | 6485 | 537 | 8.280648% |
Noise dominated data is calculated using 1-second bins in cleaned event files. If a bin has >2000 counts, and if more than 50% of those come from <1% of pixels, then it is considered to be noise-dominated and hence unusable.
| Quadrant | # 1 sec bins | Bins with >0 counts | Bins with >2000 counts | High rate bins dominated by noise | Noise dominated (total time) | Noise dominated (detector-on time) | Marked lightcurve |
|---|---|---|---|---|---|---|---|
| A | 7606 | 6492 | 1805 | 1805 | 23.73% | 27.80% | 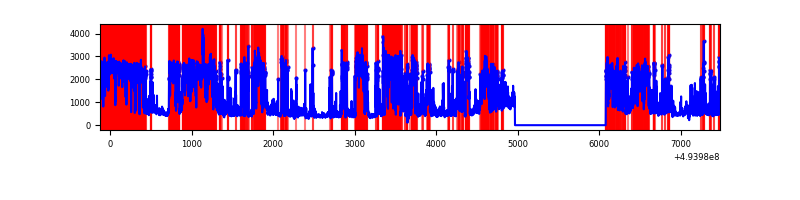 |
| B | 7606 | 6492 | 990 | 990 | 13.02% | 15.25% | 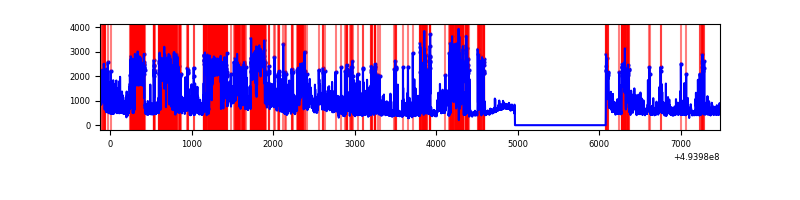 |
| C | 7605 | 6491 | 2264 | 2264 | 29.77% | 34.88% | 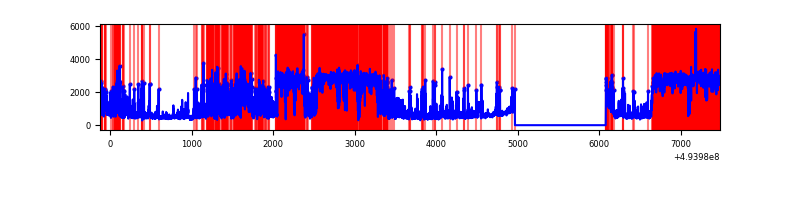 |
| D | 7605 | 6491 | 441 | 441 | 5.80% | 6.79% | 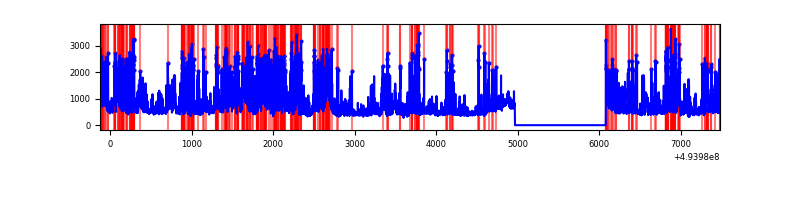 |
Top three noisy pixels from each quadrant. If the there are fewer than three noisy pixels in the level2.evt file, extra rows are filled as -1
| Pixel properties | Quadrant properties | ||||||
|---|---|---|---|---|---|---|---|
| Quadrant | DetID | PixID | Counts | Sigma | Mean | Median | Sigma |
| A | 3 | 78 | 2185313 | 13472.35 | 653 | 638 | 162.2 |
| A | 4 | 95 | 2116087 | 13045.45 | 653 | 638 | 162.2 |
| A | 15 | 174 | 941288 | 5800.76 | 653 | 638 | 162.2 |
| B | 15 | 20 | 2115626 | 14651.34 | 675 | 654 | 144.4 |
| B | 4 | 206 | 1164307 | 8061.14 | 675 | 654 | 144.4 |
| B | 7 | 0 | 291206 | 2012.78 | 675 | 654 | 144.4 |
| C | 1 | 241 | 4766772 | 30551.84 | 559 | 556 | 156.0 |
| C | 15 | 224 | 1936681 | 12410.72 | 559 | 556 | 156.0 |
| C | 13 | 3 | 188631 | 1205.58 | 559 | 556 | 156.0 |
| D | 8 | 176 | 1486196 | 7359.65 | 713 | 683 | 201.8 |
| D | 2 | 153 | 236040 | 1166.03 | 713 | 683 | 201.8 |
| D | 3 | 12 | 230246 | 1137.32 | 713 | 683 | 201.8 |
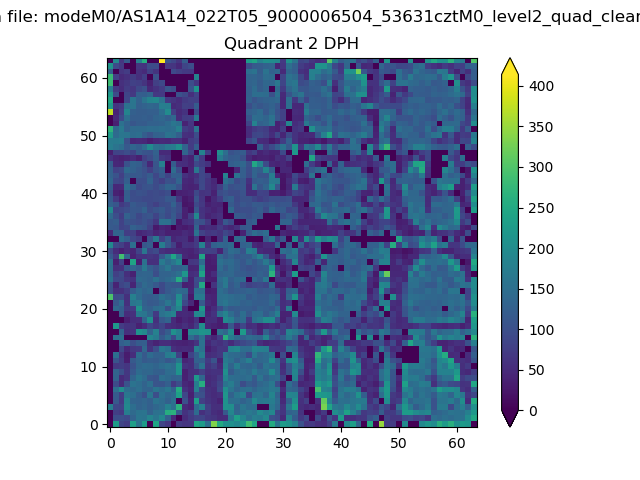
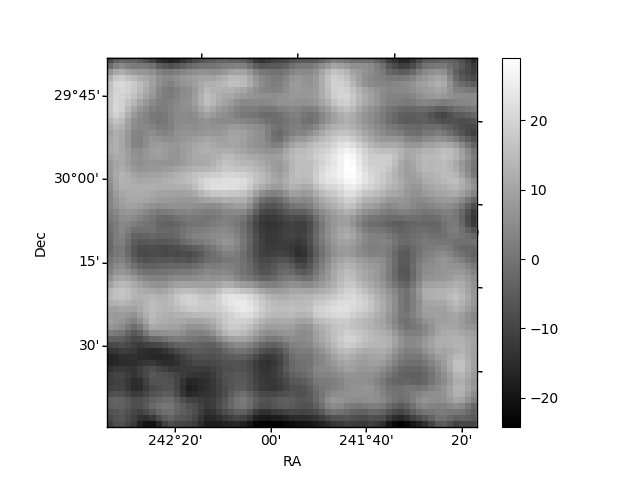
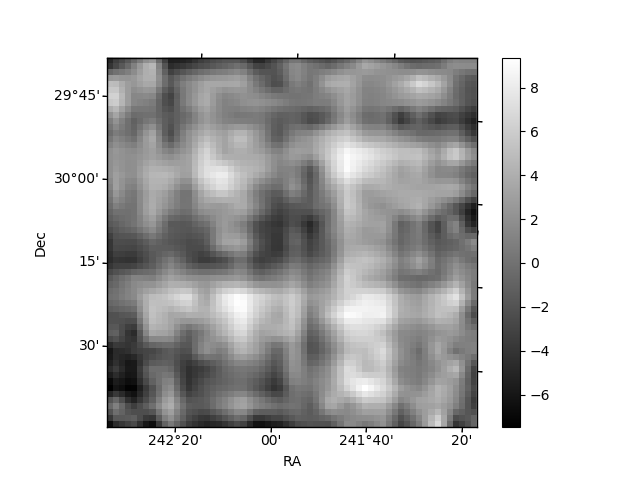
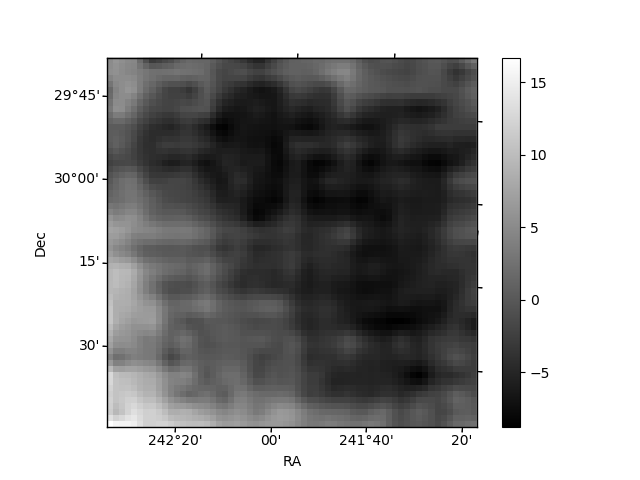
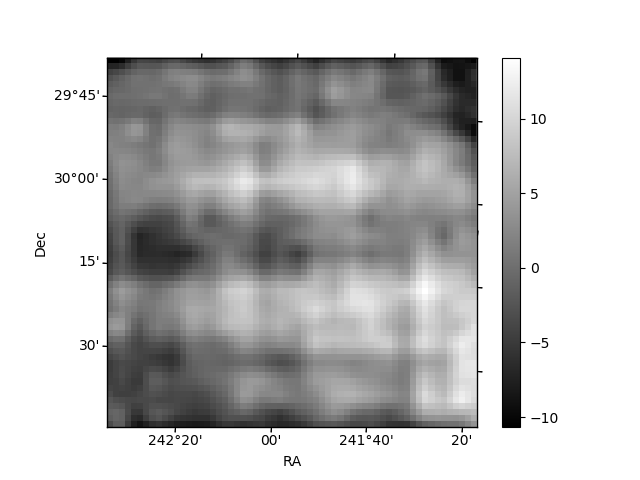
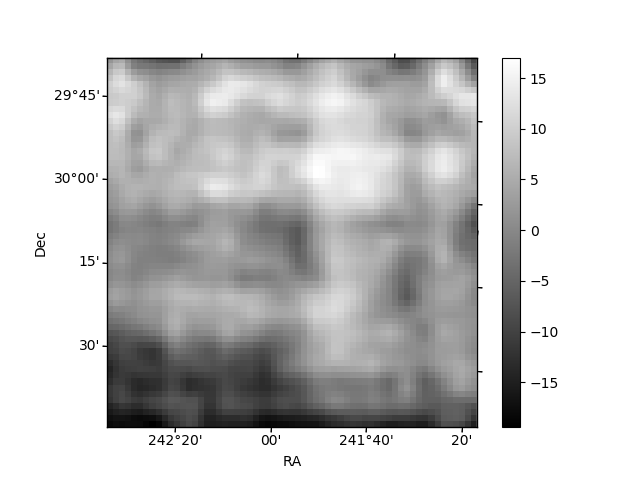
Histogram calculated using DETX and DETY for each event in the final _common_clean file
| Quadrant A | 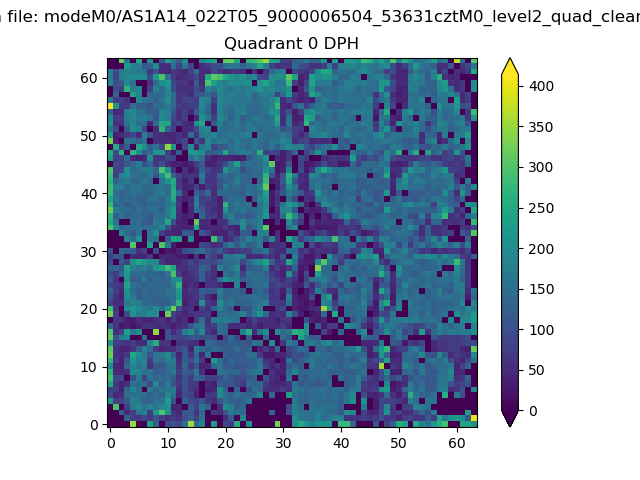 |
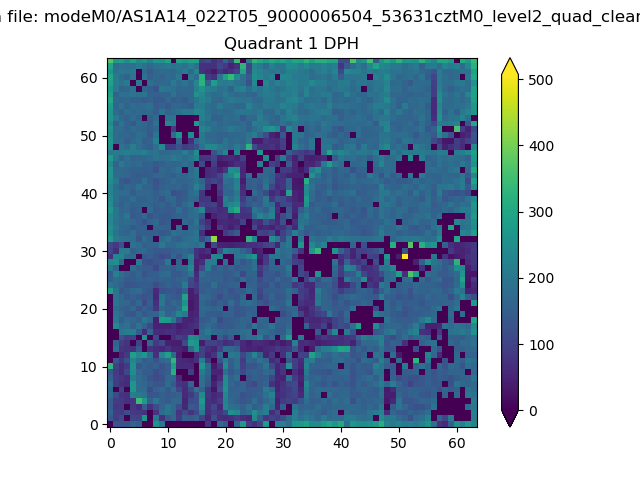 |
Quadrant B |
|---|---|---|---|
| Quadrant D | 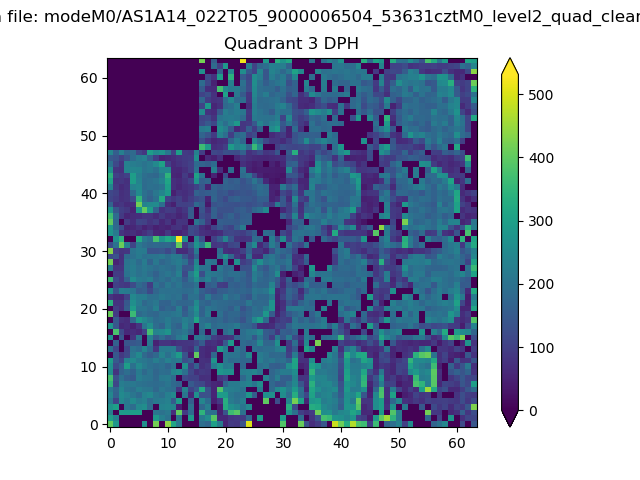 |
 |
Quadrant C |
| Plot type | Count rate plots | Images |
|---|---|---|
| Comparison with Poisson distribution Blue bars denote a histogram of data divided into 1 sec bins. Red curve is a Poisson curve with rate = median count rate of data. |
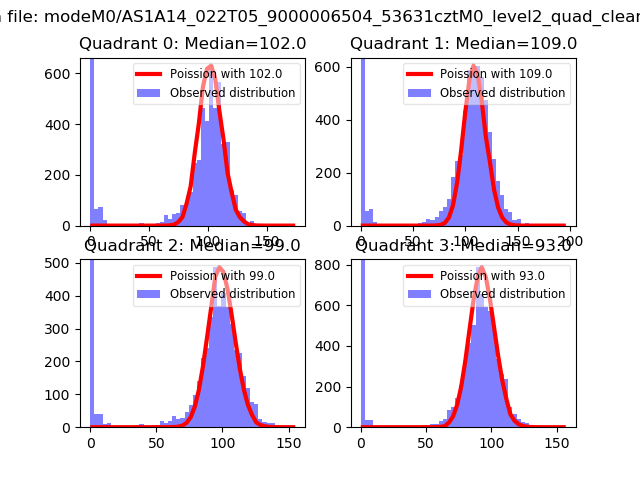 |
 |
| Quadrant-wise count rates Data is divided into 100 sec bins |
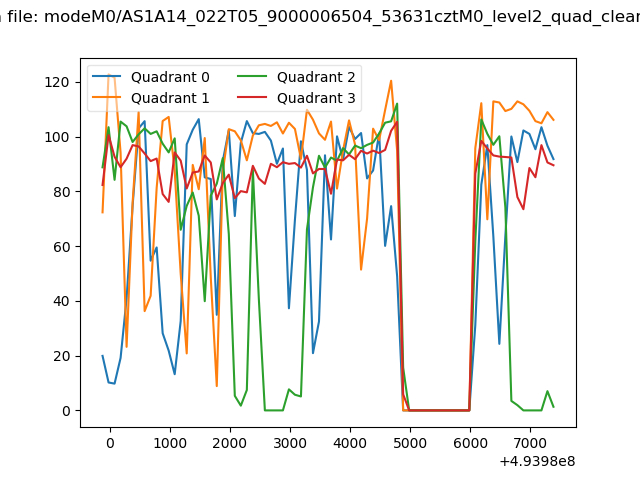 |
|
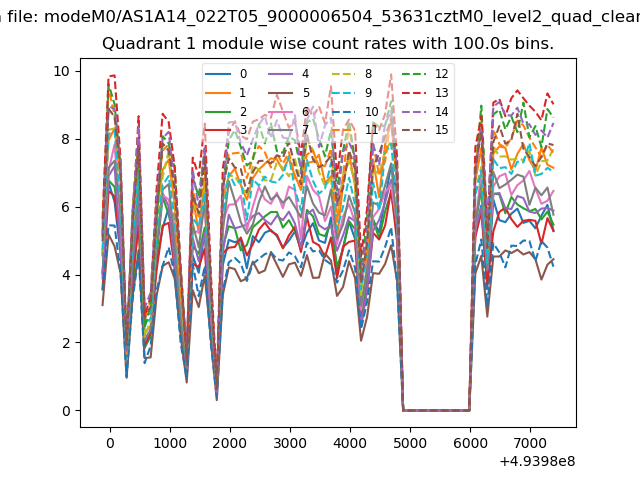
| Module-wise count rates for Quadrant A Data is divided into 100 sec bins |
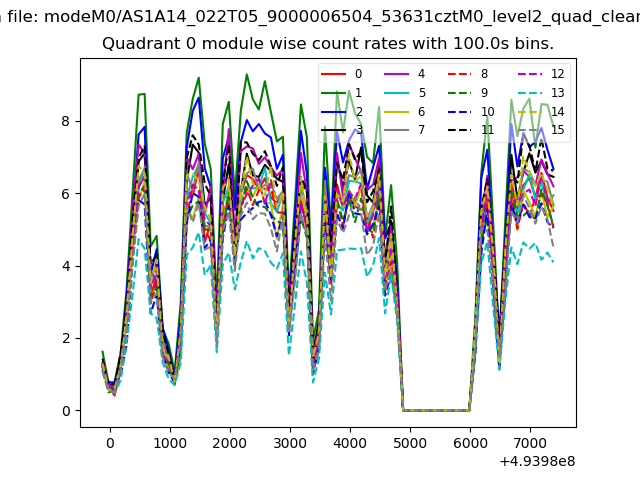 |
 |
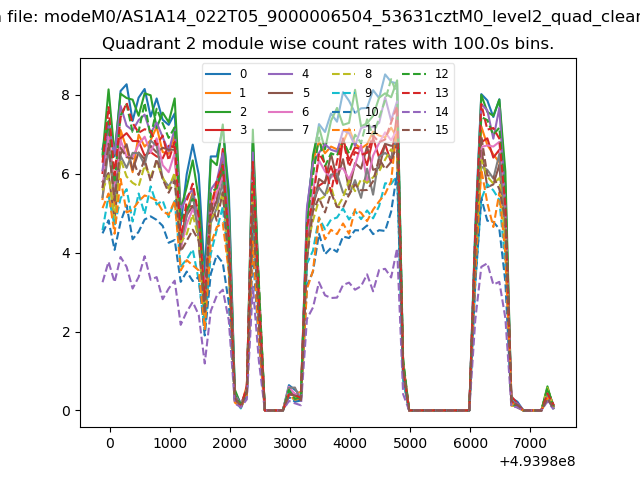
| Module-wise count rates for Quadrant B Data is divided into 100 sec bins |
 |
 |
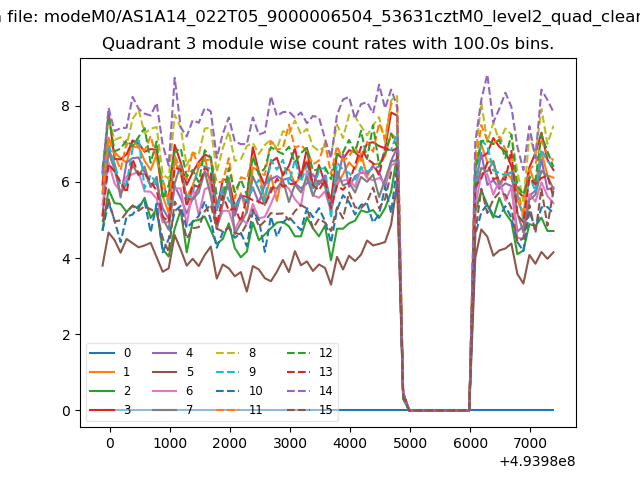
| Module-wise count rates for Quadrant C Data is divided into 100 sec bins |
 |
 |
| Module-wise count rates for Quadrant D Data is divided into 100 sec bins |
 |
 |
| Parameter | Plot |
|---|---|
| CZT HV Monitor |  |
| D_VDD | 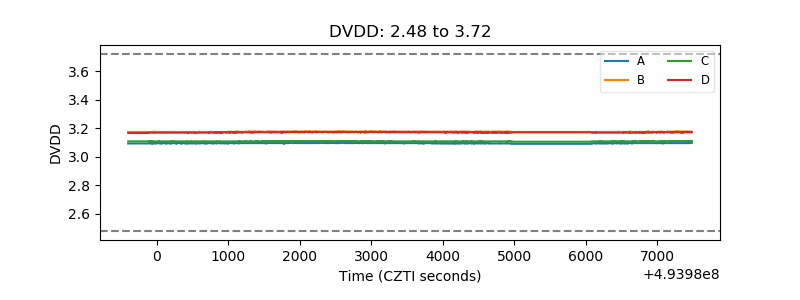 |
| Temperature 1 | 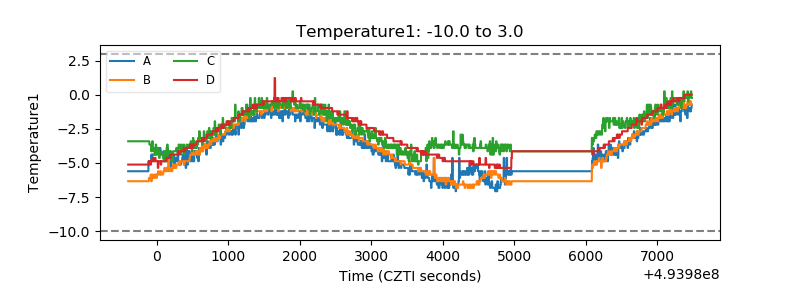 |
| Veto HV Monitor | 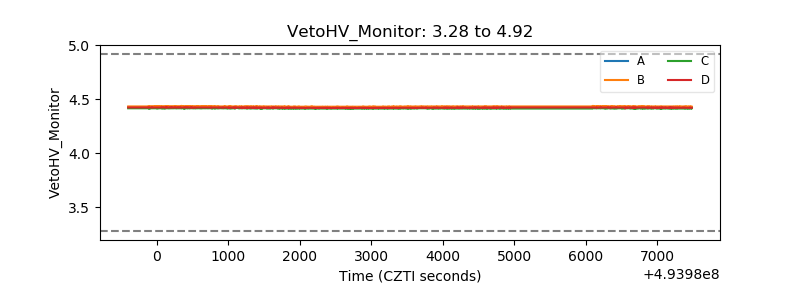 |
| Veto LLD | 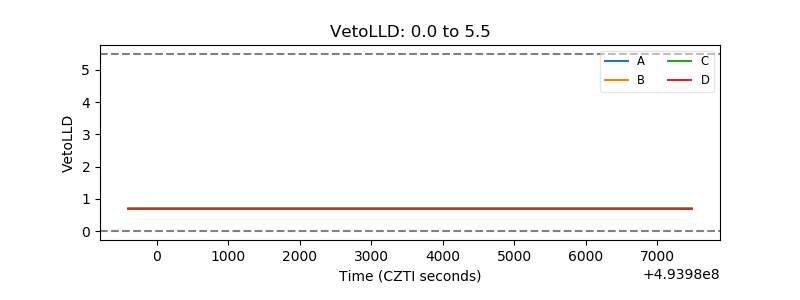 |
| Alpha Counter | 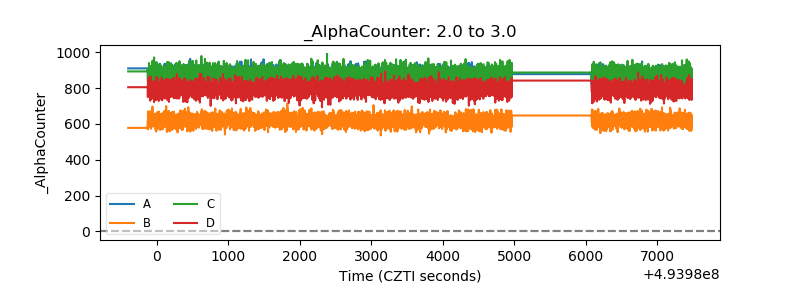 |
| _CPM_Rate | 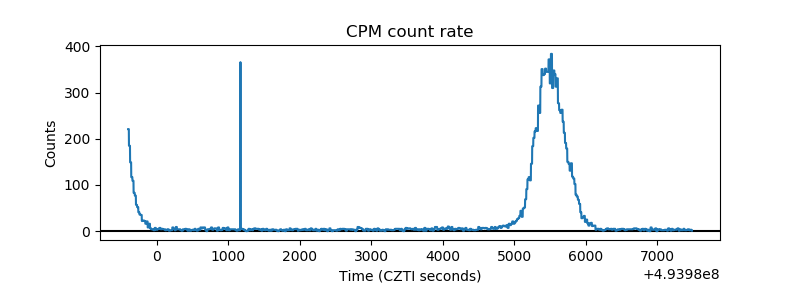 |
| CZT Counter | 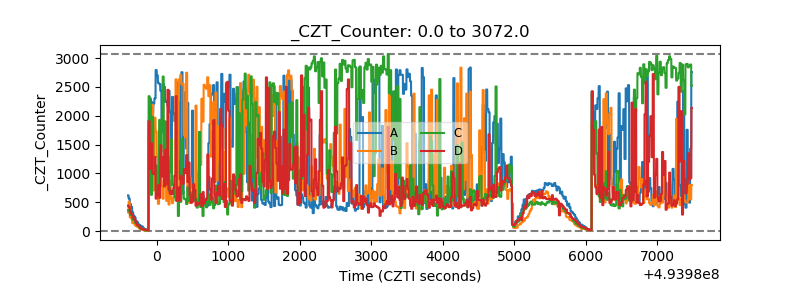 |
| +2.5 Volts monitor | 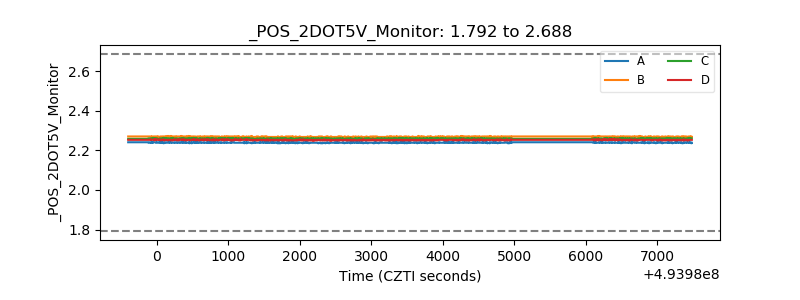 |
| +5 Volts monitor | 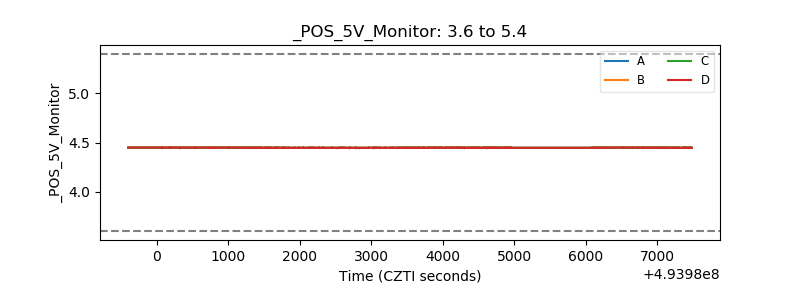 |
| _ROLL_ROT | 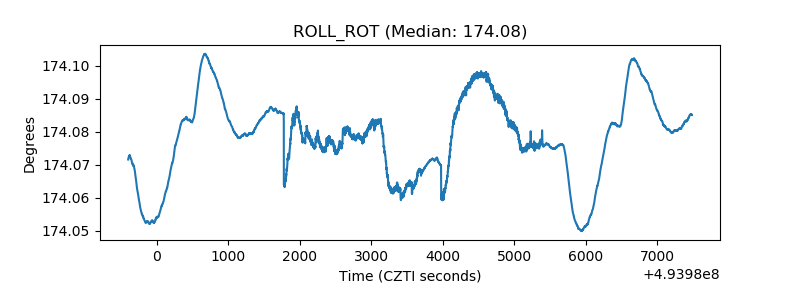 |
| _Roll_DEC | 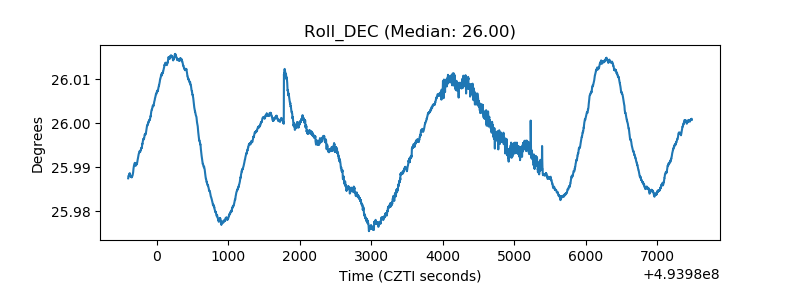 |
| _Roll_RA | 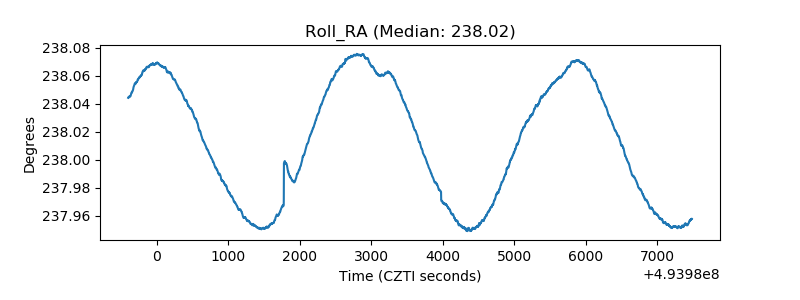 |
| Veto Counter | 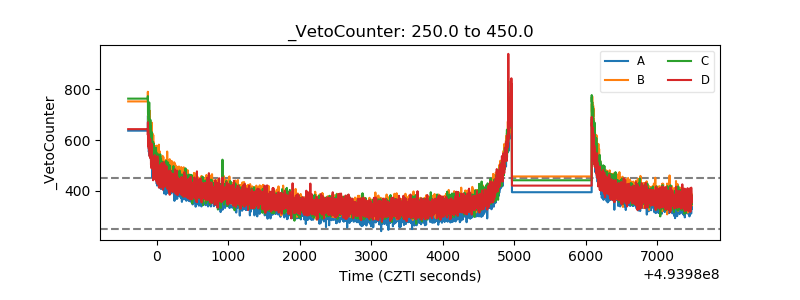 |