| Param | Original file | Final file |
|---|---|---|
| Filename | modeM0/AS1A14_022T05_9000006504_53632cztM0_level2.fits | modeM0/AS1A14_022T05_9000006504_53632cztM0_level2_quad_clean.evt |
| Size (bytes) | 932,126,400 | 77,345,280 |
| Size | 888.9 MB | 73.8 MB |
| Events in quadrant A | 8,186,863 | 488,168 |
| Events in quadrant B | 7,880,337 | 523,661 |
| Events in quadrant C | 11,872,223 | 319,133 |
| Events in quadrant D | 6,054,274 | 549,649 |
| Mode SS | |||
|---|---|---|---|
| Quadrant | BADHDUFLAG | Total packets | Discarded packets |
| A | 0 | 136 | 0 |
| B | 0 | 136 | 0 |
| C | 0 | 136 | 0 |
| D | 0 | 136 | 0 |
| Mode M9 | |||
|---|---|---|---|
| Quadrant | BADHDUFLAG | Total packets | Discarded packets |
| A | 0 | 9 | 0 |
| B | 0 | 9 | 0 |
| C | 0 | 9 | 0 |
| D | 0 | 9 | 0 |
| Mode M0 | |||
|---|---|---|---|
| Quadrant | BADHDUFLAG | Total packets | Discarded packets |
| A | 0 | 28878 | 1 |
| B | 0 | 27933 | 1 |
| C | 0 | 39583 | 2 |
| D | 0 | 22544 | 1 |
| Quadrant | Total seconds | Saturated seconds | Saturation percentage |
|---|---|---|---|
| A | 6604 | 1964 | 29.739552% |
| B | 6604 | 1936 | 29.315566% |
| C | 6603 | 3463 | 52.445858% |
| D | 6603 | 699 | 10.586097% |
Noise dominated data is calculated using 1-second bins in cleaned event files. If a bin has >2000 counts, and if more than 50% of those come from <1% of pixels, then it is considered to be noise-dominated and hence unusable.
| Quadrant | # 1 sec bins | Bins with >0 counts | Bins with >2000 counts | High rate bins dominated by noise | Noise dominated (total time) | Noise dominated (detector-on time) | Marked lightcurve |
|---|---|---|---|---|---|---|---|
| A | 7559 | 6605 | 1655 | 1655 | 21.89% | 25.06% | 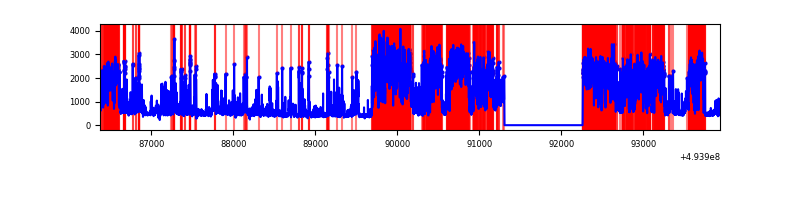 |
| B | 7559 | 6605 | 1320 | 1320 | 17.46% | 19.98% | 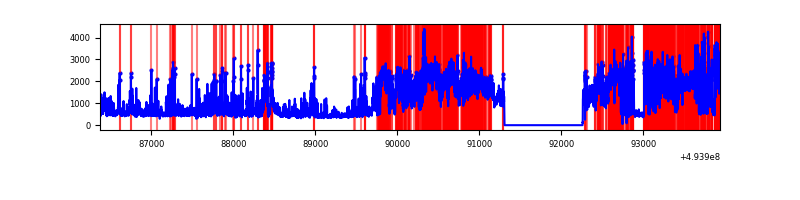 |
| C | 7558 | 6601 | 3225 | 3225 | 42.67% | 48.86% | 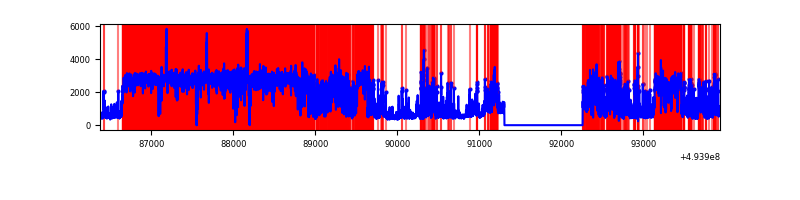 |
| D | 7558 | 6604 | 588 | 588 | 7.78% | 8.90% | 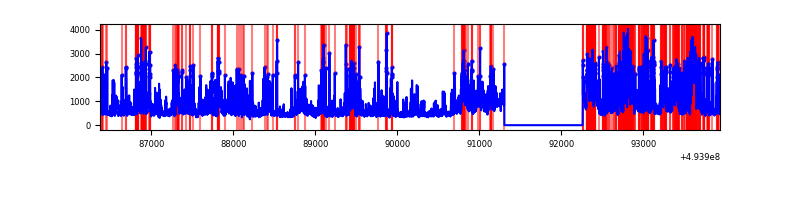 |
Top three noisy pixels from each quadrant. If the there are fewer than three noisy pixels in the level2.evt file, extra rows are filled as -1
| Pixel properties | Quadrant properties | ||||||
|---|---|---|---|---|---|---|---|
| Quadrant | DetID | PixID | Counts | Sigma | Mean | Median | Sigma |
| A | 3 | 78 | 3351190 | 21193.94 | 633 | 618 | 158.1 |
| A | 4 | 95 | 696643 | 4402.69 | 633 | 618 | 158.1 |
| A | 15 | 174 | 541101 | 3418.81 | 633 | 618 | 158.1 |
| B | 4 | 206 | 2772012 | 20094.53 | 644 | 623 | 137.9 |
| B | 15 | 20 | 1303820 | 9449.1 | 644 | 623 | 137.9 |
| B | 5 | 172 | 330479 | 2391.69 | 644 | 623 | 137.9 |
| C | 1 | 241 | 6343982 | 47012.33 | 482 | 479 | 134.9 |
| C | 15 | 224 | 2605152 | 19303.49 | 482 | 479 | 134.9 |
| C | 10 | 22 | 394976 | 2923.66 | 482 | 479 | 134.9 |
| D | 8 | 176 | 1719879 | 8574.27 | 691 | 660 | 200.5 |
| D | 3 | 12 | 266001 | 1323.34 | 691 | 660 | 200.5 |
| D | 13 | 153 | 265835 | 1322.51 | 691 | 660 | 200.5 |
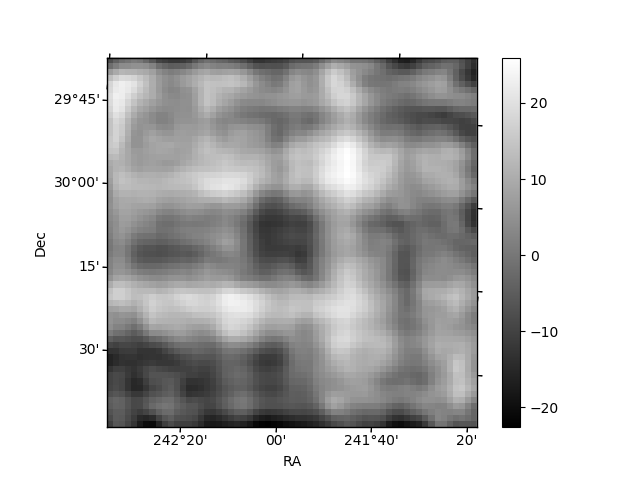
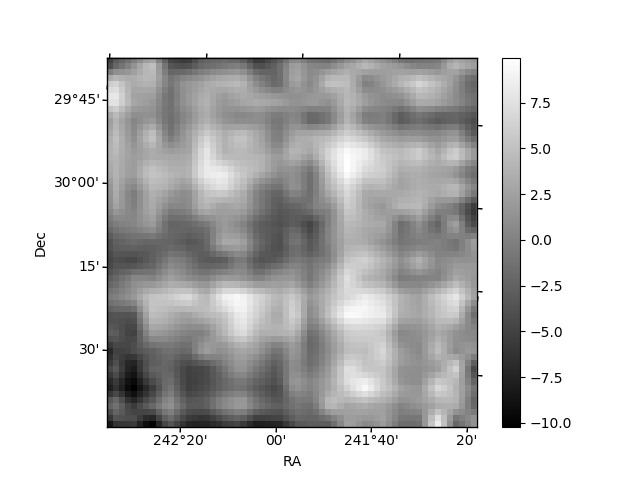
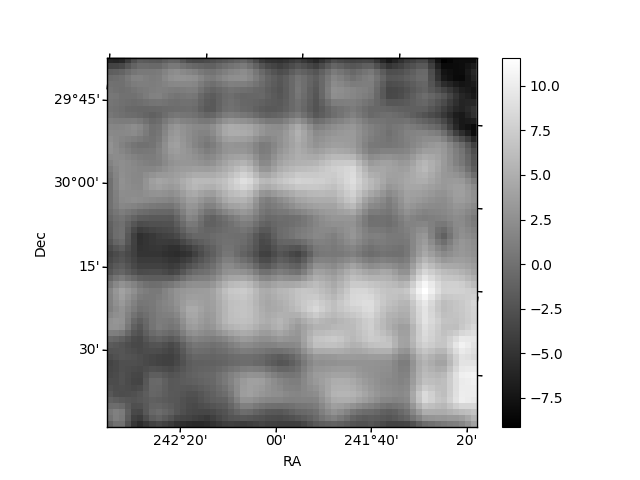
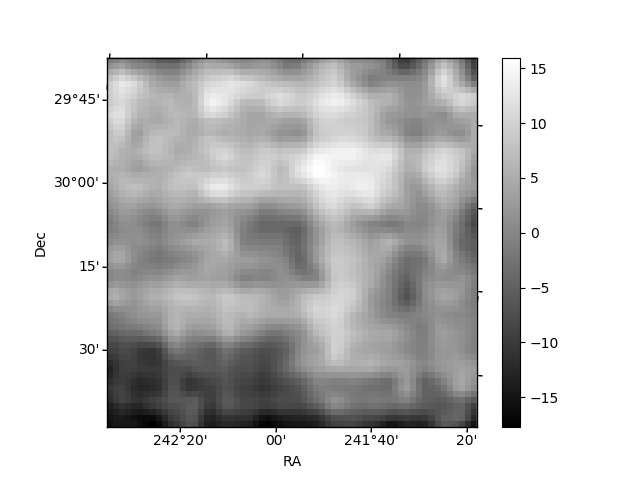
Histogram calculated using DETX and DETY for each event in the final _common_clean file
| Quadrant A | 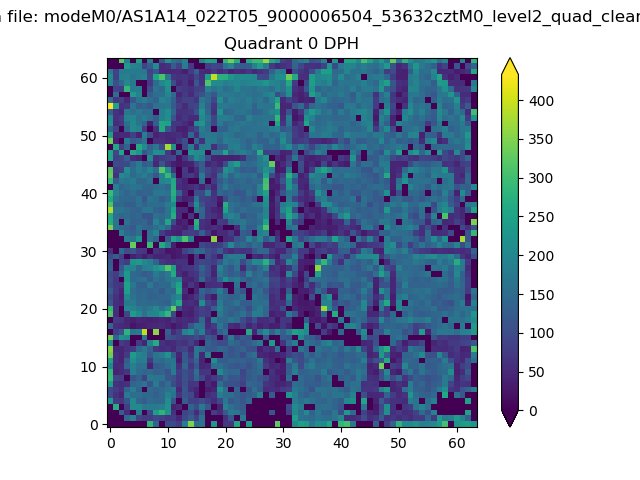 |
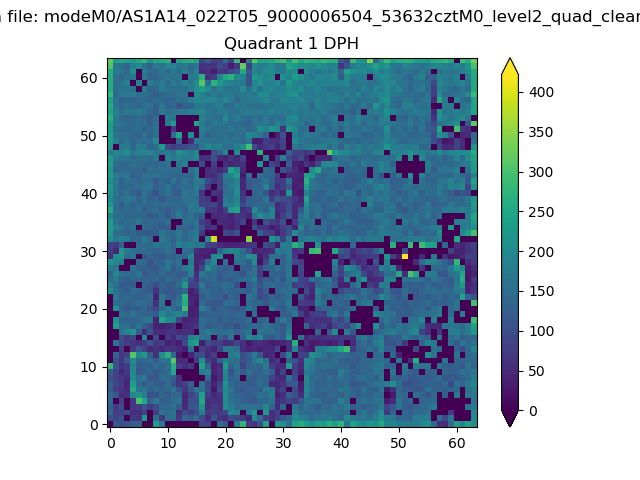 |
Quadrant B |
|---|---|---|---|
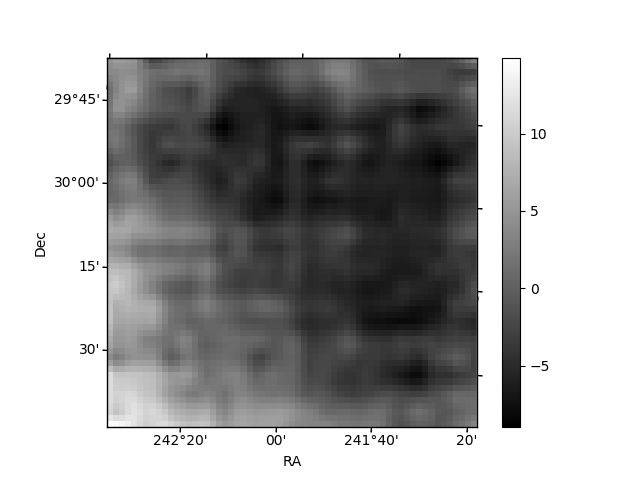
| Quadrant D | 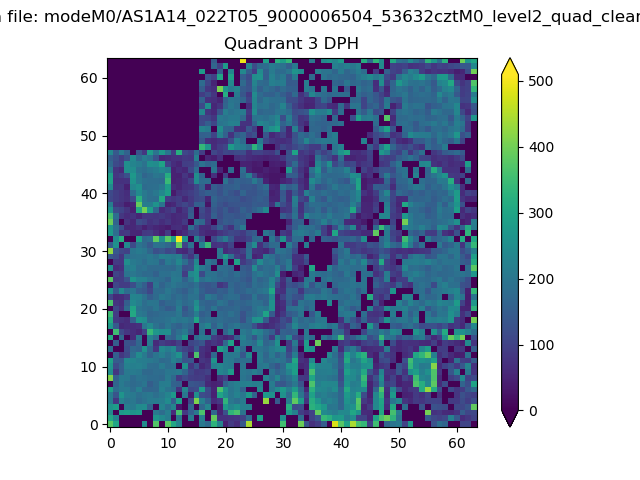 |
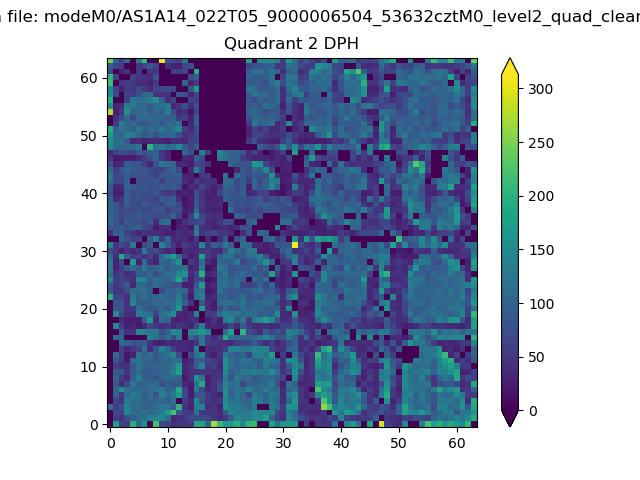 |
Quadrant C |
| Plot type | Count rate plots | Images |
|---|---|---|
| Comparison with Poisson distribution Blue bars denote a histogram of data divided into 1 sec bins. Red curve is a Poisson curve with rate = median count rate of data. |
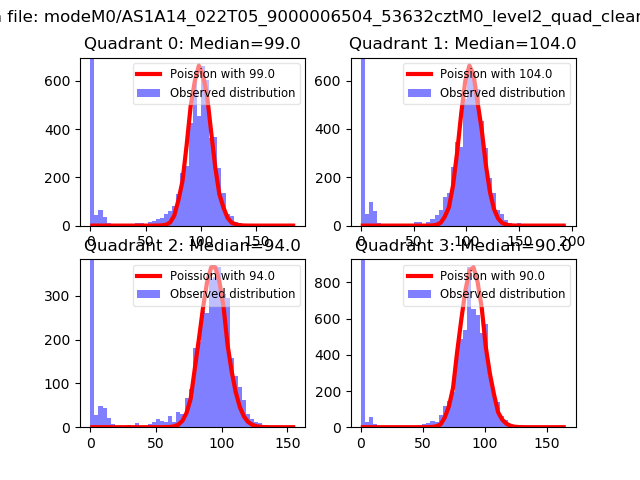 |
 |
| Quadrant-wise count rates Data is divided into 100 sec bins |
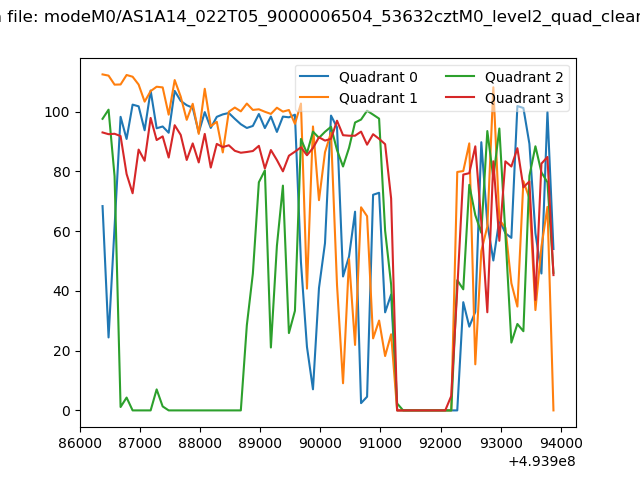 |
|
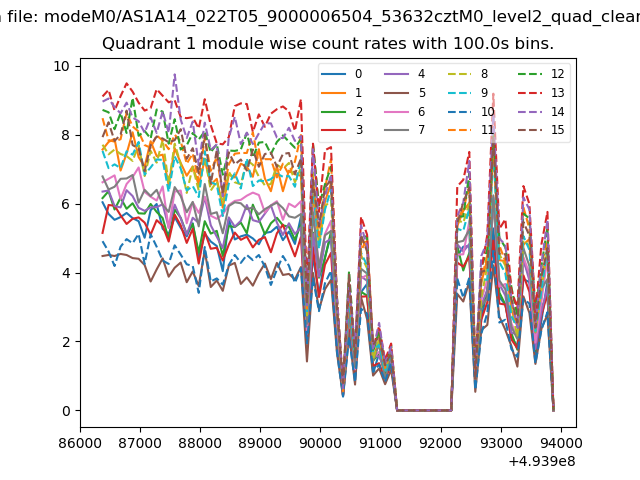
| Module-wise count rates for Quadrant A Data is divided into 100 sec bins |
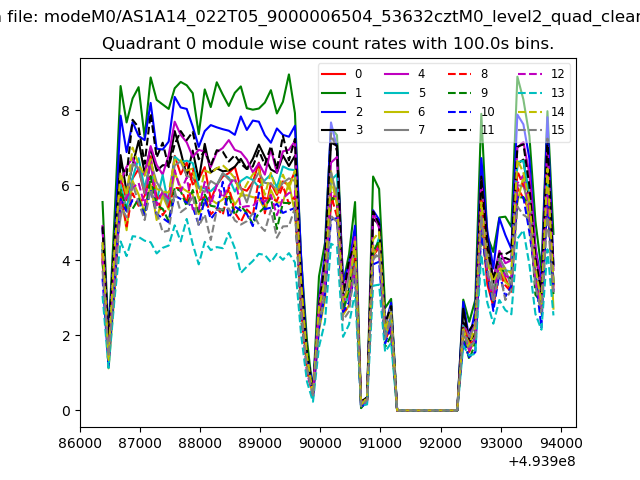 |
 |
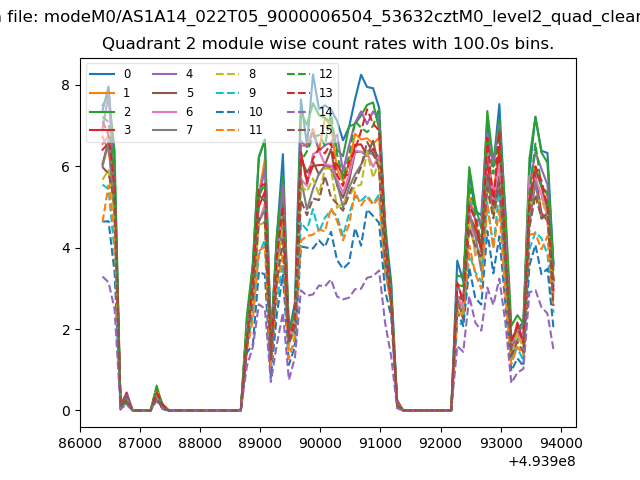
| Module-wise count rates for Quadrant B Data is divided into 100 sec bins |
 |
 |
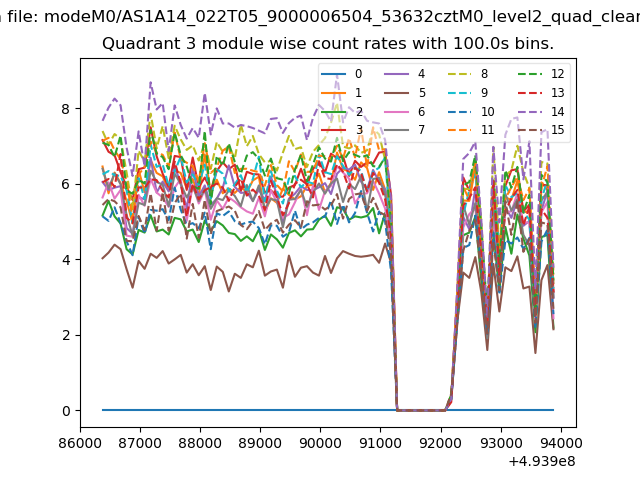
| Module-wise count rates for Quadrant C Data is divided into 100 sec bins |
 |
 |
| Module-wise count rates for Quadrant D Data is divided into 100 sec bins |
 |
 |
| Parameter | Plot |
|---|---|
| CZT HV Monitor | 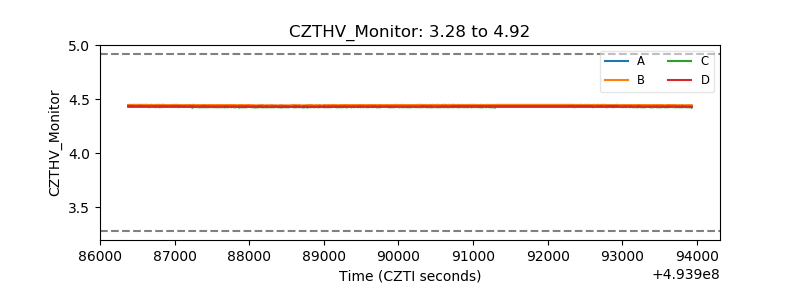 |
| D_VDD | 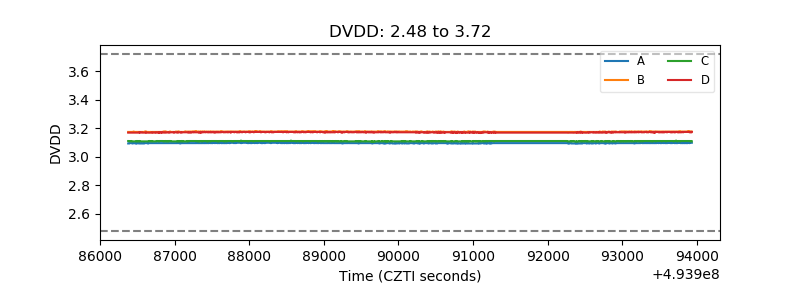 |
| Temperature 1 | 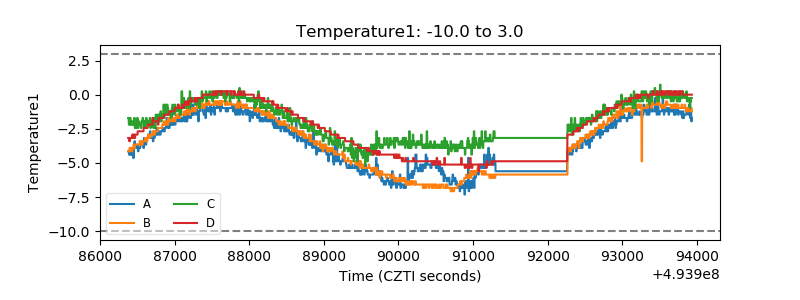 |
| Veto HV Monitor | 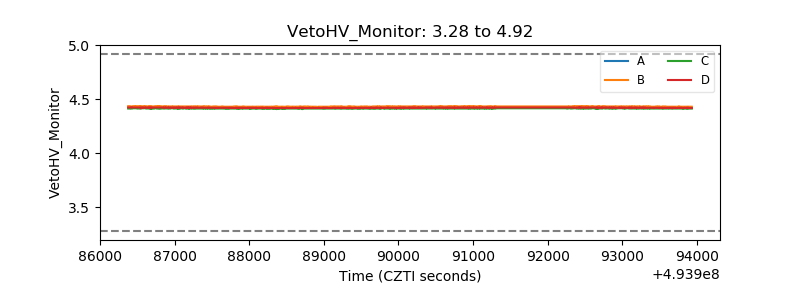 |
| Veto LLD | 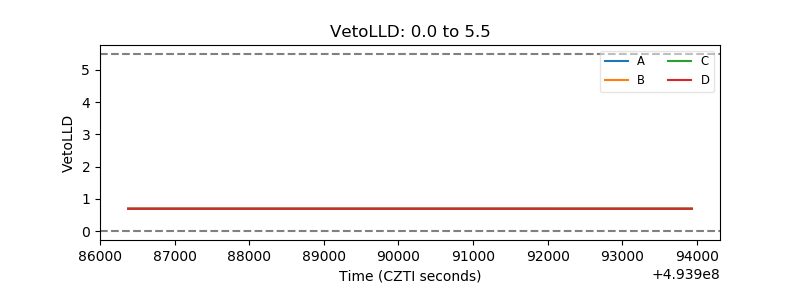 |
| Alpha Counter | 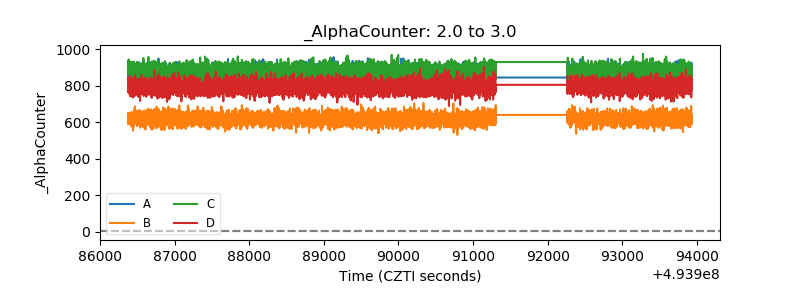 |
| _CPM_Rate | 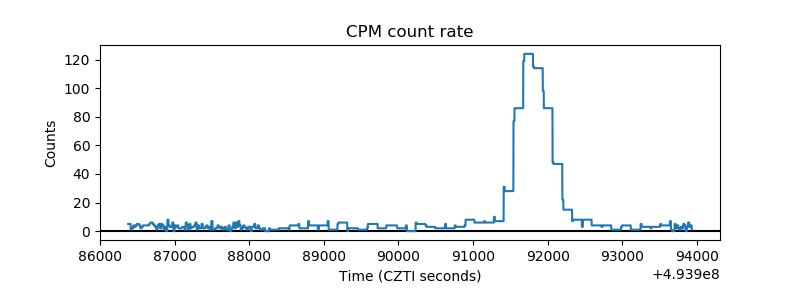 |
| CZT Counter | 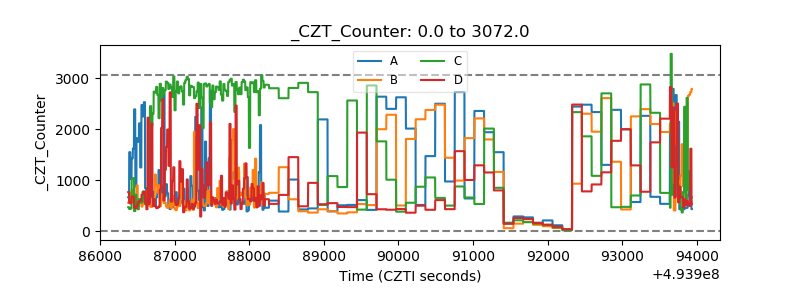 |
| +2.5 Volts monitor | 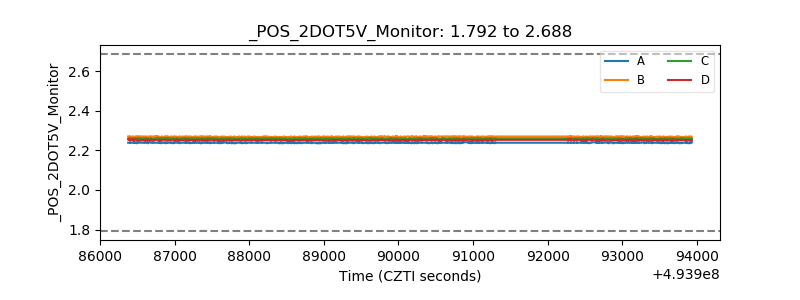 |
| +5 Volts monitor | 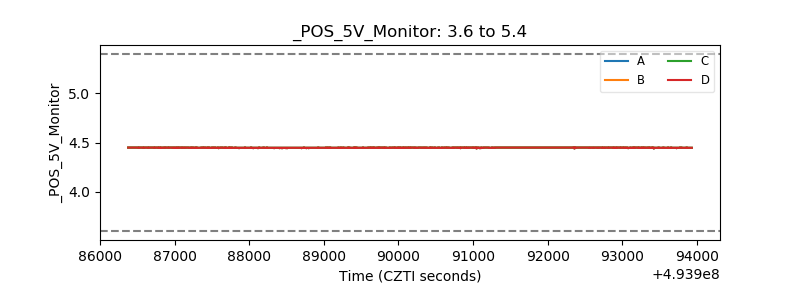 |
| _ROLL_ROT | 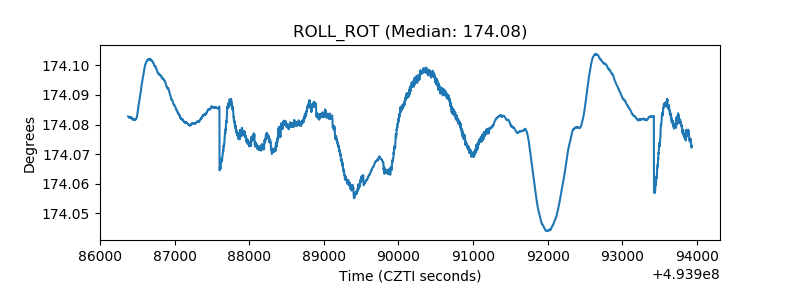 |
| _Roll_DEC | 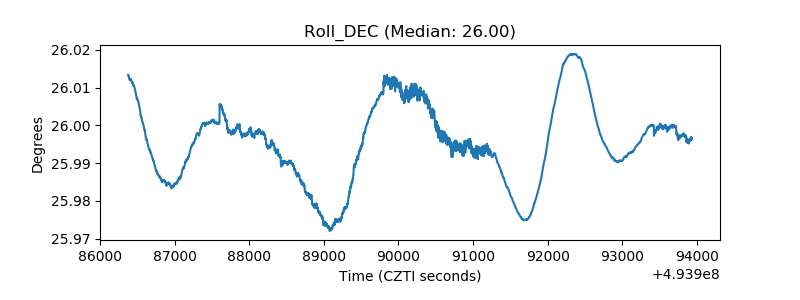 |
| _Roll_RA | 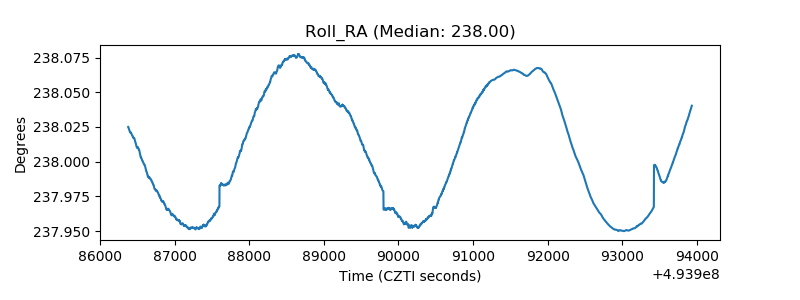 |
| Veto Counter | 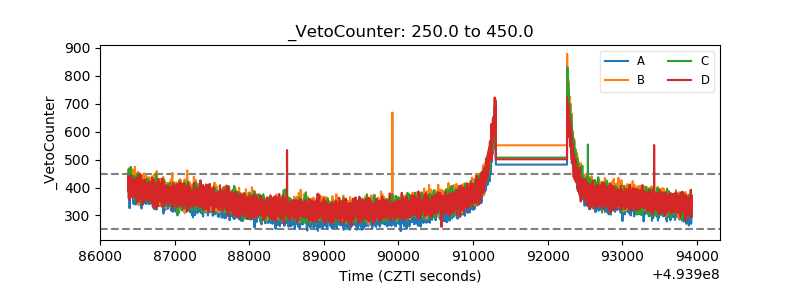 |