| Param | Original file | Final file |
|---|---|---|
| Filename | modeM0/AS1A14_022T05_9000006504_53634cztM0_level2.fits | modeM0/AS1A14_022T05_9000006504_53634cztM0_level2_quad_clean.evt |
| Size (bytes) | 1,118,520,000 | 77,950,080 |
| Size | 1.0 GB | 74.3 MB |
| Events in quadrant A | 8,048,827 | 567,727 |
| Events in quadrant B | 15,688,376 | 156,589 |
| Events in quadrant C | 9,341,224 | 550,222 |
| Events in quadrant D | 7,767,722 | 581,191 |
| Mode SS | |||
|---|---|---|---|
| Quadrant | BADHDUFLAG | Total packets | Discarded packets |
| A | 0 | 146 | 0 |
| B | 0 | 146 | 0 |
| C | 0 | 146 | 0 |
| D | 0 | 146 | 0 |
| Mode M0 | |||
|---|---|---|---|
| Quadrant | BADHDUFLAG | Total packets | Discarded packets |
| A | 0 | 28920 | 0 |
| B | 0 | 51599 | 1 |
| C | 0 | 32782 | 0 |
| D | 0 | 28095 | 0 |
| Quadrant | Total seconds | Saturated seconds | Saturation percentage |
|---|---|---|---|
| A | 7232 | 1608 | 22.234513% |
| B | 7231 | 5992 | 82.865440% |
| C | 7231 | 1644 | 22.735445% |
| D | 7232 | 865 | 11.960730% |
Noise dominated data is calculated using 1-second bins in cleaned event files. If a bin has >2000 counts, and if more than 50% of those come from <1% of pixels, then it is considered to be noise-dominated and hence unusable.
| Quadrant | # 1 sec bins | Bins with >0 counts | Bins with >2000 counts | High rate bins dominated by noise | Noise dominated (total time) | Noise dominated (detector-on time) | Marked lightcurve |
|---|---|---|---|---|---|---|---|
| A | 7233 | 7233 | 1445 | 1445 | 19.98% | 19.98% | 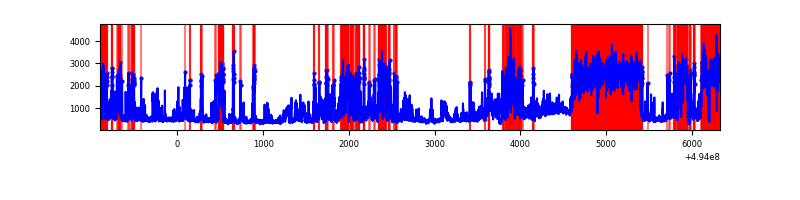 |
| B | 7232 | 7229 | 4677 | 4677 | 64.67% | 64.70% | 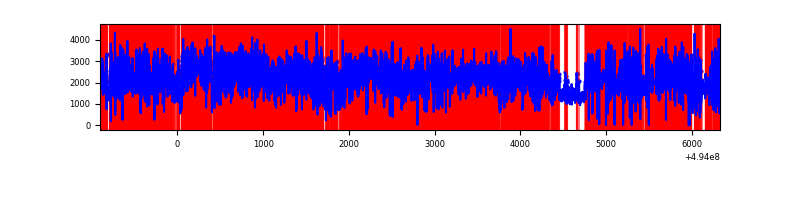 |
| C | 7232 | 7231 | 1531 | 1531 | 21.17% | 21.17% | 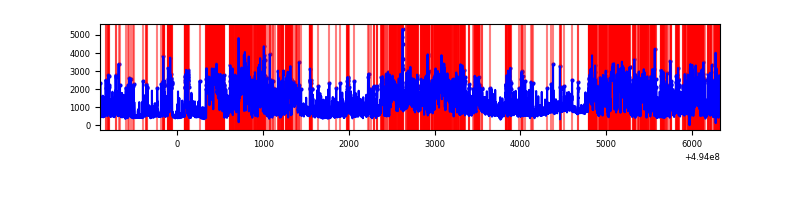 |
| D | 7233 | 7233 | 940 | 940 | 13.00% | 13.00% | 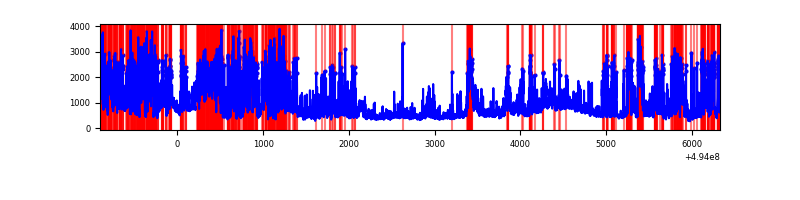 |
Top three noisy pixels from each quadrant. If the there are fewer than three noisy pixels in the level2.evt file, extra rows are filled as -1
| Pixel properties | Quadrant properties | ||||||
|---|---|---|---|---|---|---|---|
| Quadrant | DetID | PixID | Counts | Sigma | Mean | Median | Sigma |
| A | 3 | 78 | 3252026 | 18398.62 | 707 | 689 | 176.7 |
| A | 4 | 191 | 957083 | 5412.03 | 707 | 689 | 176.7 |
| A | 4 | 95 | 270984 | 1529.54 | 707 | 689 | 176.7 |
| B | 15 | 20 | 11328329 | 128814.09 | 402 | 390 | 87.9 |
| B | 4 | 206 | 1172247 | 13325.61 | 402 | 390 | 87.9 |
| B | 5 | 172 | 757819 | 8613.0 | 402 | 390 | 87.9 |
| C | 15 | 224 | 2663036 | 13344.04 | 719 | 714 | 199.5 |
| C | 9 | 38 | 1976503 | 9903.01 | 719 | 714 | 199.5 |
| C | 1 | 241 | 740803 | 3709.46 | 719 | 714 | 199.5 |
| D | 8 | 176 | 3069176 | 14024.57 | 756 | 722 | 218.8 |
| D | 0 | 5 | 356928 | 1628.06 | 756 | 722 | 218.8 |
| D | 3 | 12 | 351992 | 1605.5 | 756 | 722 | 218.8 |
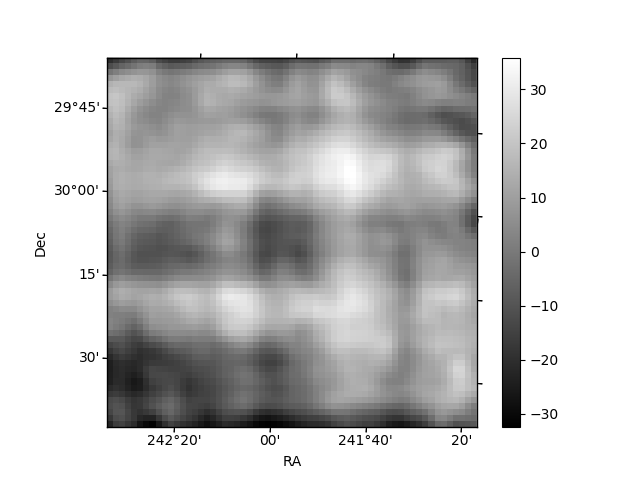
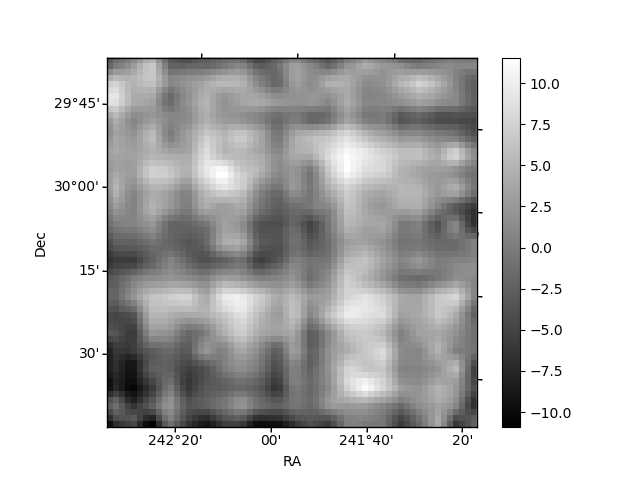
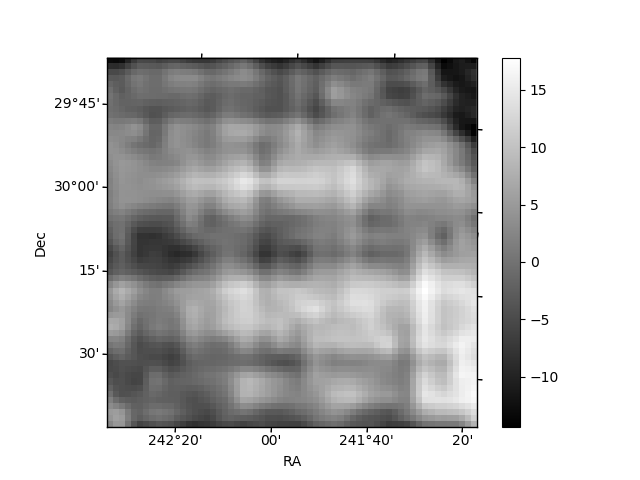
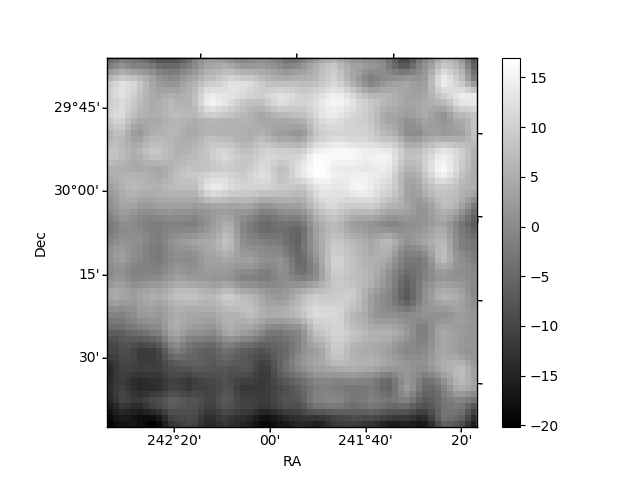
Histogram calculated using DETX and DETY for each event in the final _common_clean file
| Quadrant A | 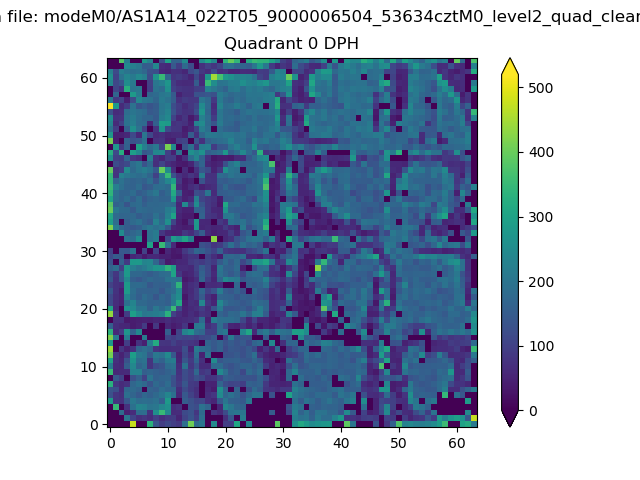 |
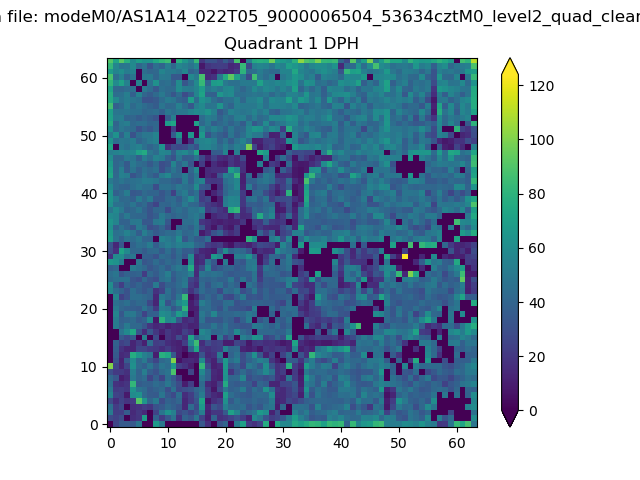 |
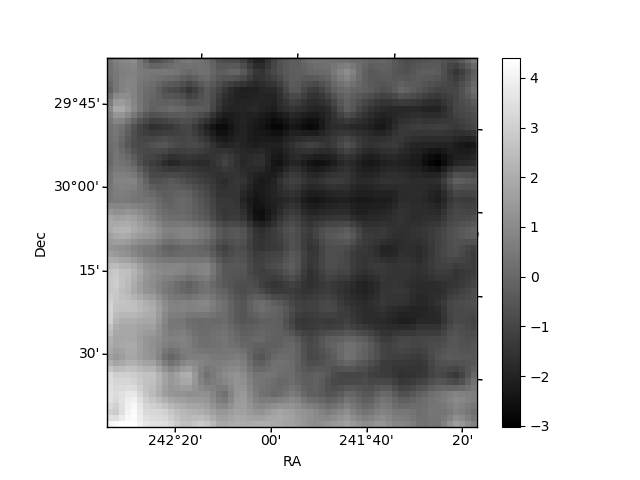
Quadrant B |
|---|---|---|---|
| Quadrant D | 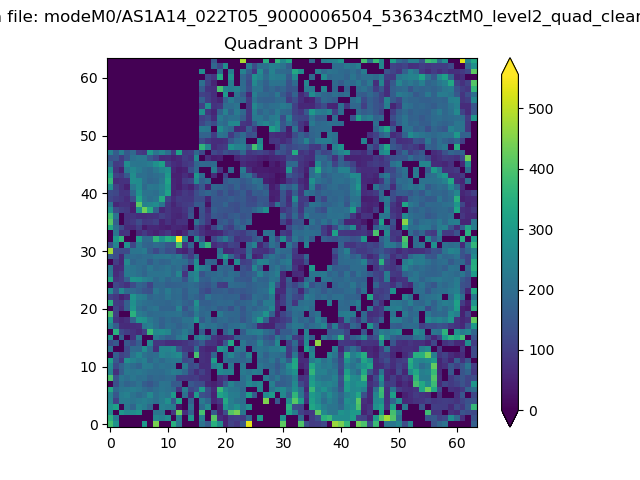 |
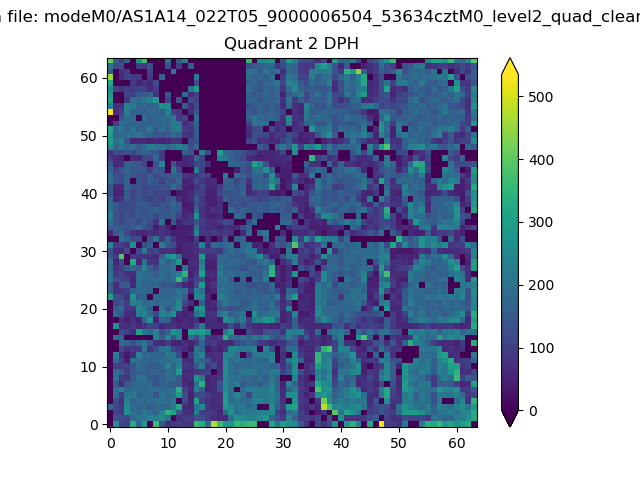 |
Quadrant C |
| Plot type | Count rate plots | Images |
|---|---|---|
| Comparison with Poisson distribution Blue bars denote a histogram of data divided into 1 sec bins. Red curve is a Poisson curve with rate = median count rate of data. |
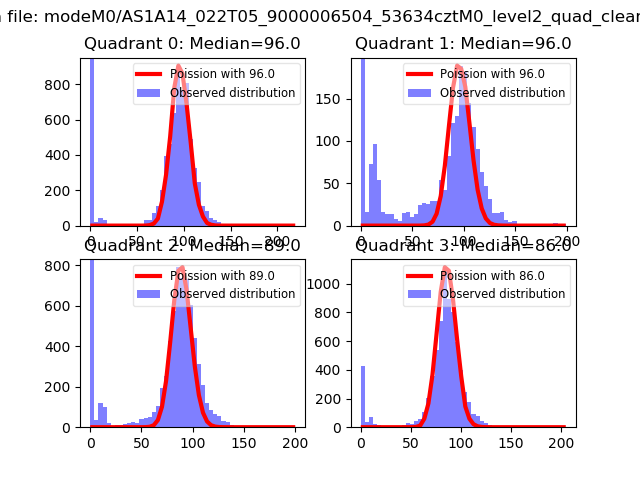 |
 |
| Quadrant-wise count rates Data is divided into 100 sec bins |
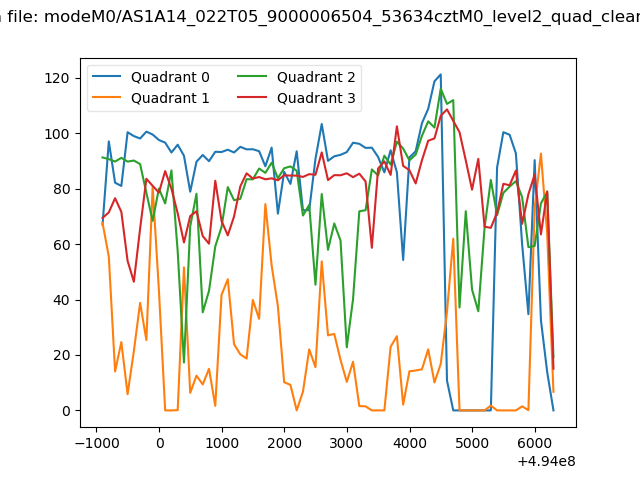 |
|
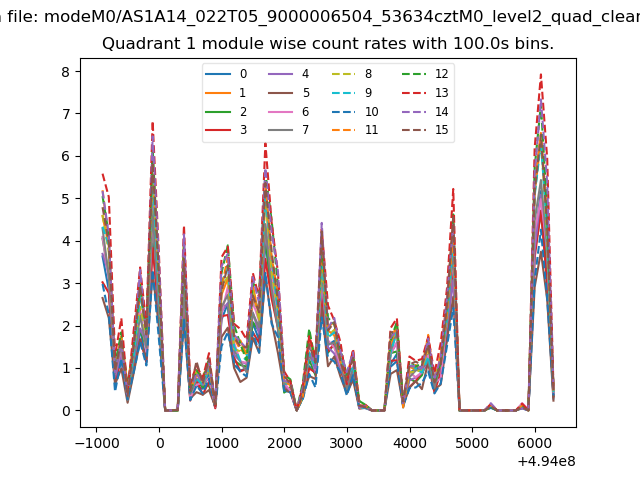
| Module-wise count rates for Quadrant A Data is divided into 100 sec bins |
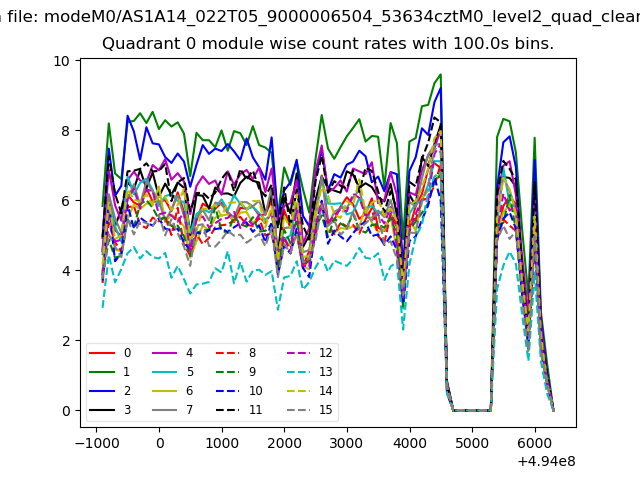 |
 |
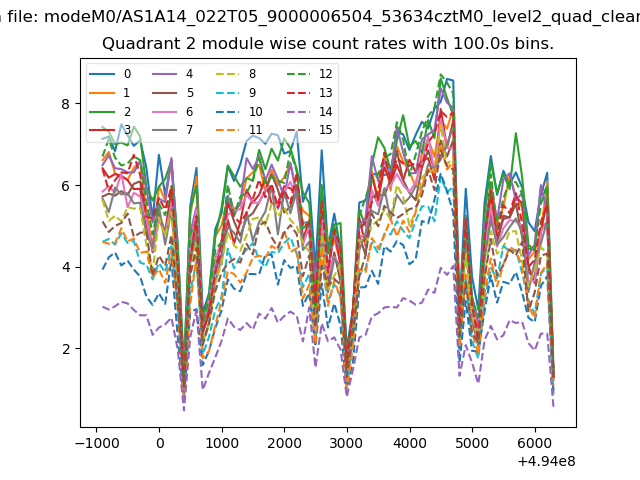
| Module-wise count rates for Quadrant B Data is divided into 100 sec bins |
 |
 |
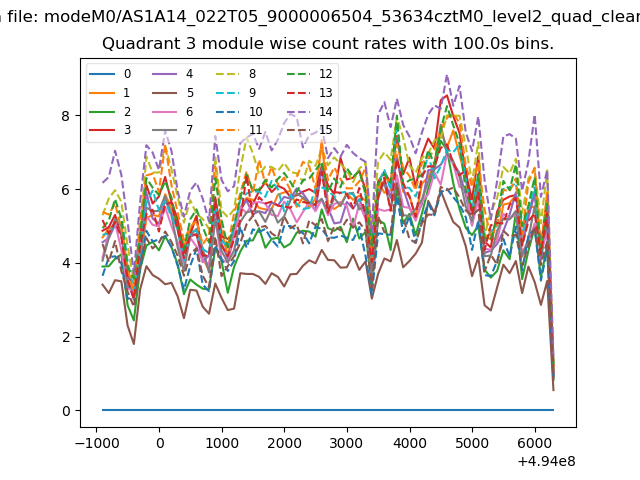
| Module-wise count rates for Quadrant C Data is divided into 100 sec bins |
 |
 |
| Module-wise count rates for Quadrant D Data is divided into 100 sec bins |
 |
 |
| Parameter | Plot |
|---|---|
| CZT HV Monitor | 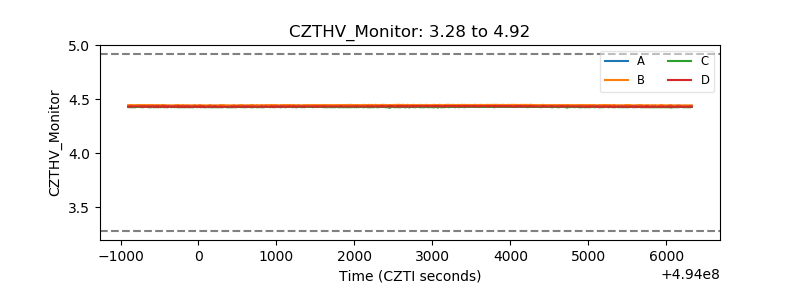 |
| D_VDD | 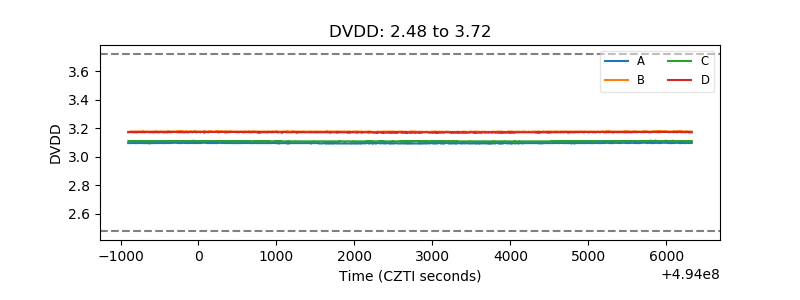 |
| Temperature 1 | 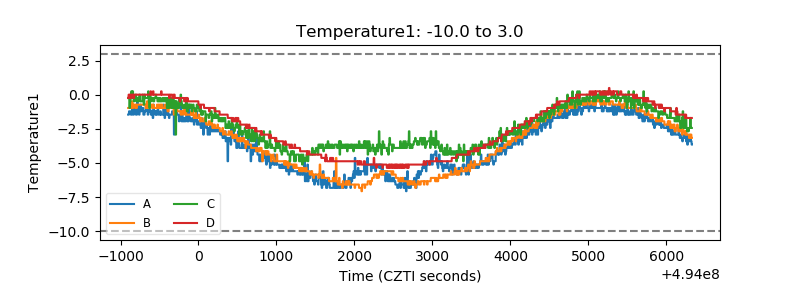 |
| Veto HV Monitor | 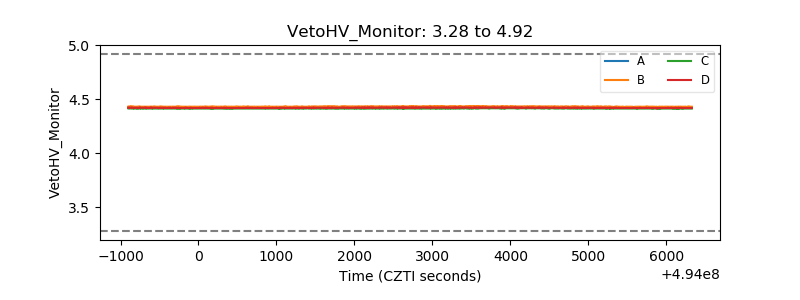 |
| Veto LLD | 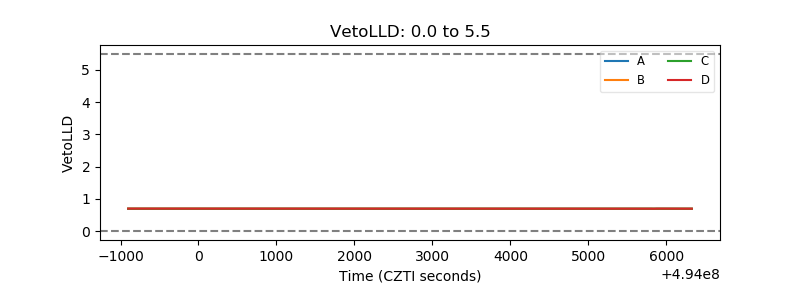 |
| Alpha Counter | 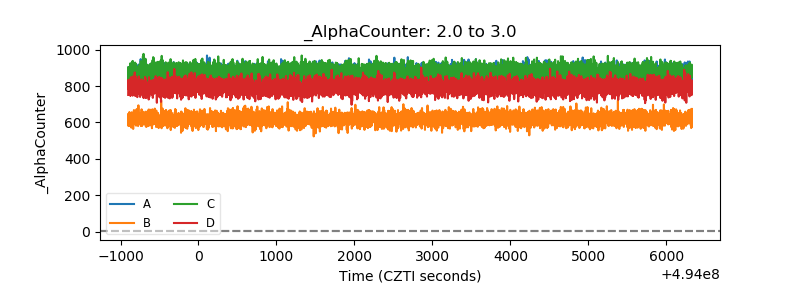 |
| _CPM_Rate | 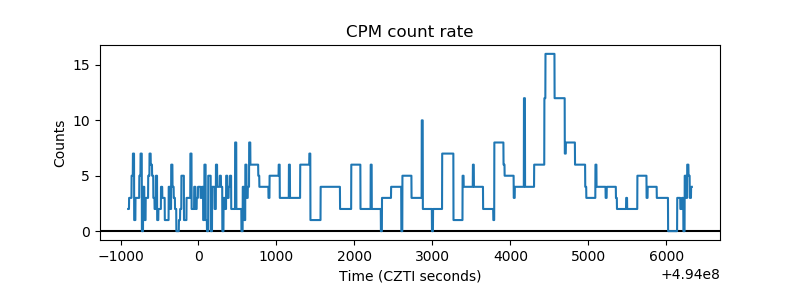 |
| CZT Counter | 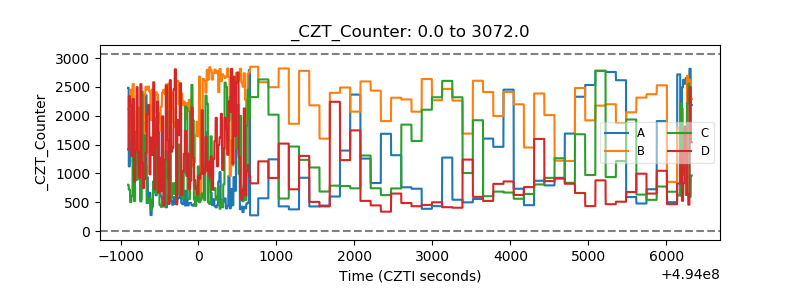 |
| +2.5 Volts monitor | 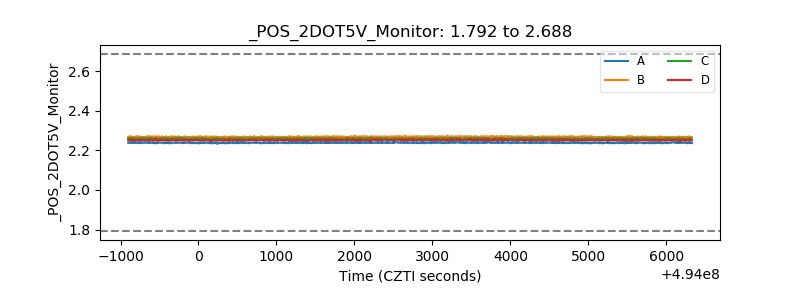 |
| +5 Volts monitor | 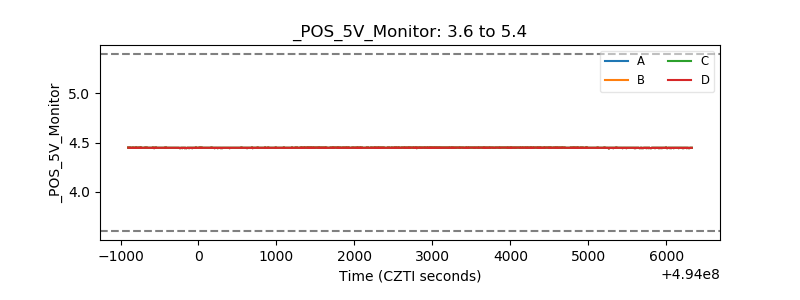 |
| _ROLL_ROT | 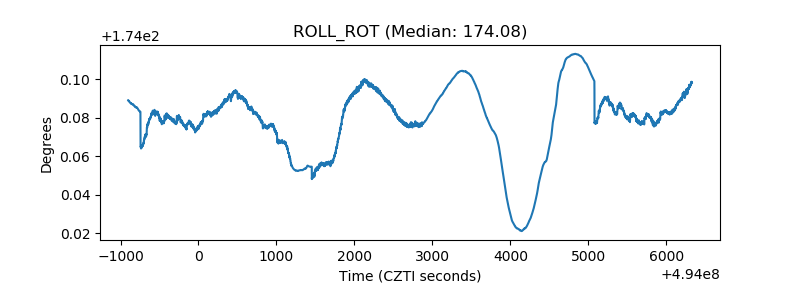 |
| _Roll_DEC | 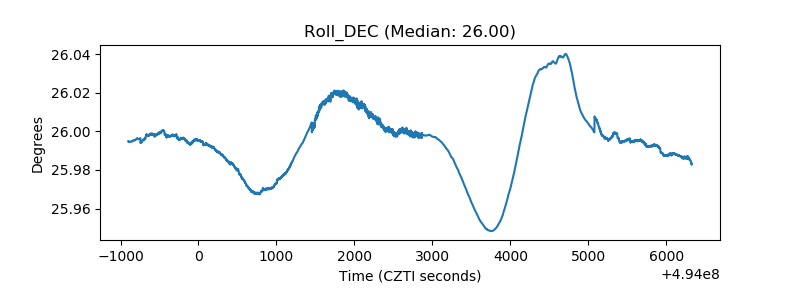 |
| _Roll_RA | 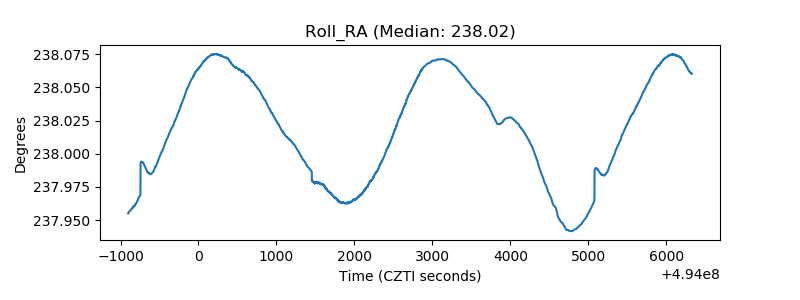 |
| Veto Counter | 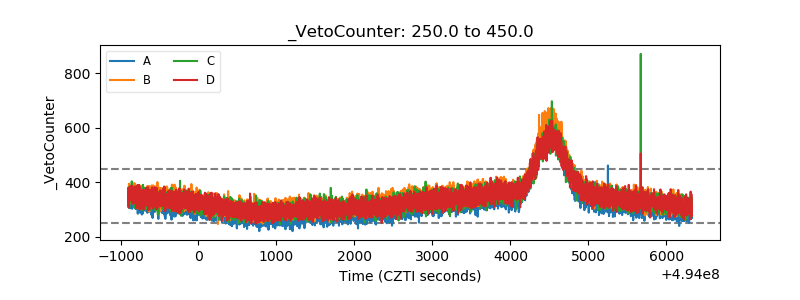 |