| Param | Original file | Final file |
|---|---|---|
| Filename | modeM0/AS1A14_022T05_9000006504_53635cztM0_level2.fits | modeM0/AS1A14_022T05_9000006504_53635cztM0_level2_quad_clean.evt |
| Size (bytes) | 1,388,534,400 | 60,998,400 |
| Size | 1.3 GB | 58.2 MB |
| Events in quadrant A | 12,585,365 | 361,259 |
| Events in quadrant B | 16,889,337 | 108,872 |
| Events in quadrant C | 14,090,536 | 314,067 |
| Events in quadrant D | 7,276,157 | 556,621 |
| Mode SS | |||
|---|---|---|---|
| Quadrant | BADHDUFLAG | Total packets | Discarded packets |
| A | 0 | 146 | 0 |
| B | 0 | 146 | 0 |
| C | 0 | 146 | 0 |
| D | 0 | 146 | 0 |
| Mode M0 | |||
|---|---|---|---|
| Quadrant | BADHDUFLAG | Total packets | Discarded packets |
| A | 0 | 42382 | 0 |
| B | 0 | 55244 | 2 |
| C | 0 | 46717 | 0 |
| D | 0 | 26690 | 0 |
| Quadrant | Total seconds | Saturated seconds | Saturation percentage |
|---|---|---|---|
| A | 7259 | 3744 | 51.577352% |
| B | 7258 | 6326 | 87.158997% |
| C | 7258 | 4100 | 56.489391% |
| D | 7258 | 1045 | 14.397906% |
Noise dominated data is calculated using 1-second bins in cleaned event files. If a bin has >2000 counts, and if more than 50% of those come from <1% of pixels, then it is considered to be noise-dominated and hence unusable.
| Quadrant | # 1 sec bins | Bins with >0 counts | Bins with >2000 counts | High rate bins dominated by noise | Noise dominated (total time) | Noise dominated (detector-on time) | Marked lightcurve |
|---|---|---|---|---|---|---|---|
| A | 7268 | 7268 | 3421 | 3421 | 47.07% | 47.07% | 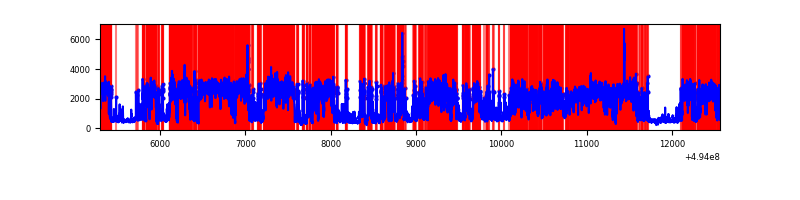 |
| B | 7267 | 7261 | 5493 | 5493 | 75.59% | 75.65% | 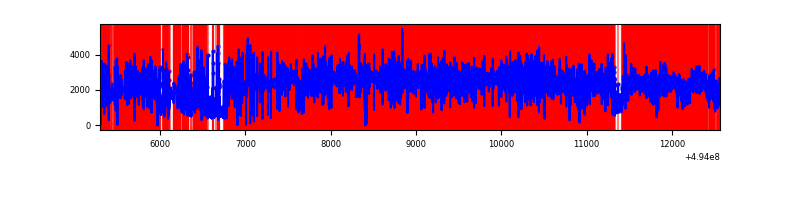 |
| C | 7267 | 7264 | 3960 | 3960 | 54.49% | 54.52% | 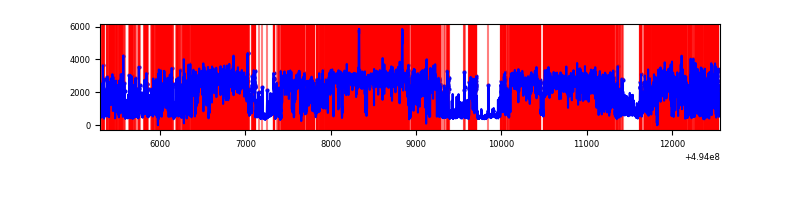 |
| D | 7267 | 7267 | 1046 | 1046 | 14.39% | 14.39% | 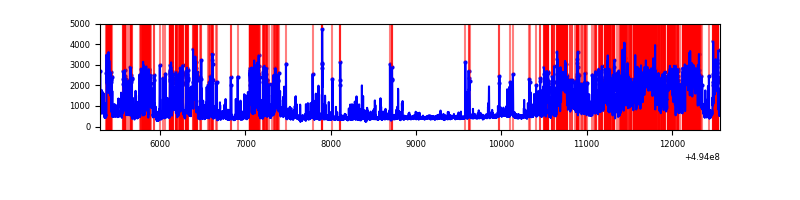 |
Top three noisy pixels from each quadrant. If the there are fewer than three noisy pixels in the level2.evt file, extra rows are filled as -1
| Pixel properties | Quadrant properties | ||||||
|---|---|---|---|---|---|---|---|
| Quadrant | DetID | PixID | Counts | Sigma | Mean | Median | Sigma |
| A | 3 | 78 | 8567525 | 59408.64 | 570 | 556 | 144.2 |
| A | 4 | 191 | 782504 | 5422.51 | 570 | 556 | 144.2 |
| A | 15 | 174 | 184362 | 1274.62 | 570 | 556 | 144.2 |
| B | 15 | 20 | 14332863 | 217238.79 | 300 | 290 | 66.0 |
| B | 4 | 206 | 753182 | 11411.58 | 300 | 290 | 66.0 |
| B | 7 | 0 | 139340 | 2107.58 | 300 | 290 | 66.0 |
| C | 1 | 241 | 9016827 | 64026.4 | 508 | 505 | 140.8 |
| C | 15 | 224 | 1985186 | 14093.55 | 508 | 505 | 140.8 |
| C | 13 | 3 | 233264 | 1652.86 | 508 | 505 | 140.8 |
| D | 8 | 176 | 1683790 | 8060.65 | 724 | 692 | 208.8 |
| D | 10 | 172 | 1086459 | 5199.93 | 724 | 692 | 208.8 |
| D | 3 | 12 | 474062 | 2267.05 | 724 | 692 | 208.8 |
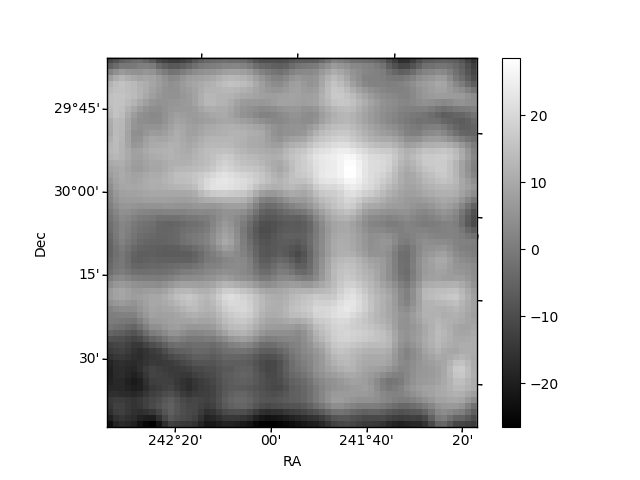
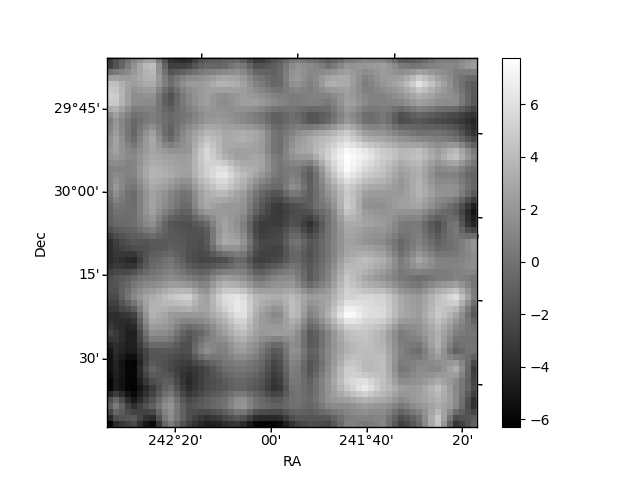
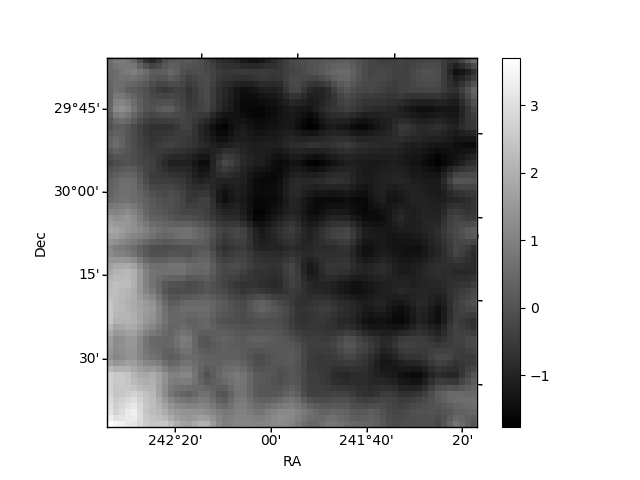
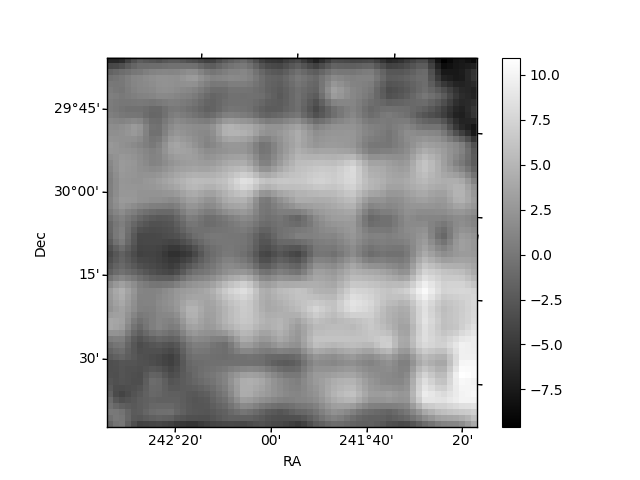
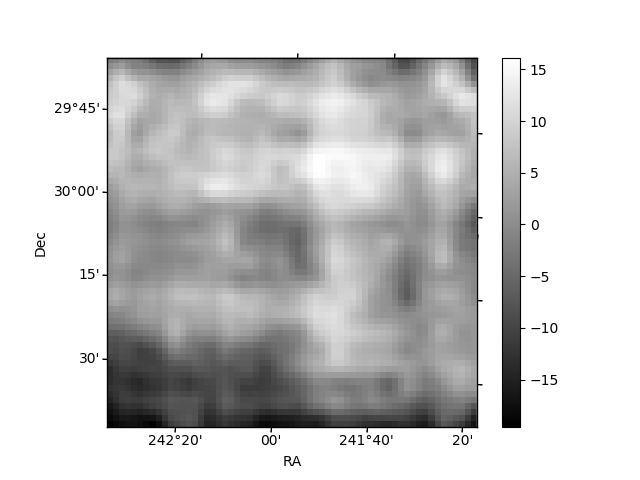
Histogram calculated using DETX and DETY for each event in the final _common_clean file
| Quadrant A | 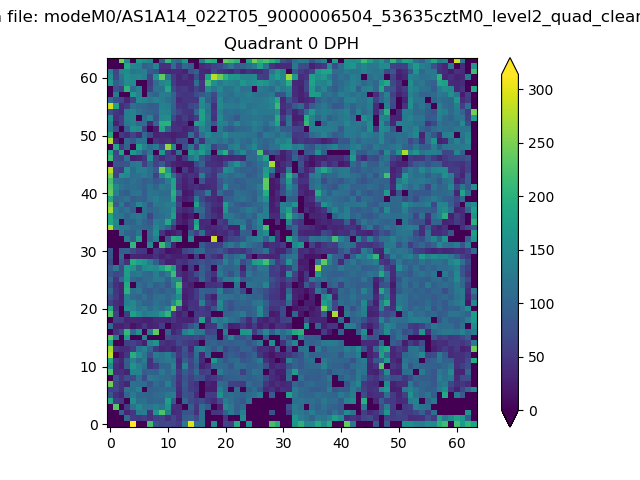 |
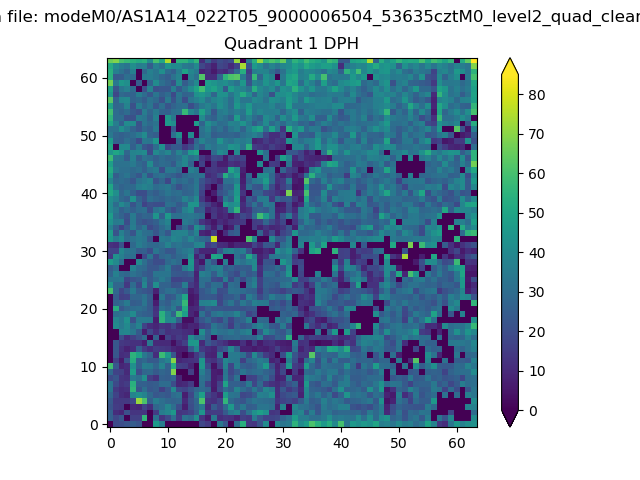 |
Quadrant B |
|---|---|---|---|
| Quadrant D | 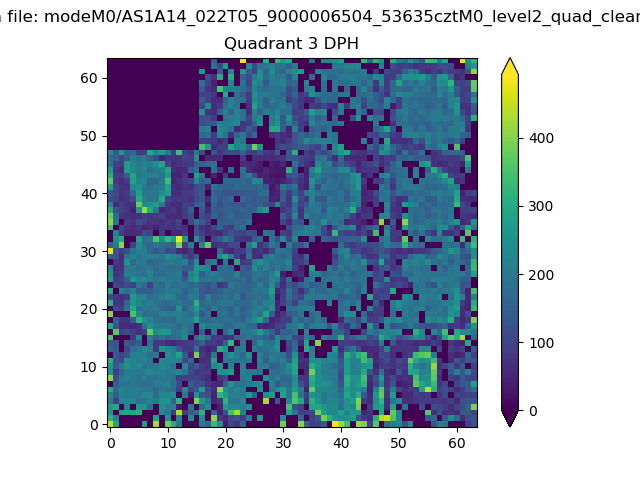 |
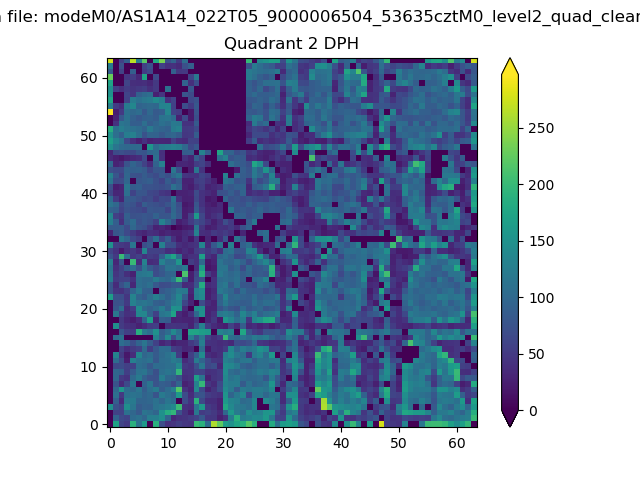 |
Quadrant C |
| Plot type | Count rate plots | Images |
|---|---|---|
| Comparison with Poisson distribution Blue bars denote a histogram of data divided into 1 sec bins. Red curve is a Poisson curve with rate = median count rate of data. |
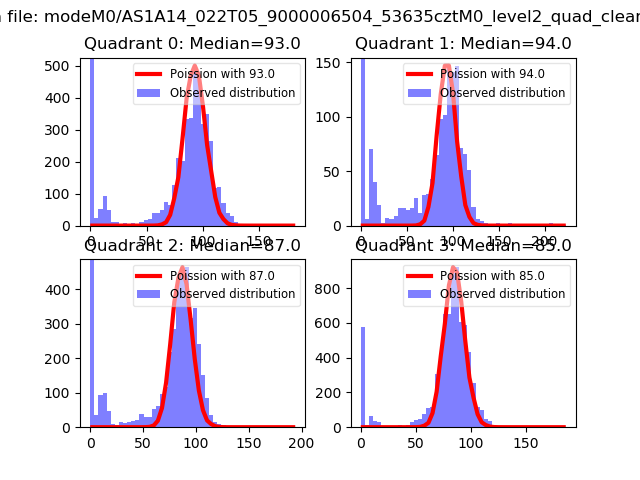 |
 |
| Quadrant-wise count rates Data is divided into 100 sec bins |
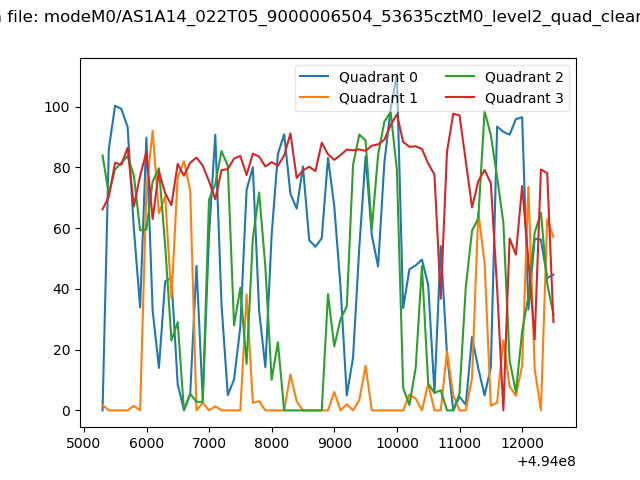 |
|
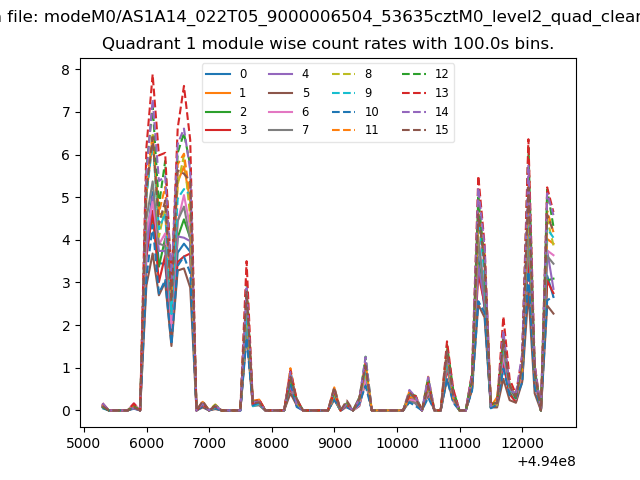
| Module-wise count rates for Quadrant A Data is divided into 100 sec bins |
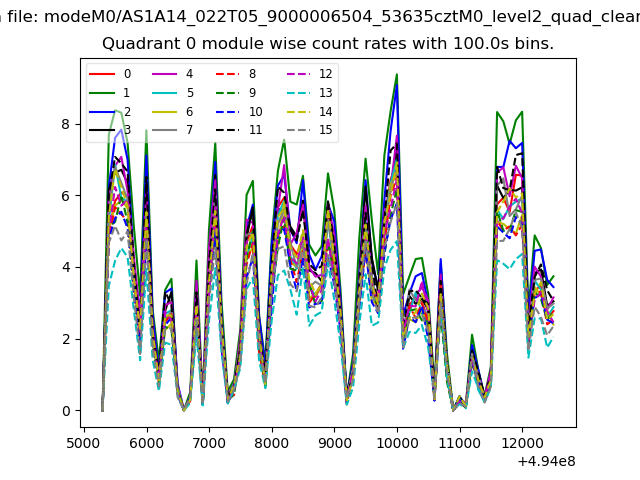 |
 |
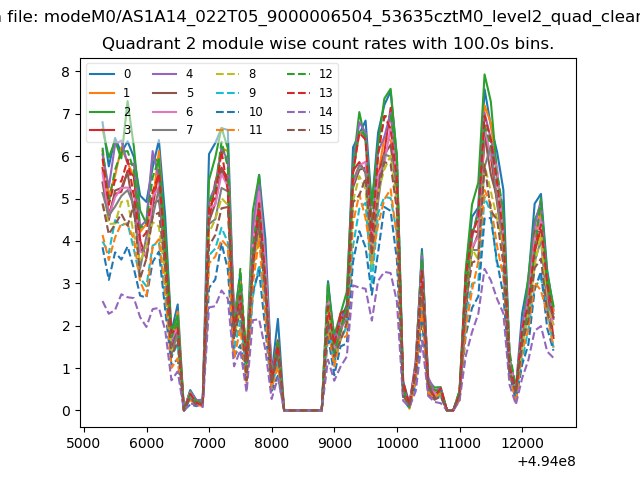
| Module-wise count rates for Quadrant B Data is divided into 100 sec bins |
 |
 |
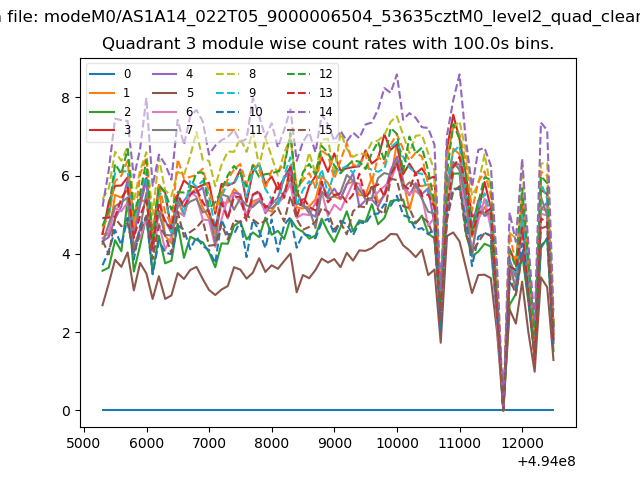
| Module-wise count rates for Quadrant C Data is divided into 100 sec bins |
 |
 |
| Module-wise count rates for Quadrant D Data is divided into 100 sec bins |
 |
 |
| Parameter | Plot |
|---|---|
| CZT HV Monitor | 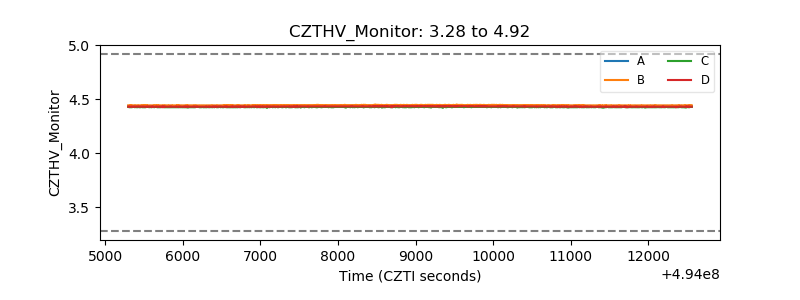 |
| D_VDD | 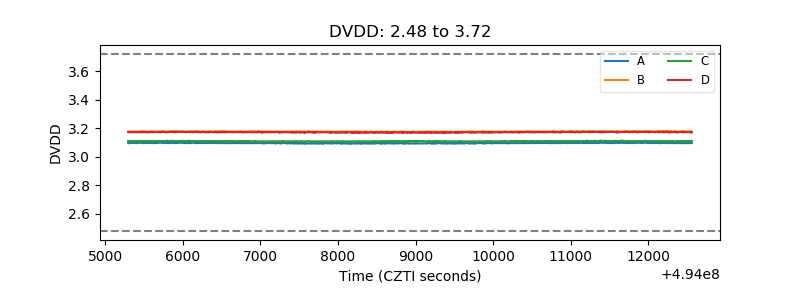 |
| Temperature 1 | 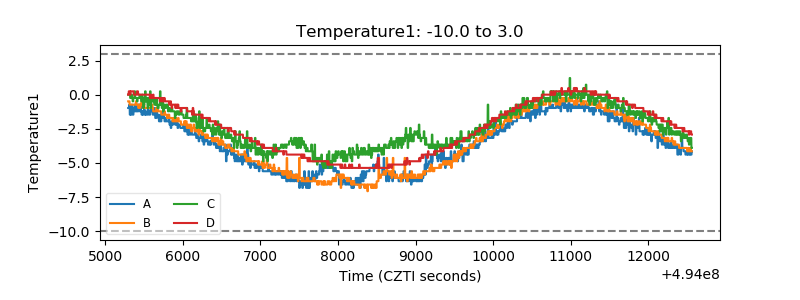 |
| Veto HV Monitor | 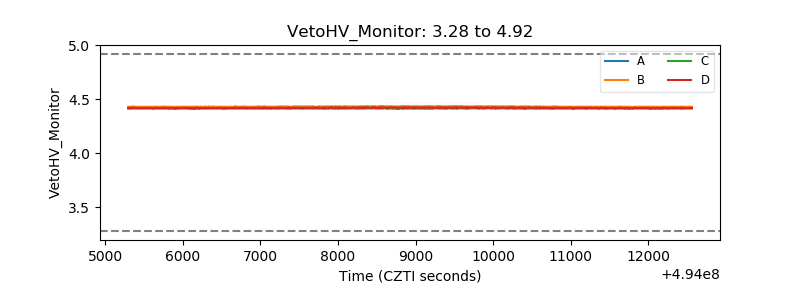 |
| Veto LLD | 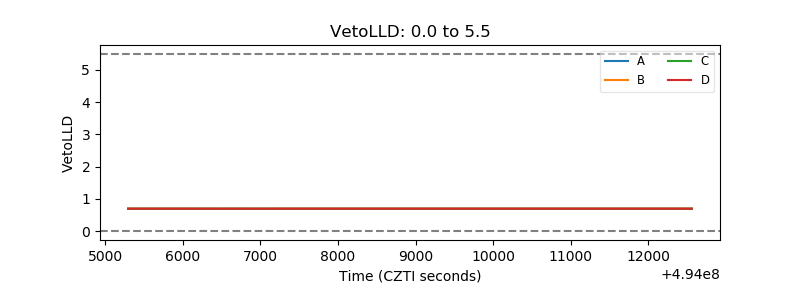 |
| Alpha Counter | 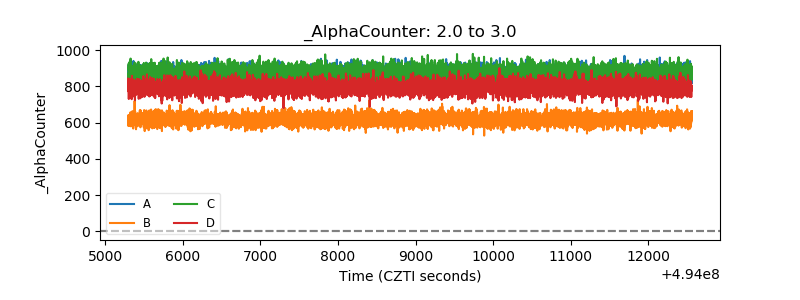 |
| _CPM_Rate | 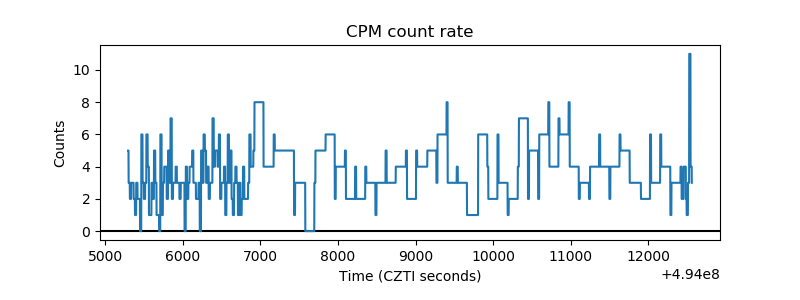 |
| CZT Counter | 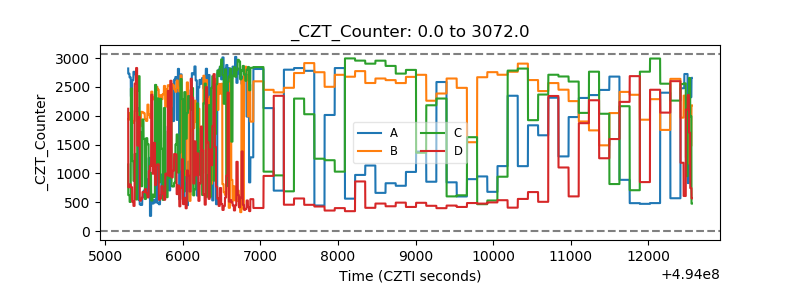 |
| +2.5 Volts monitor | 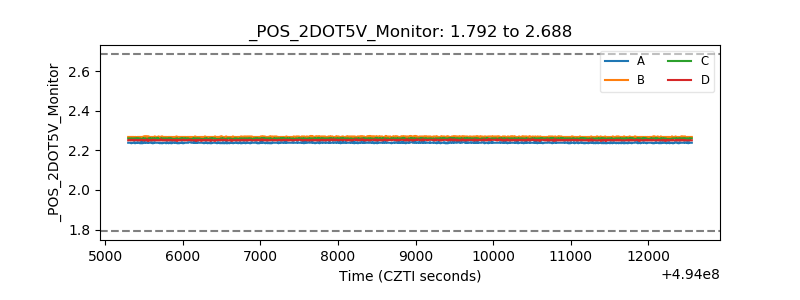 |
| +5 Volts monitor | 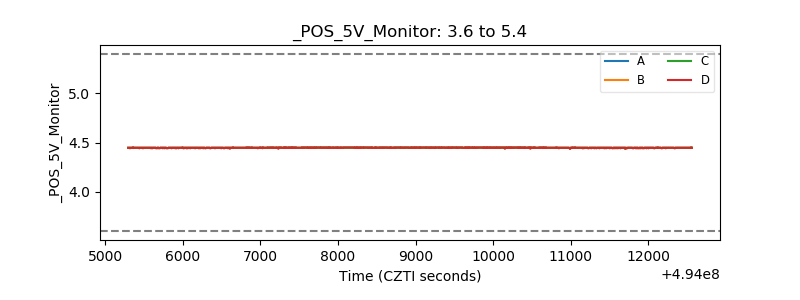 |
| _ROLL_ROT | 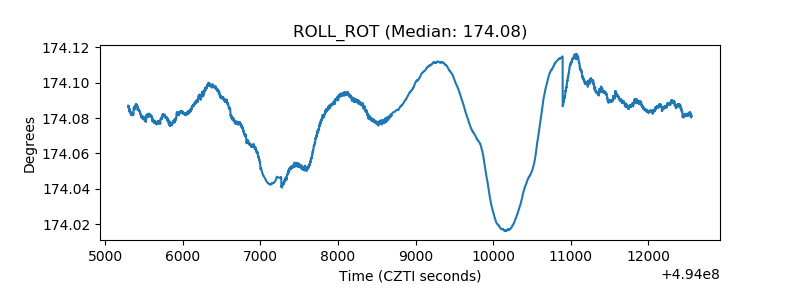 |
| _Roll_DEC | 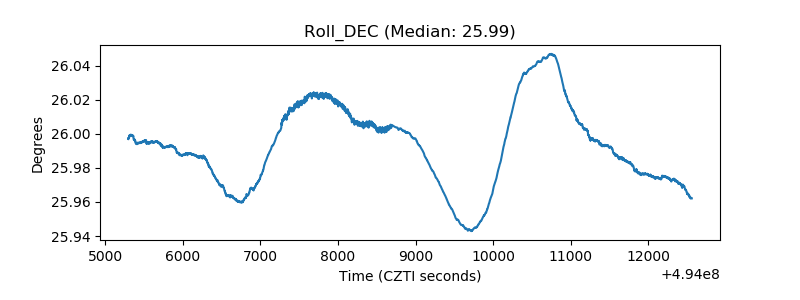 |
| _Roll_RA | 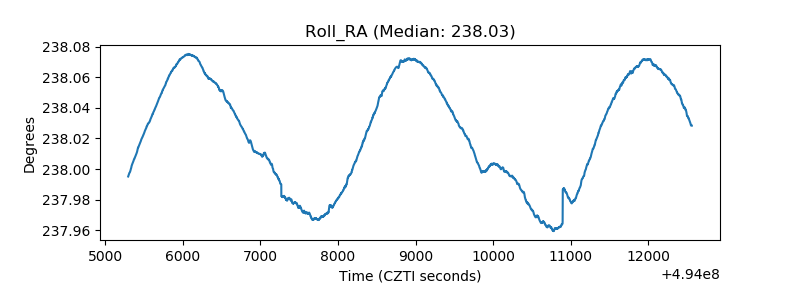 |
| Veto Counter | 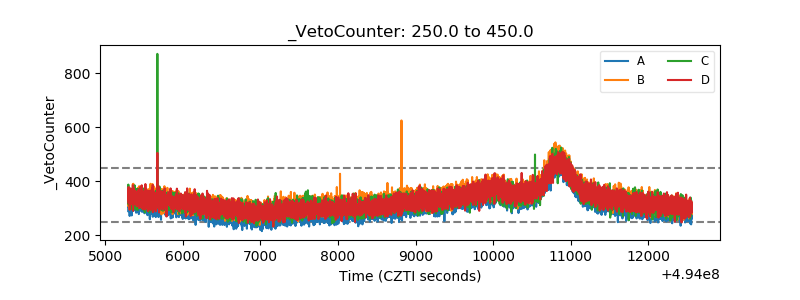 |