| Param | Original file | Final file |
|---|---|---|
| Filename | modeM0/AS1A14_022T05_9000006504_53636cztM0_level2.fits | modeM0/AS1A14_022T05_9000006504_53636cztM0_level2_quad_clean.evt |
| Size (bytes) | 1,239,569,280 | 86,780,160 |
| Size | 1.2 GB | 82.8 MB |
| Events in quadrant A | 9,356,407 | 594,869 |
| Events in quadrant B | 12,723,455 | 509,556 |
| Events in quadrant C | 13,970,792 | 404,612 |
| Events in quadrant D | 9,225,156 | 567,385 |
| Mode SS | |||
|---|---|---|---|
| Quadrant | BADHDUFLAG | Total packets | Discarded packets |
| A | 0 | 158 | 0 |
| B | 0 | 158 | 0 |
| C | 0 | 158 | 0 |
| D | 0 | 158 | 0 |
| Mode M0 | |||
|---|---|---|---|
| Quadrant | BADHDUFLAG | Total packets | Discarded packets |
| A | 0 | 33227 | 0 |
| B | 0 | 43352 | 0 |
| C | 0 | 46850 | 0 |
| D | 0 | 32904 | 0 |
| Quadrant | Total seconds | Saturated seconds | Saturation percentage |
|---|---|---|---|
| A | 7914 | 1993 | 25.183220% |
| B | 7914 | 3361 | 42.469042% |
| C | 7914 | 3843 | 48.559515% |
| D | 7915 | 1600 | 20.214782% |
Noise dominated data is calculated using 1-second bins in cleaned event files. If a bin has >2000 counts, and if more than 50% of those come from <1% of pixels, then it is considered to be noise-dominated and hence unusable.
| Quadrant | # 1 sec bins | Bins with >0 counts | Bins with >2000 counts | High rate bins dominated by noise | Noise dominated (total time) | Noise dominated (detector-on time) | Marked lightcurve |
|---|---|---|---|---|---|---|---|
| A | 7914 | 7914 | 1699 | 1699 | 21.47% | 21.47% | 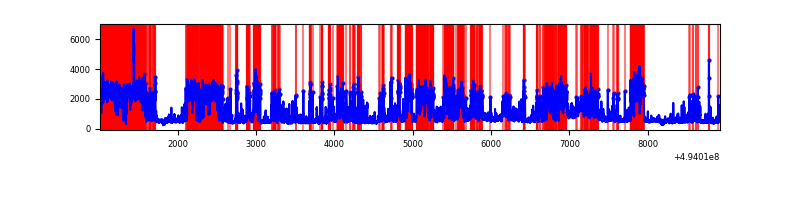 |
| B | 7914 | 7914 | 2618 | 2618 | 33.08% | 33.08% | 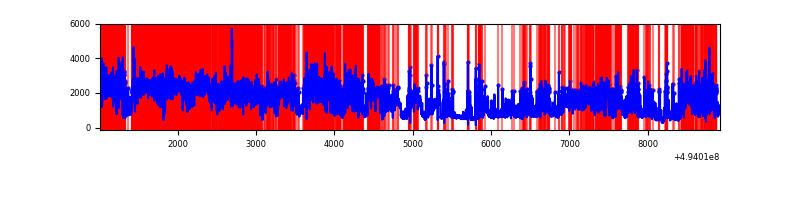 |
| C | 7914 | 7910 | 3458 | 3458 | 43.69% | 43.72% | 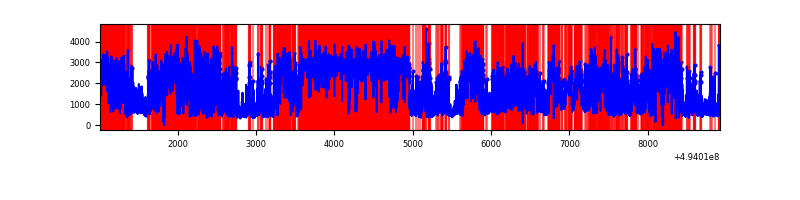 |
| D | 7915 | 7915 | 1485 | 1485 | 18.76% | 18.76% | 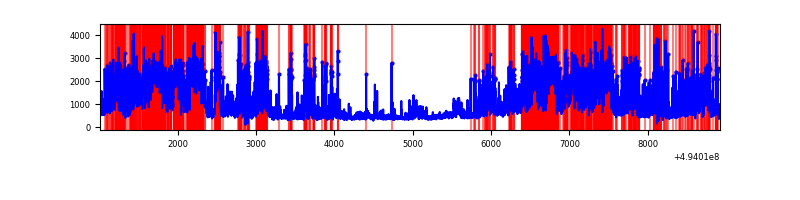 |
Top three noisy pixels from each quadrant. If the there are fewer than three noisy pixels in the level2.evt file, extra rows are filled as -1
| Pixel properties | Quadrant properties | ||||||
|---|---|---|---|---|---|---|---|
| Quadrant | DetID | PixID | Counts | Sigma | Mean | Median | Sigma |
| A | 3 | 78 | 4032900 | 20842.75 | 764 | 743 | 193.5 |
| A | 4 | 191 | 915225 | 4727.08 | 764 | 743 | 193.5 |
| A | 3 | 63 | 380923 | 1965.2 | 764 | 743 | 193.5 |
| B | 15 | 20 | 6724664 | 43500.99 | 717 | 693 | 154.6 |
| B | 4 | 206 | 1097304 | 7094.57 | 717 | 693 | 154.6 |
| B | 7 | 0 | 796152 | 5146.25 | 717 | 693 | 154.6 |
| C | 1 | 241 | 7079951 | 41177.45 | 612 | 607 | 171.9 |
| C | 15 | 224 | 2320212 | 13492.13 | 612 | 607 | 171.9 |
| C | 13 | 3 | 655679 | 3810.27 | 612 | 607 | 171.9 |
| D | 8 | 176 | 2503900 | 11198.7 | 774 | 741 | 223.5 |
| D | 10 | 172 | 1367307 | 6113.78 | 774 | 741 | 223.5 |
| D | 3 | 12 | 485635 | 2169.33 | 774 | 741 | 223.5 |
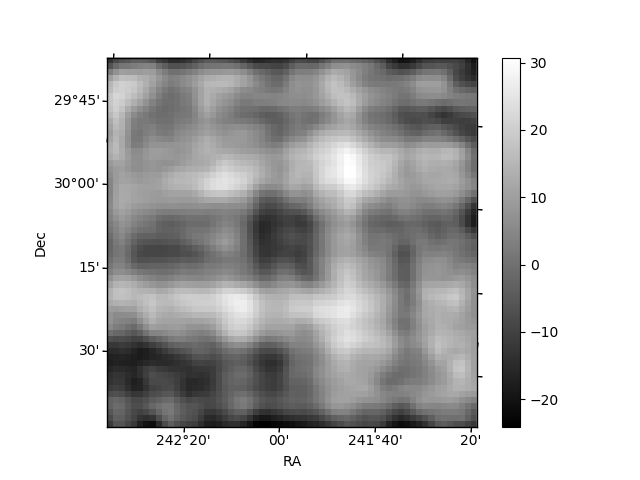
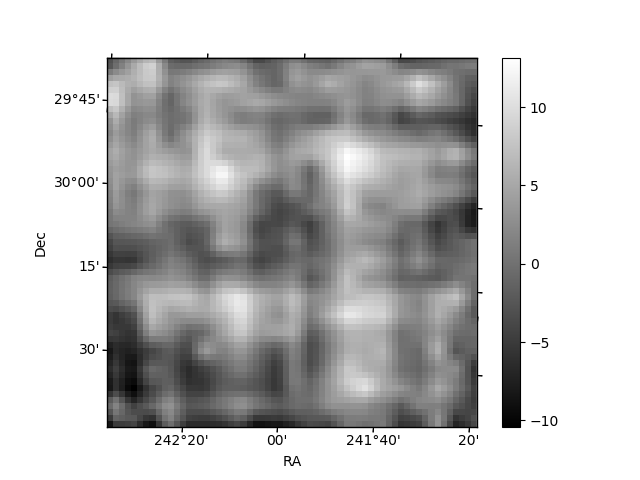
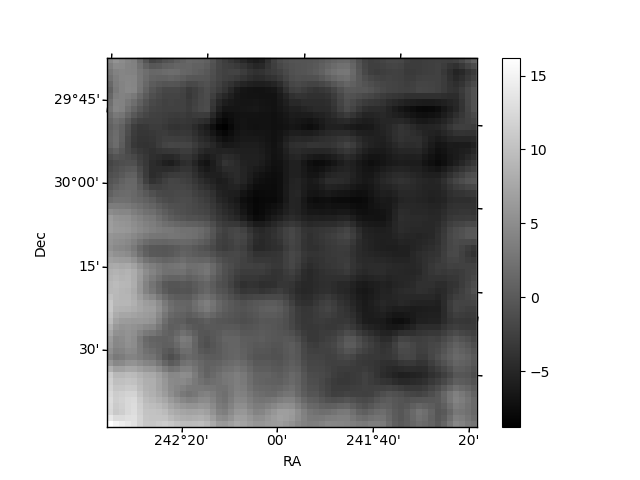
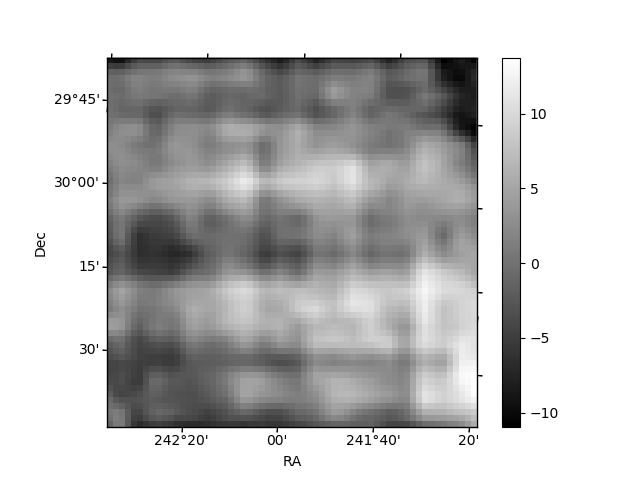
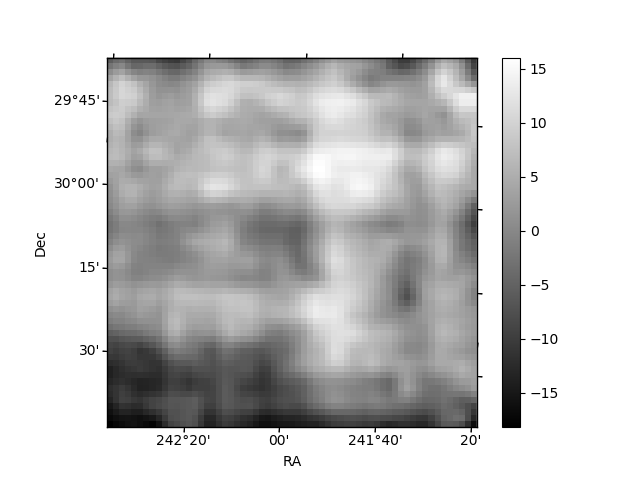
Histogram calculated using DETX and DETY for each event in the final _common_clean file
| Quadrant A | 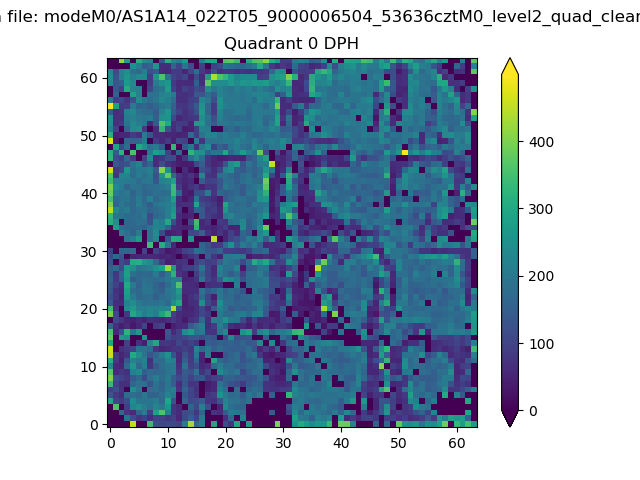 |
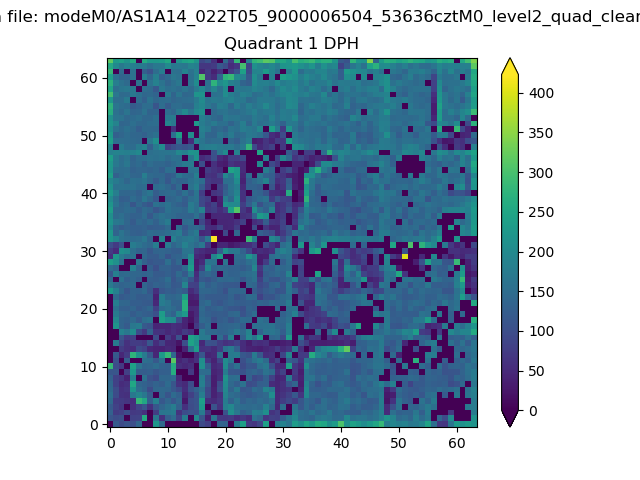 |
Quadrant B |
|---|---|---|---|
| Quadrant D | 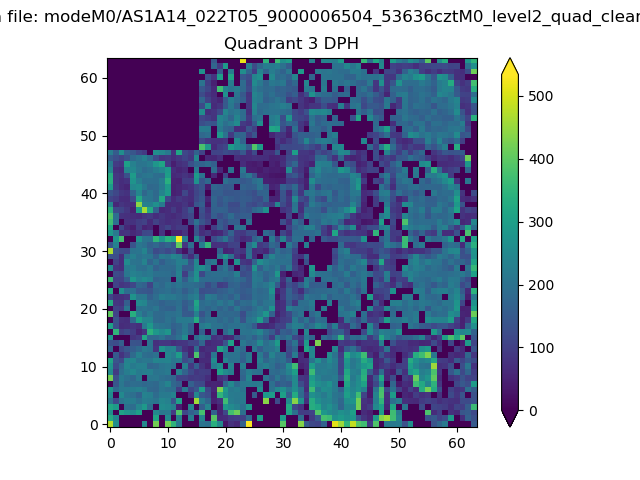 |
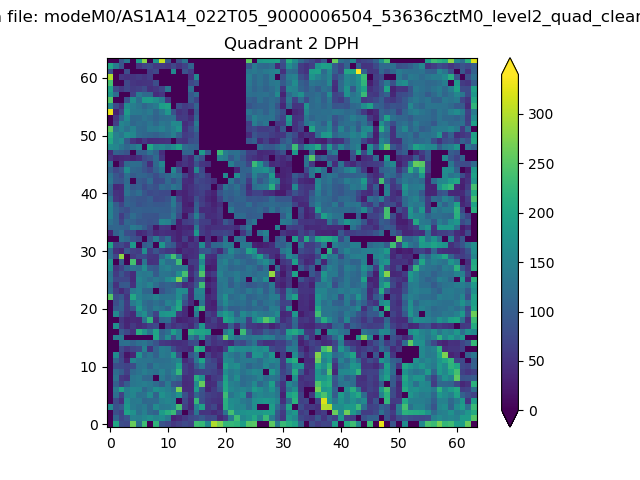 |
Quadrant C |
| Plot type | Count rate plots | Images |
|---|---|---|
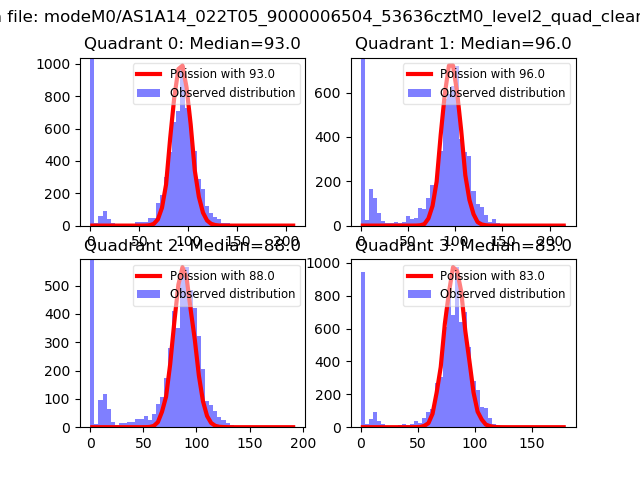
| Comparison with Poisson distribution Blue bars denote a histogram of data divided into 1 sec bins. Red curve is a Poisson curve with rate = median count rate of data. |
 |
 |
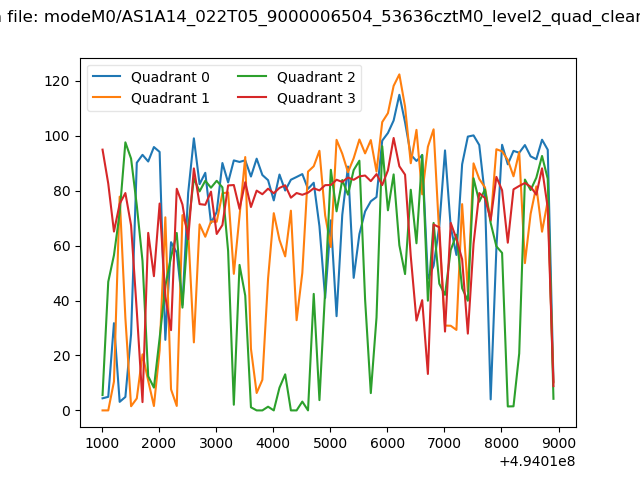
| Quadrant-wise count rates Data is divided into 100 sec bins |
 |
|
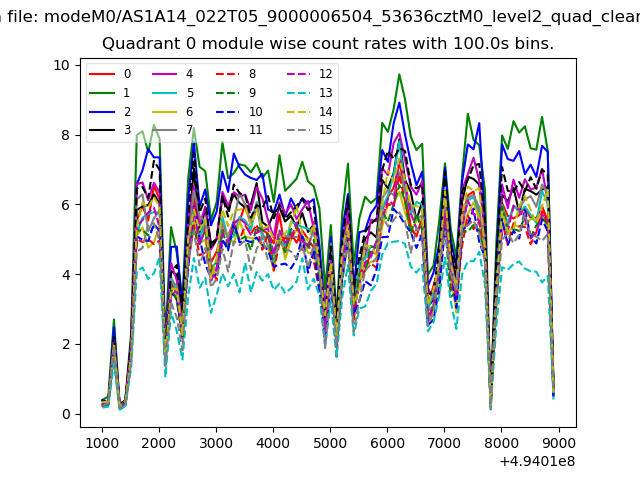
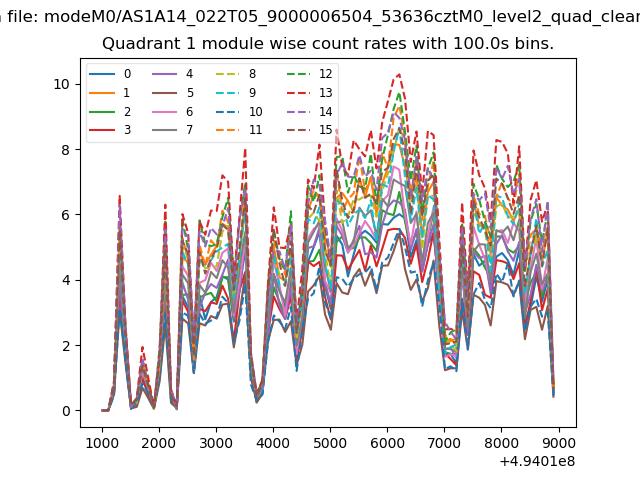
| Module-wise count rates for Quadrant A Data is divided into 100 sec bins |
 |
 |
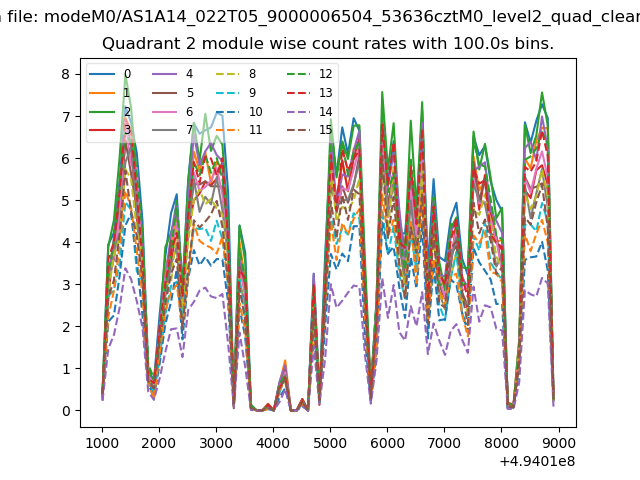
| Module-wise count rates for Quadrant B Data is divided into 100 sec bins |
 |
 |
| Module-wise count rates for Quadrant C Data is divided into 100 sec bins |
 |
 |
| Module-wise count rates for Quadrant D Data is divided into 100 sec bins |
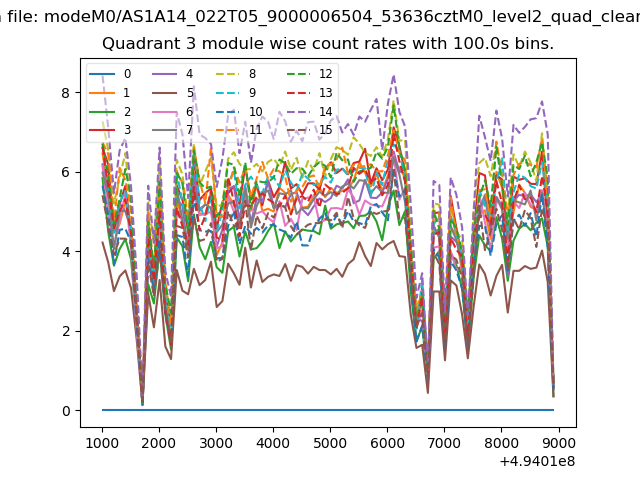 |
 |
| Parameter | Plot |
|---|---|
| CZT HV Monitor | 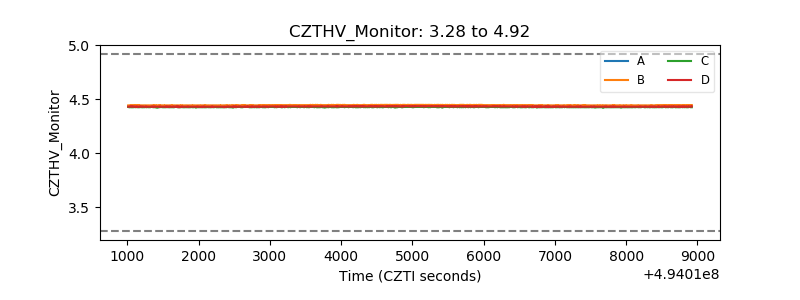 |
| D_VDD | 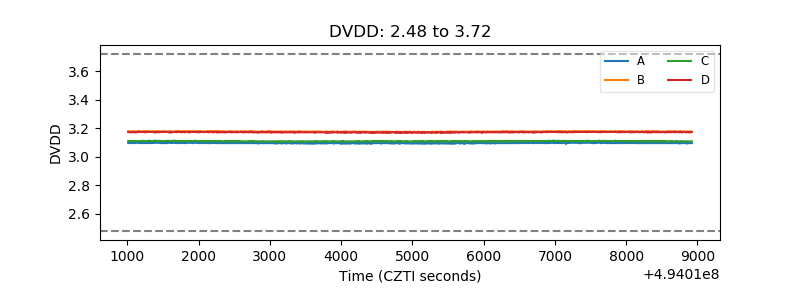 |
| Temperature 1 | 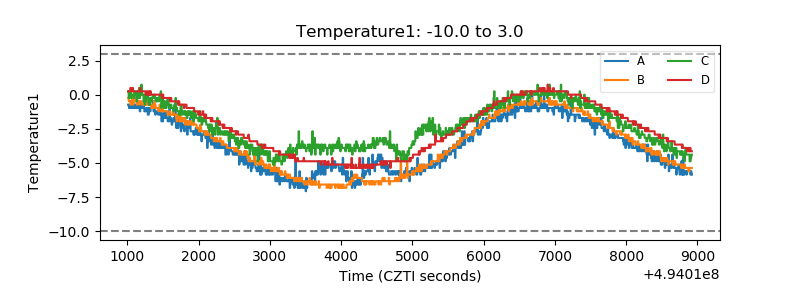 |
| Veto HV Monitor | 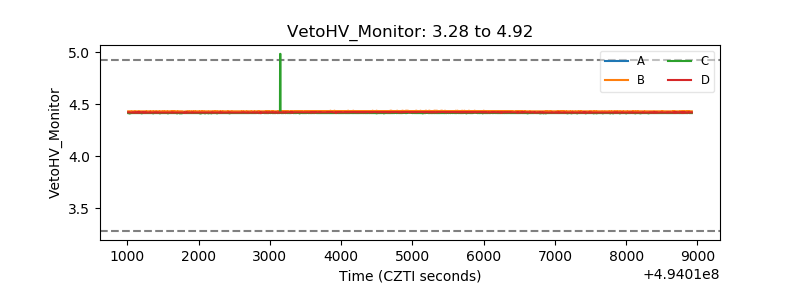 |
| Veto LLD | 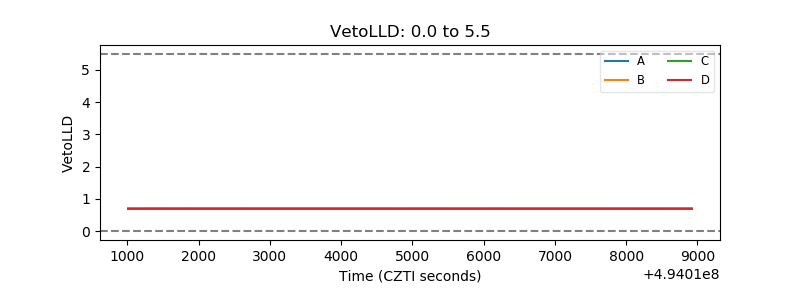 |
| Alpha Counter | 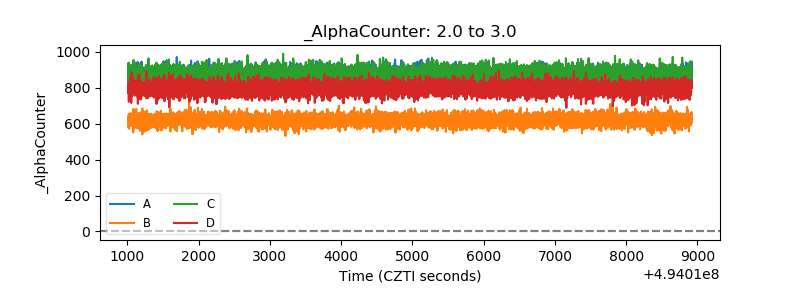 |
| _CPM_Rate | 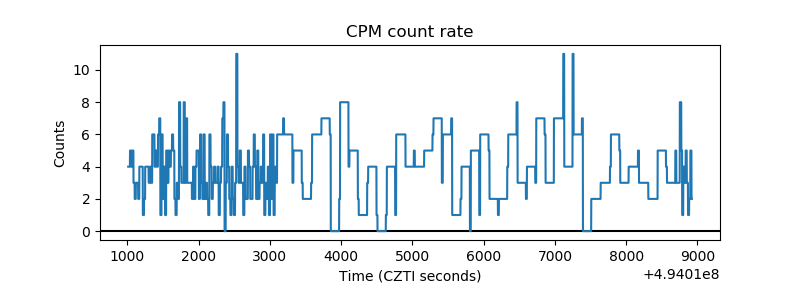 |
| CZT Counter | 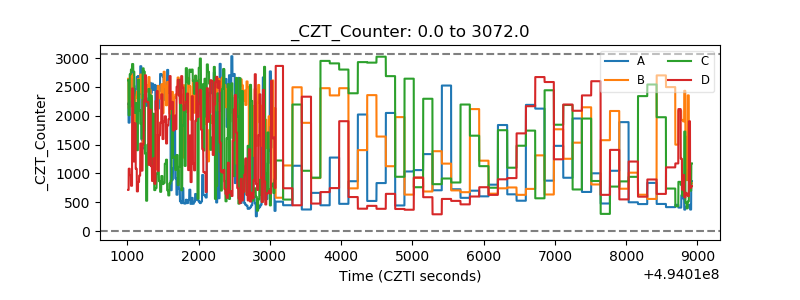 |
| +2.5 Volts monitor |  |
| +5 Volts monitor | 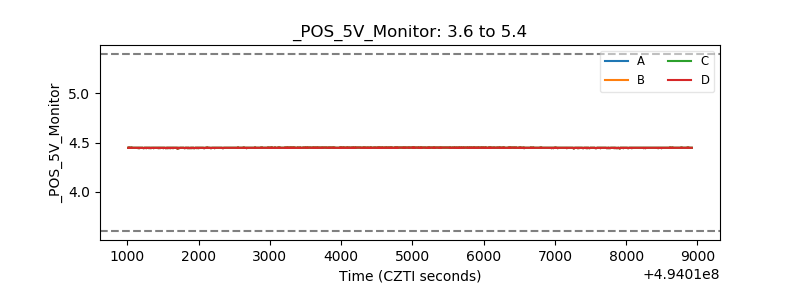 |
| _ROLL_ROT | 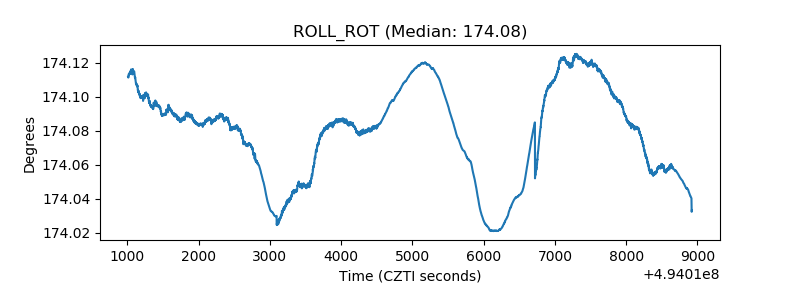 |
| _Roll_DEC | 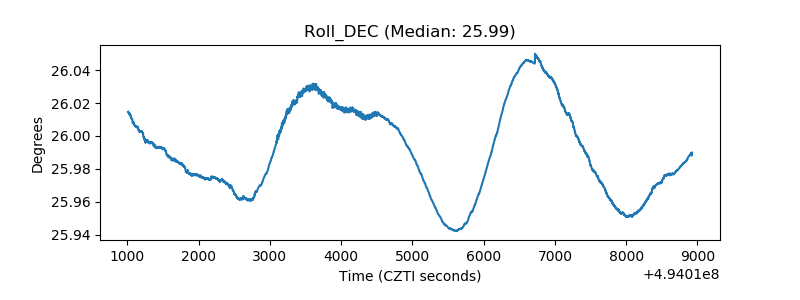 |
| _Roll_RA | 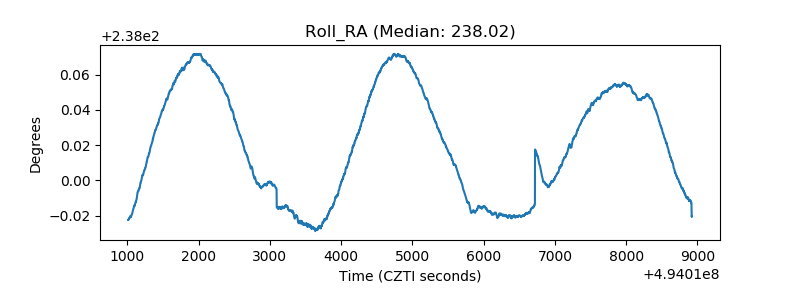 |
| Veto Counter | 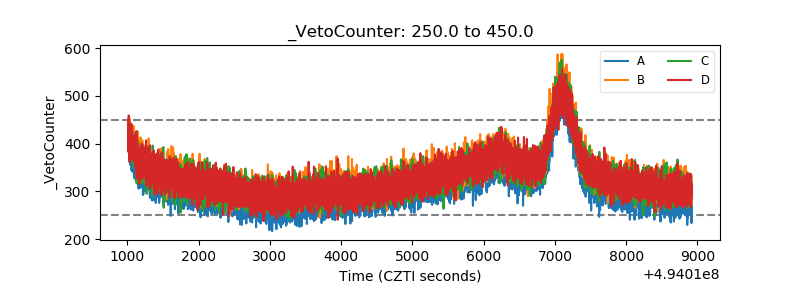 |