| Param | Original file | Final file |
|---|---|---|
| Filename | modeM0/AS1A14_022T05_9000006504_53643cztM0_level2.fits | modeM0/AS1A14_022T05_9000006504_53643cztM0_level2_quad_clean.evt |
| Size (bytes) | 1,061,026,560 | 76,835,520 |
| Size | 1011.9 MB | 73.3 MB |
| Events in quadrant A | 10,747,094 | 402,772 |
| Events in quadrant B | 6,485,136 | 645,637 |
| Events in quadrant C | 11,850,505 | 337,847 |
| Events in quadrant D | 9,677,566 | 473,283 |
| Mode SS | |||
|---|---|---|---|
| Quadrant | BADHDUFLAG | Total packets | Discarded packets |
| A | 0 | 138 | 0 |
| B | 0 | 138 | 0 |
| C | 0 | 138 | 0 |
| D | 0 | 138 | 0 |
| Mode M9 | |||
|---|---|---|---|
| Quadrant | BADHDUFLAG | Total packets | Discarded packets |
| A | 0 | 21 | 0 |
| B | 0 | 21 | 0 |
| C | 0 | 21 | 0 |
| D | 0 | 21 | 0 |
| Mode M0 | |||
|---|---|---|---|
| Quadrant | BADHDUFLAG | Total packets | Discarded packets |
| A | 0 | 36543 | 2 |
| B | 0 | 23772 | 2 |
| C | 0 | 39692 | 2 |
| D | 0 | 33394 | 2 |
| Quadrant | Total seconds | Saturated seconds | Saturation percentage |
|---|---|---|---|
| A | 6690 | 2945 | 44.020927% |
| B | 6690 | 1021 | 15.261584% |
| C | 6690 | 3450 | 51.569507% |
| D | 6690 | 1757 | 26.263079% |
Noise dominated data is calculated using 1-second bins in cleaned event files. If a bin has >2000 counts, and if more than 50% of those come from <1% of pixels, then it is considered to be noise-dominated and hence unusable.
| Quadrant | # 1 sec bins | Bins with >0 counts | Bins with >2000 counts | High rate bins dominated by noise | Noise dominated (total time) | Noise dominated (detector-on time) | Marked lightcurve |
|---|---|---|---|---|---|---|---|
| A | 8821 | 6678 | 2611 | 2611 | 29.60% | 39.10% | 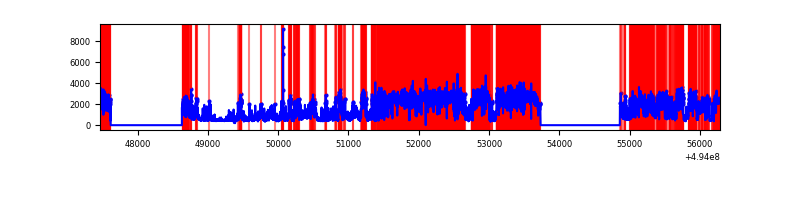 |
| B | 8822 | 6678 | 637 | 637 | 7.22% | 9.54% | 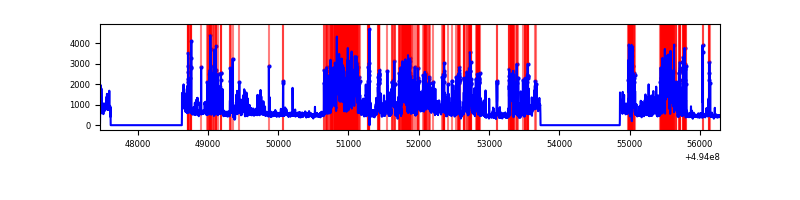 |
| C | 8822 | 6675 | 3035 | 3035 | 34.40% | 45.47% | 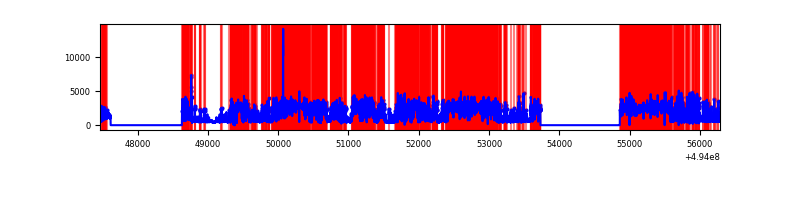 |
| D | 8822 | 6679 | 1549 | 1549 | 17.56% | 23.19% | 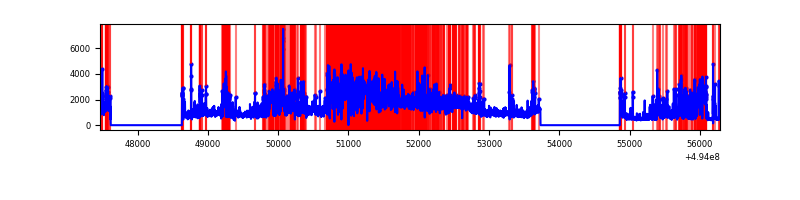 |
Top three noisy pixels from each quadrant. If the there are fewer than three noisy pixels in the level2.evt file, extra rows are filled as -1
| Pixel properties | Quadrant properties | ||||||
|---|---|---|---|---|---|---|---|
| Quadrant | DetID | PixID | Counts | Sigma | Mean | Median | Sigma |
| A | 3 | 78 | 6701214 | 45012.9 | 603 | 590 | 148.9 |
| A | 15 | 174 | 745954 | 5007.15 | 603 | 590 | 148.9 |
| A | 4 | 95 | 273142 | 1830.93 | 603 | 590 | 148.9 |
| B | 4 | 206 | 2063571 | 13175.16 | 728 | 703 | 156.6 |
| B | 5 | 172 | 573553 | 3658.69 | 728 | 703 | 156.6 |
| B | 7 | 0 | 478501 | 3051.61 | 728 | 703 | 156.6 |
| C | 1 | 241 | 7298871 | 48548.23 | 533 | 526 | 150.3 |
| C | 15 | 224 | 1892342 | 12584.27 | 533 | 526 | 150.3 |
| C | 13 | 3 | 260150 | 1727.01 | 533 | 526 | 150.3 |
| D | 8 | 176 | 3524622 | 18862.17 | 654 | 627 | 186.8 |
| D | 10 | 172 | 2733288 | 14626.56 | 654 | 627 | 186.8 |
| D | 13 | 153 | 158185 | 843.33 | 654 | 627 | 186.8 |
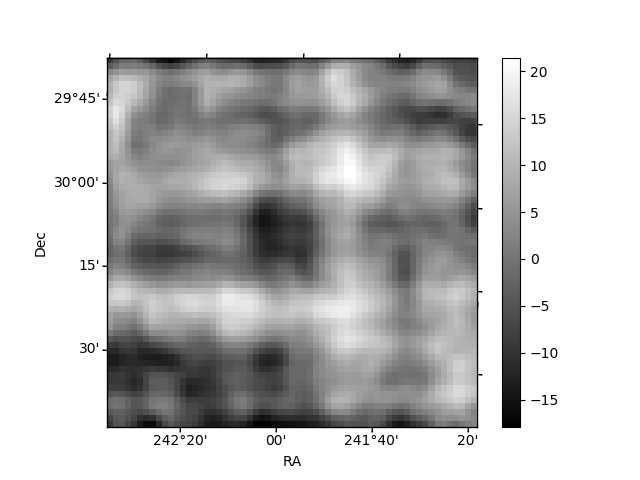
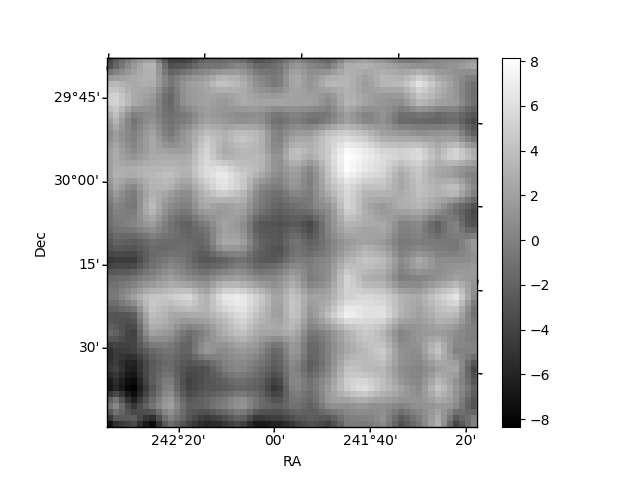
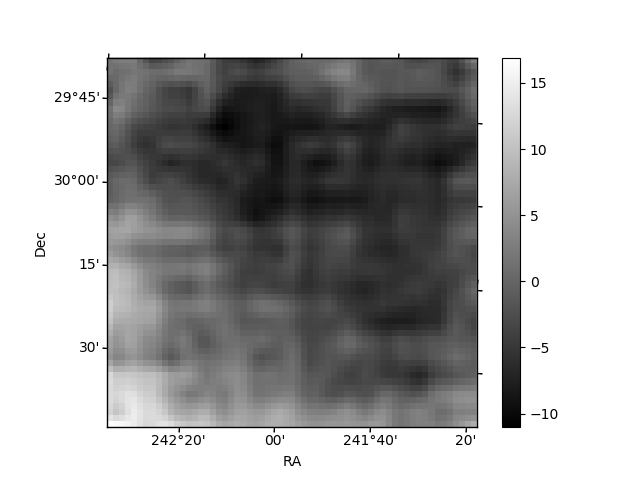
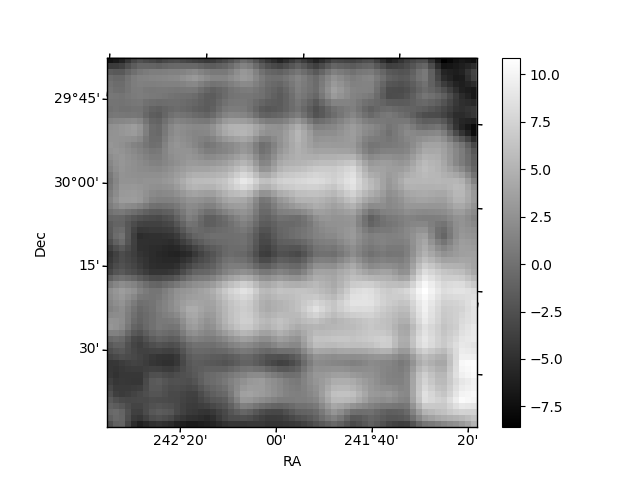
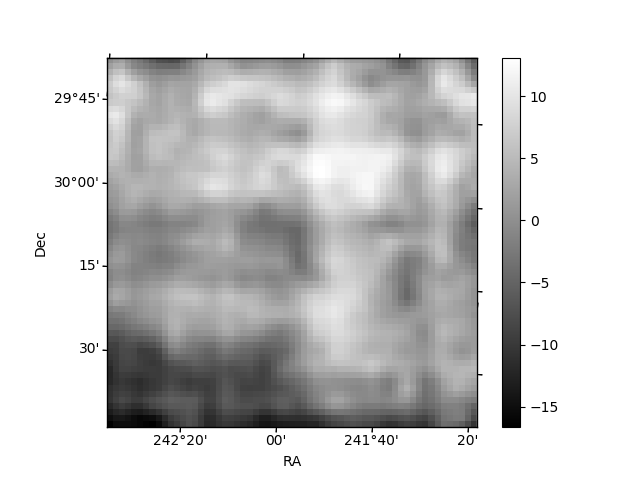
Histogram calculated using DETX and DETY for each event in the final _common_clean file
| Quadrant A | 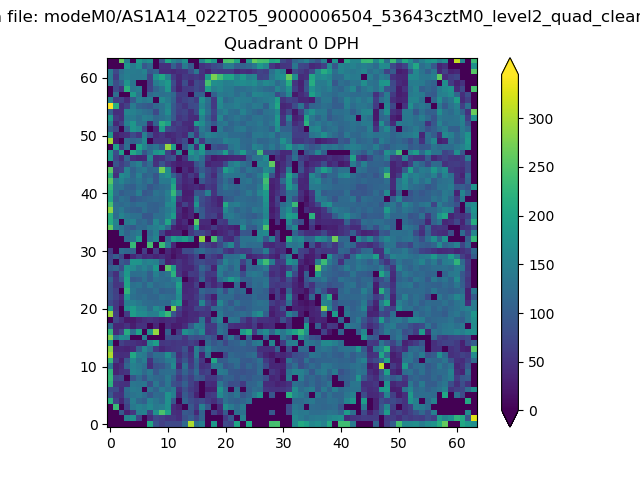 |
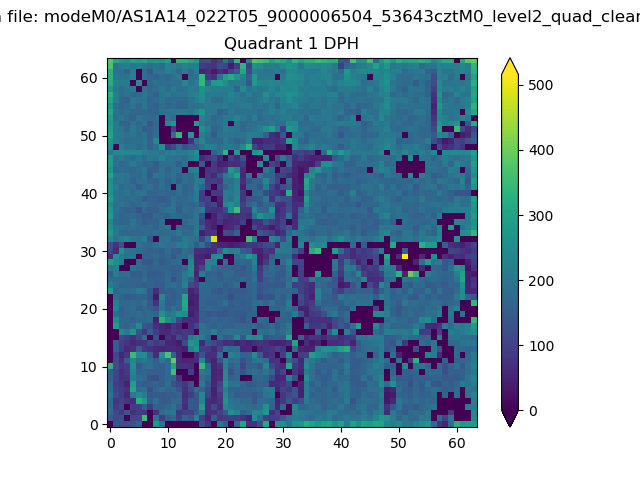 |
Quadrant B |
|---|---|---|---|
| Quadrant D | 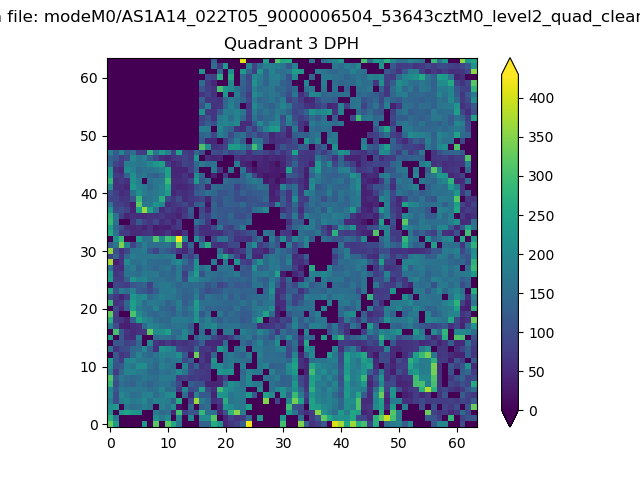 |
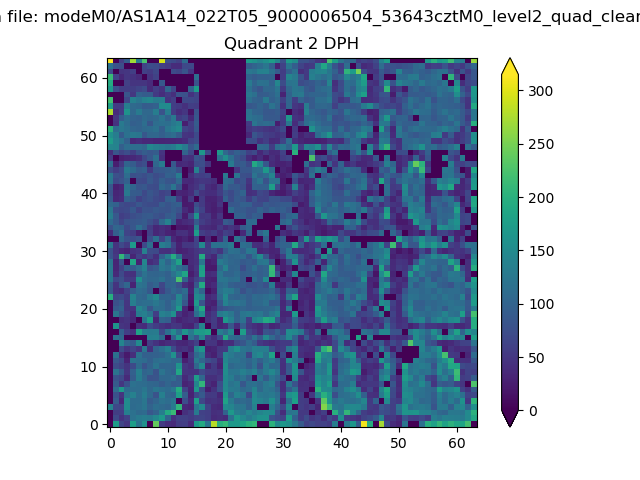 |
Quadrant C |
| Plot type | Count rate plots | Images |
|---|---|---|
| Comparison with Poisson distribution Blue bars denote a histogram of data divided into 1 sec bins. Red curve is a Poisson curve with rate = median count rate of data. |
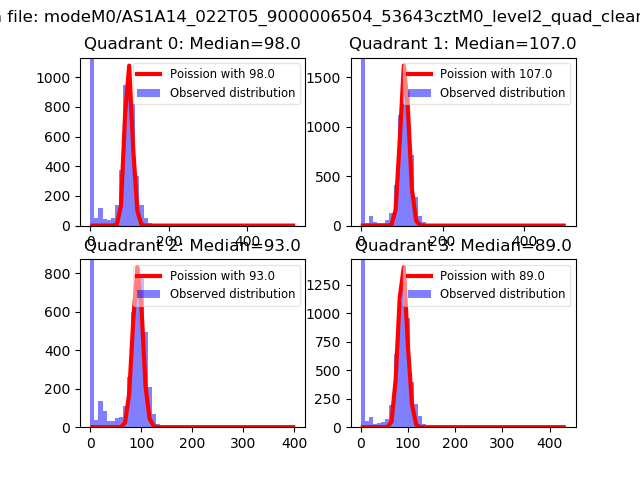 |
 |
| Quadrant-wise count rates Data is divided into 100 sec bins |
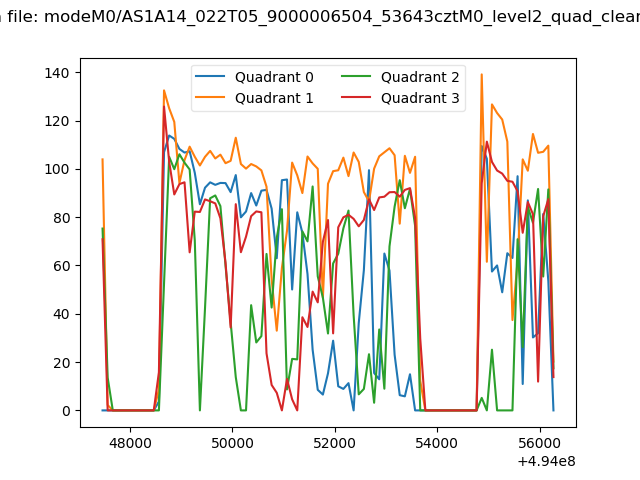 |
|
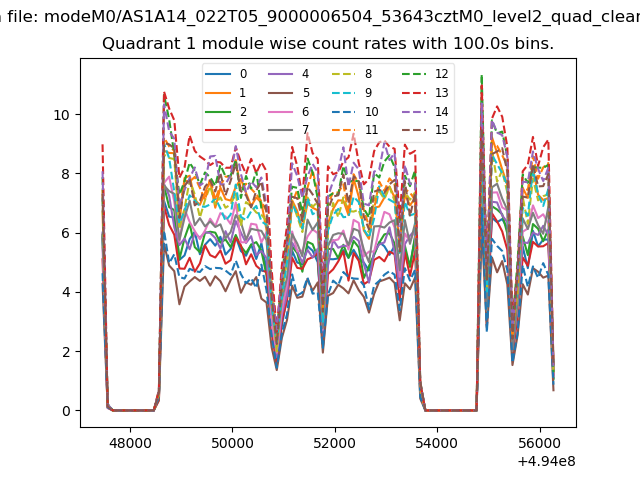
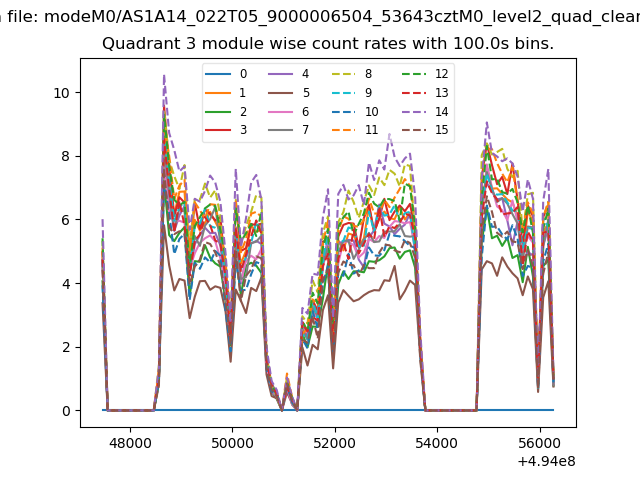
| Module-wise count rates for Quadrant A Data is divided into 100 sec bins |
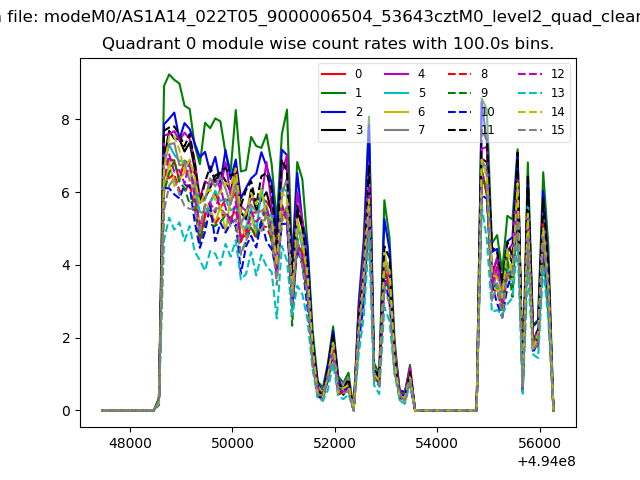 |
 |
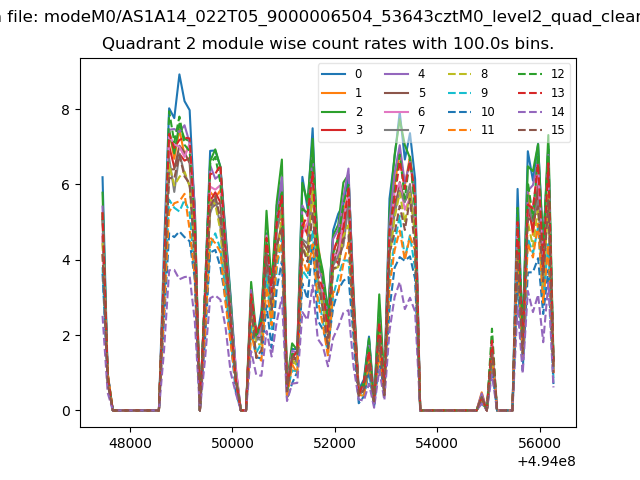
| Module-wise count rates for Quadrant B Data is divided into 100 sec bins |
 |
 |
| Module-wise count rates for Quadrant C Data is divided into 100 sec bins |
 |
 |
| Module-wise count rates for Quadrant D Data is divided into 100 sec bins |
 |
 |
| Parameter | Plot |
|---|---|
| CZT HV Monitor | 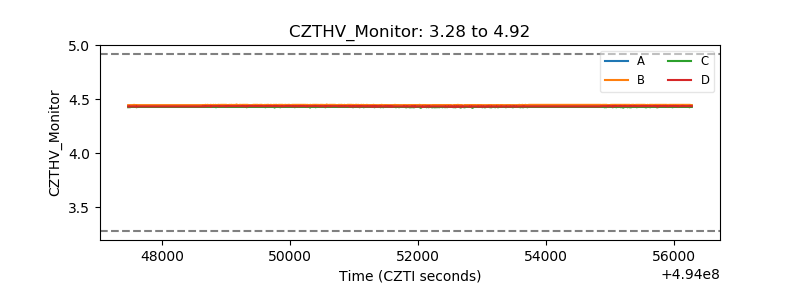 |
| D_VDD | 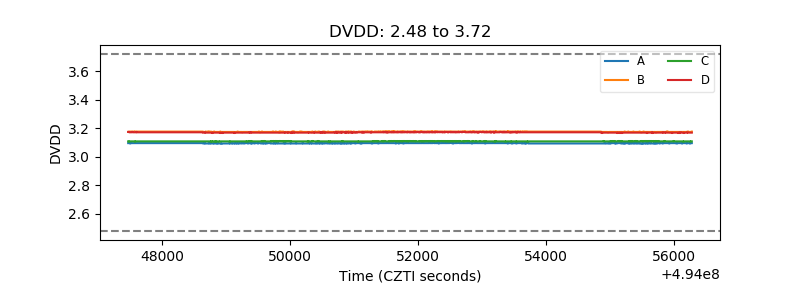 |
| Temperature 1 | 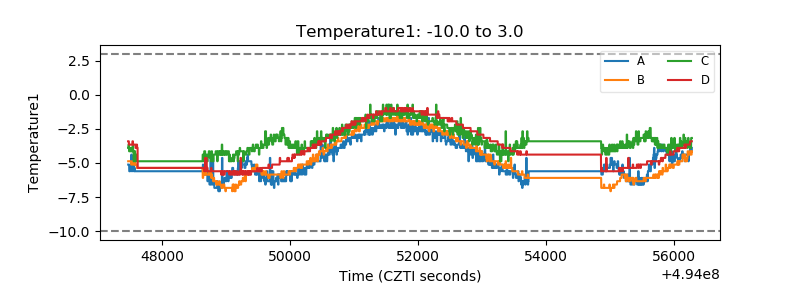 |
| Veto HV Monitor | 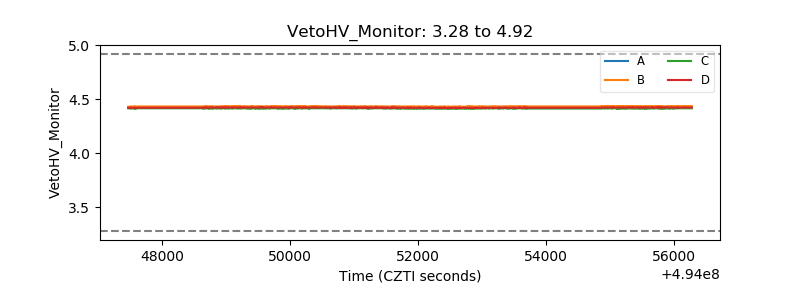 |
| Veto LLD | 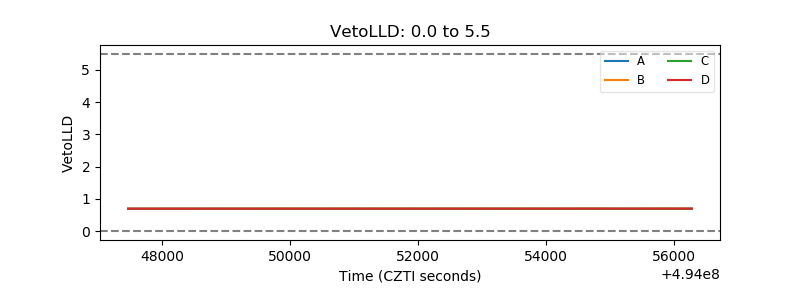 |
| Alpha Counter | 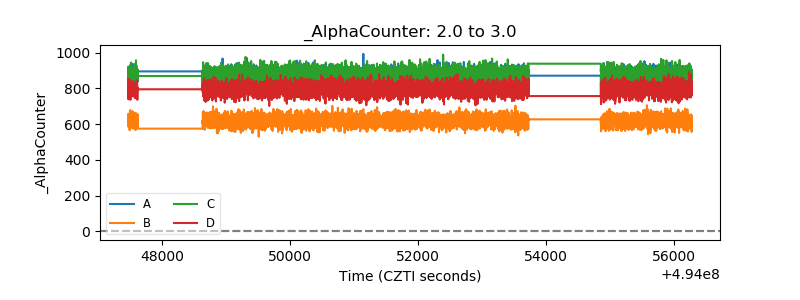 |
| _CPM_Rate | 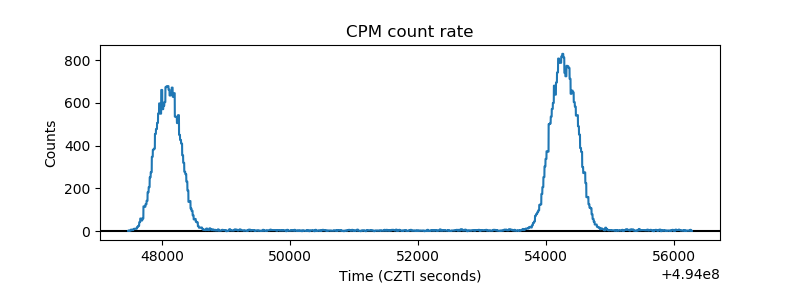 |
| CZT Counter | 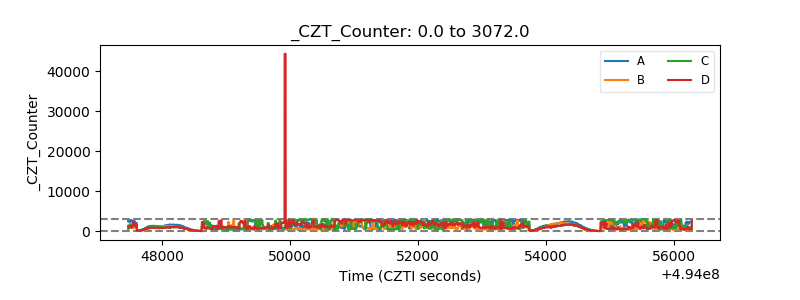 |
| +2.5 Volts monitor |  |
| +5 Volts monitor |  |
| _ROLL_ROT | 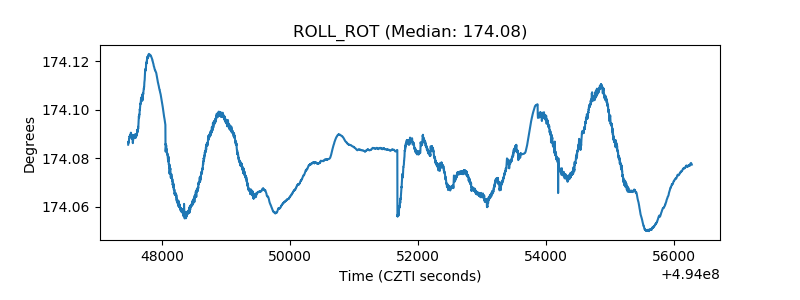 |
| _Roll_DEC | 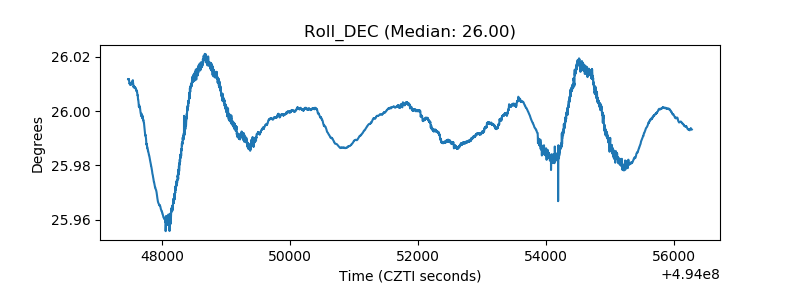 |
| _Roll_RA | 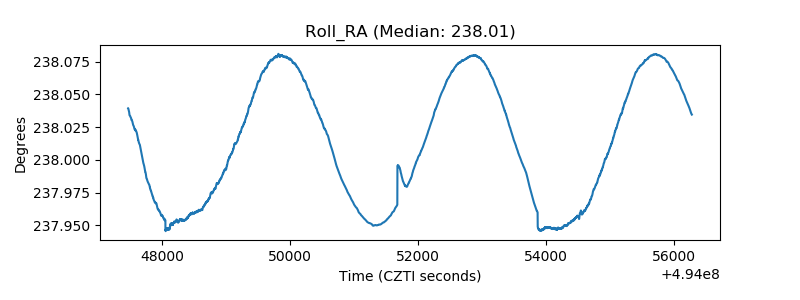 |
| Veto Counter | 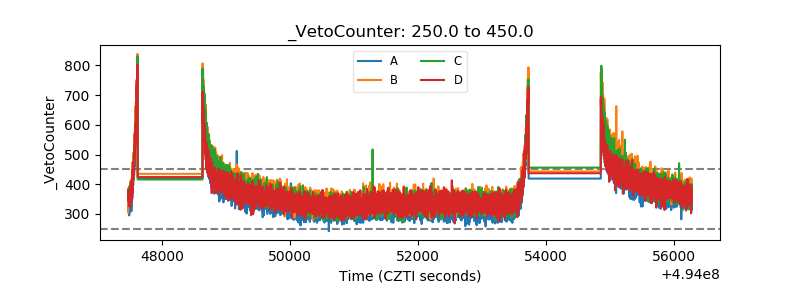 |