| Param | Original file | Final file |
|---|---|---|
| Filename | modeM0/AS1A14_022T05_9000006504_53644cztM0_level2.fits | modeM0/AS1A14_022T05_9000006504_53644cztM0_level2_quad_clean.evt |
| Size (bytes) | 885,620,160 | 82,247,040 |
| Size | 844.6 MB | 78.4 MB |
| Events in quadrant A | 8,277,332 | 525,537 |
| Events in quadrant B | 5,649,474 | 652,563 |
| Events in quadrant C | 11,798,630 | 320,692 |
| Events in quadrant D | 6,557,731 | 540,480 |
| Mode SS | |||
|---|---|---|---|
| Quadrant | BADHDUFLAG | Total packets | Discarded packets |
| A | 0 | 130 | 0 |
| B | 0 | 130 | 0 |
| C | 0 | 130 | 0 |
| D | 0 | 130 | 0 |
| Mode M9 | |||
|---|---|---|---|
| Quadrant | BADHDUFLAG | Total packets | Discarded packets |
| A | 0 | 14 | 0 |
| B | 0 | 15 | 0 |
| C | 0 | 15 | 0 |
| D | 0 | 15 | 0 |
| Mode M0 | |||
|---|---|---|---|
| Quadrant | BADHDUFLAG | Total packets | Discarded packets |
| A | 0 | 29001 | 2 |
| B | 0 | 21099 | 2 |
| C | 0 | 39372 | 2 |
| D | 0 | 23829 | 2 |
| Quadrant | Total seconds | Saturated seconds | Saturation percentage |
|---|---|---|---|
| A | 6467 | 1742 | 26.936756% |
| B | 6467 | 866 | 13.391062% |
| C | 6467 | 3459 | 53.486934% |
| D | 6467 | 870 | 13.452915% |
Noise dominated data is calculated using 1-second bins in cleaned event files. If a bin has >2000 counts, and if more than 50% of those come from <1% of pixels, then it is considered to be noise-dominated and hence unusable.
| Quadrant | # 1 sec bins | Bins with >0 counts | Bins with >2000 counts | High rate bins dominated by noise | Noise dominated (total time) | Noise dominated (detector-on time) | Marked lightcurve |
|---|---|---|---|---|---|---|---|
| A | 7637 | 6468 | 1396 | 1396 | 18.28% | 21.58% | 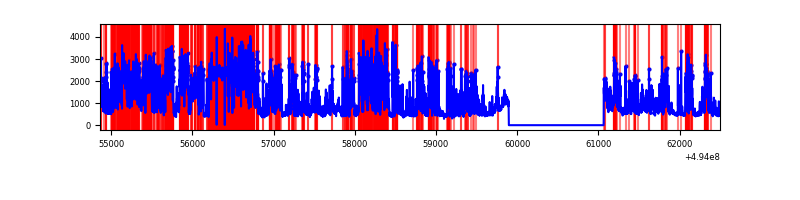 |
| B | 7637 | 6467 | 503 | 503 | 6.59% | 7.78% | 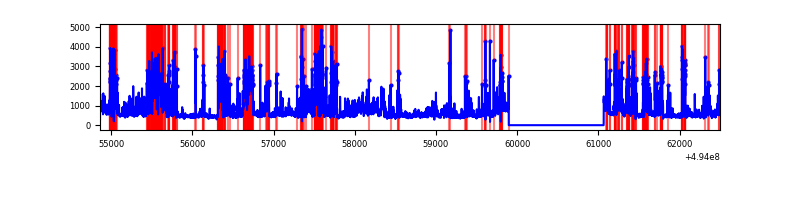 |
| C | 7637 | 6467 | 3036 | 3036 | 39.75% | 46.95% | 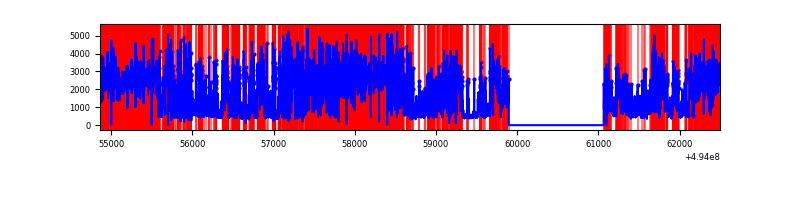 |
| D | 7637 | 6468 | 761 | 761 | 9.96% | 11.77% | 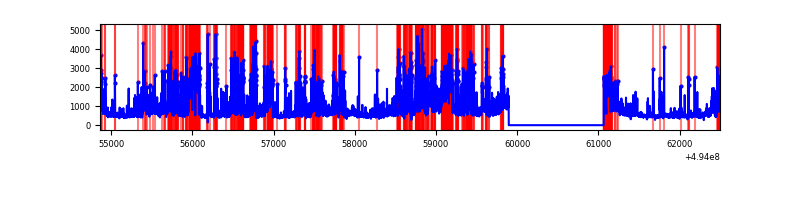 |
Top three noisy pixels from each quadrant. If the there are fewer than three noisy pixels in the level2.evt file, extra rows are filled as -1
| Pixel properties | Quadrant properties | ||||||
|---|---|---|---|---|---|---|---|
| Quadrant | DetID | PixID | Counts | Sigma | Mean | Median | Sigma |
| A | 3 | 78 | 2864217 | 17256.04 | 673 | 656 | 165.9 |
| A | 15 | 174 | 1308154 | 7879.08 | 673 | 656 | 165.9 |
| A | 4 | 191 | 560363 | 3372.84 | 673 | 656 | 165.9 |
| B | 4 | 206 | 1459528 | 9647.14 | 709 | 685 | 151.2 |
| B | 5 | 172 | 665003 | 4393.05 | 709 | 685 | 151.2 |
| B | 5 | 185 | 322017 | 2124.93 | 709 | 685 | 151.2 |
| C | 1 | 241 | 7878489 | 56014.25 | 500 | 496 | 140.6 |
| C | 15 | 224 | 1203325 | 8552.38 | 500 | 496 | 140.6 |
| C | 13 | 49 | 329079 | 2336.3 | 500 | 496 | 140.6 |
| D | 8 | 176 | 1546933 | 7947.77 | 685 | 655 | 194.6 |
| D | 3 | 224 | 1185512 | 6090.09 | 685 | 655 | 194.6 |
| D | 10 | 172 | 546521 | 2805.72 | 685 | 655 | 194.6 |
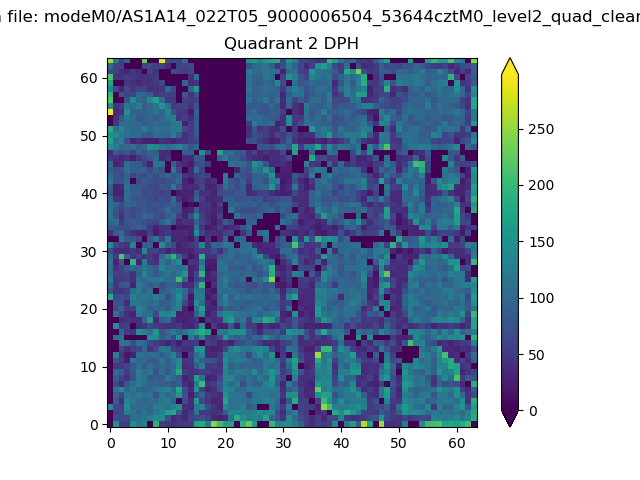
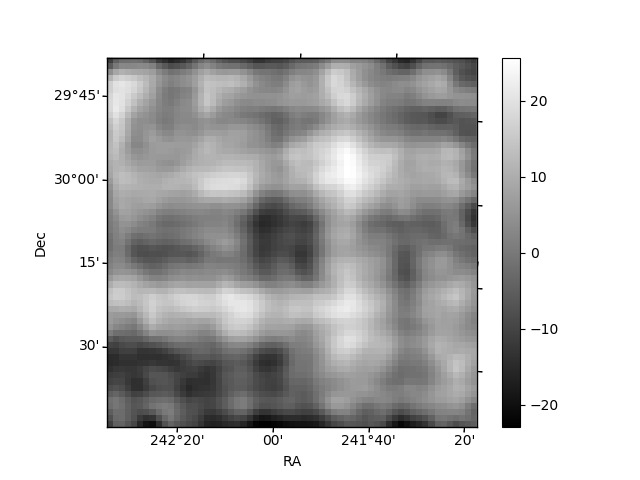
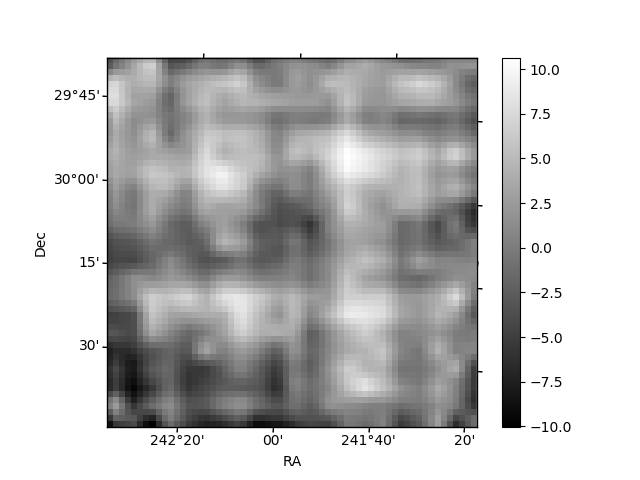
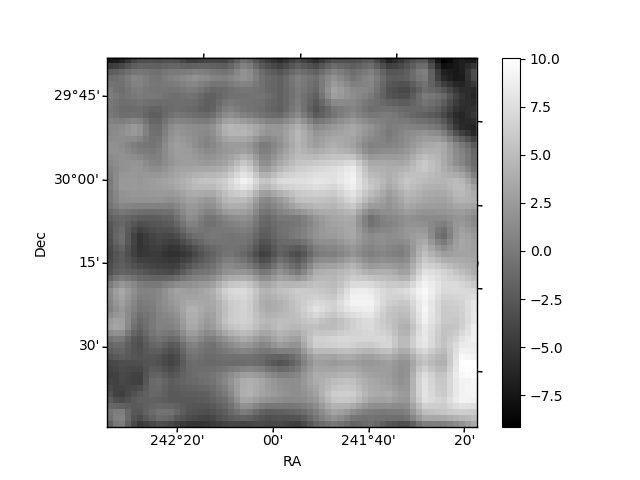
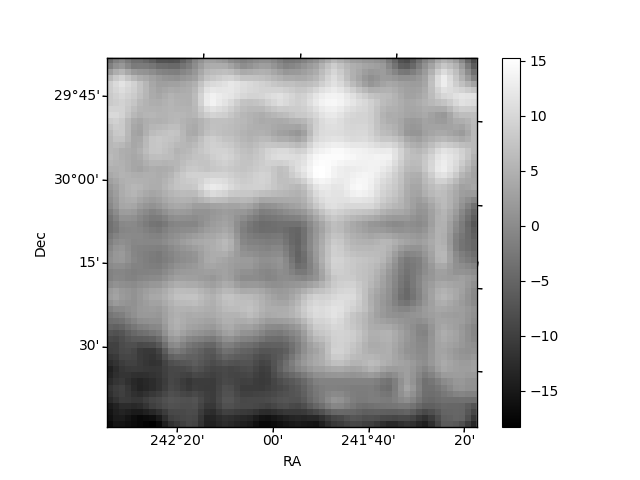
Histogram calculated using DETX and DETY for each event in the final _common_clean file
| Quadrant A | 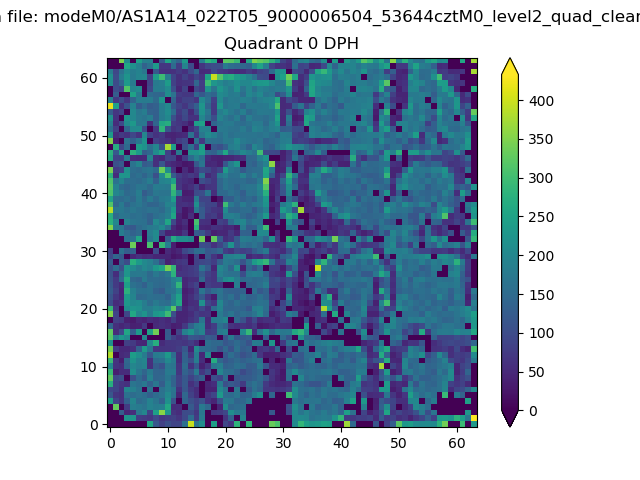 |
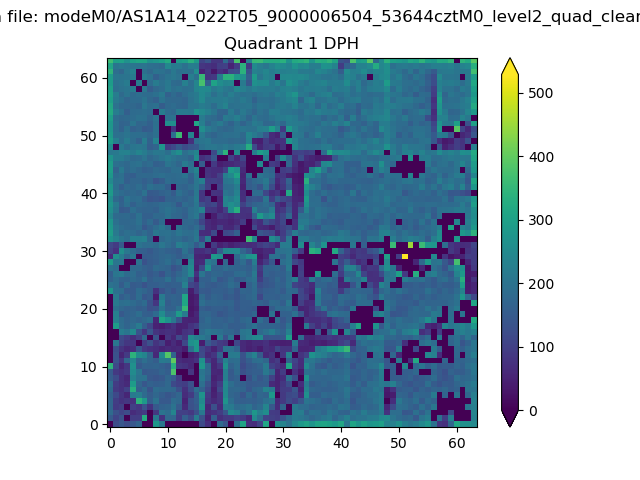 |
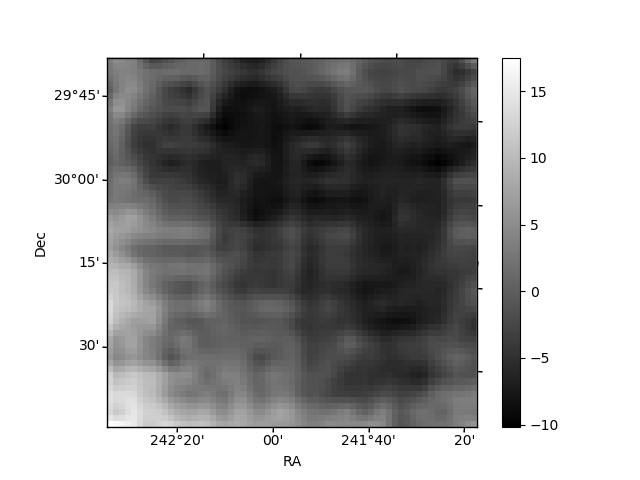
Quadrant B |
|---|---|---|---|
| Quadrant D | 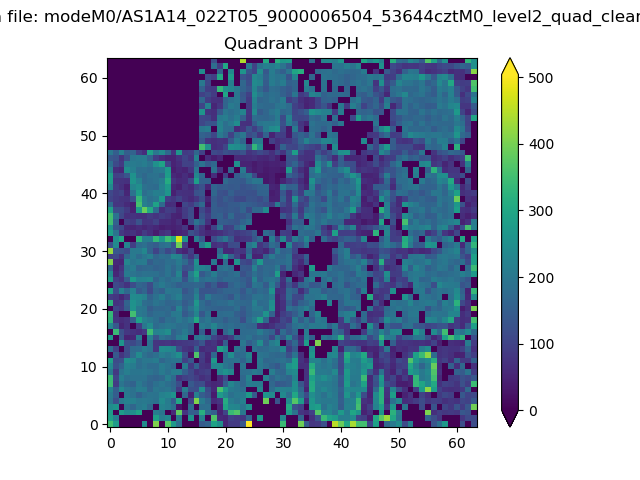 |
 |
Quadrant C |
| Plot type | Count rate plots | Images |
|---|---|---|
| Comparison with Poisson distribution Blue bars denote a histogram of data divided into 1 sec bins. Red curve is a Poisson curve with rate = median count rate of data. |
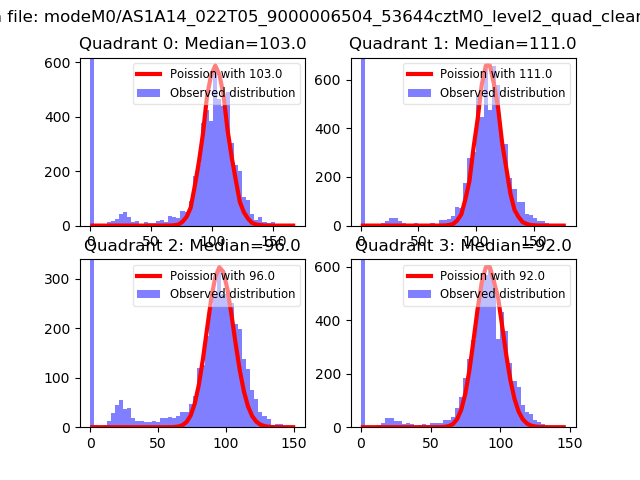 |
 |
| Quadrant-wise count rates Data is divided into 100 sec bins |
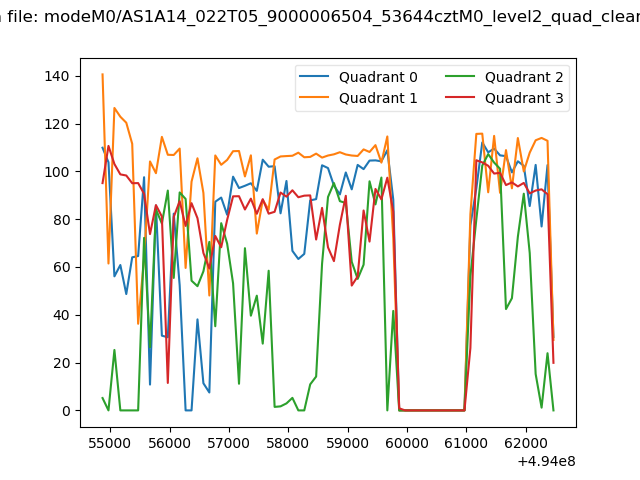 |
|
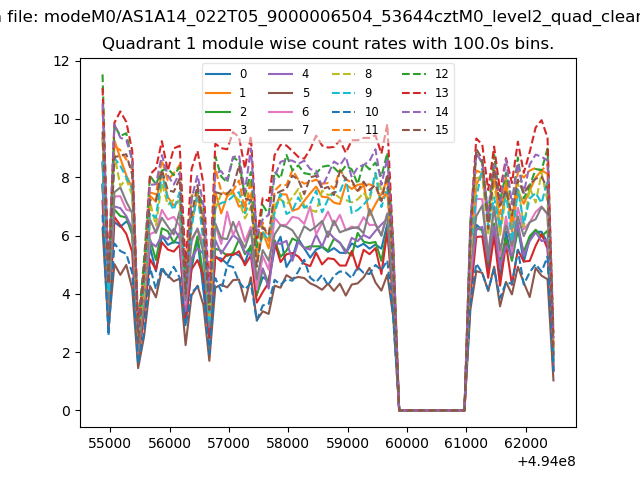
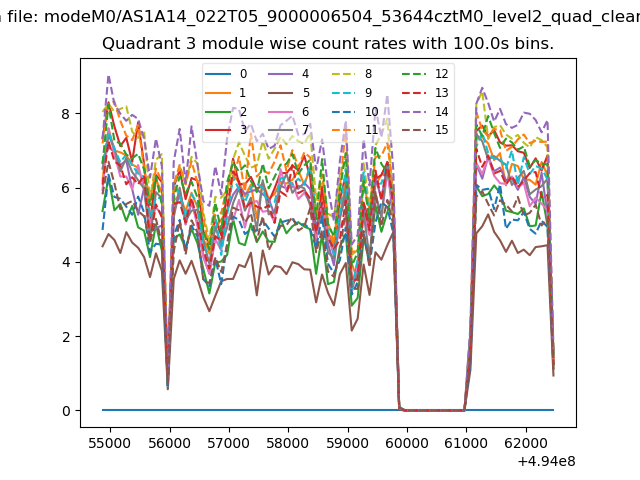
| Module-wise count rates for Quadrant A Data is divided into 100 sec bins |
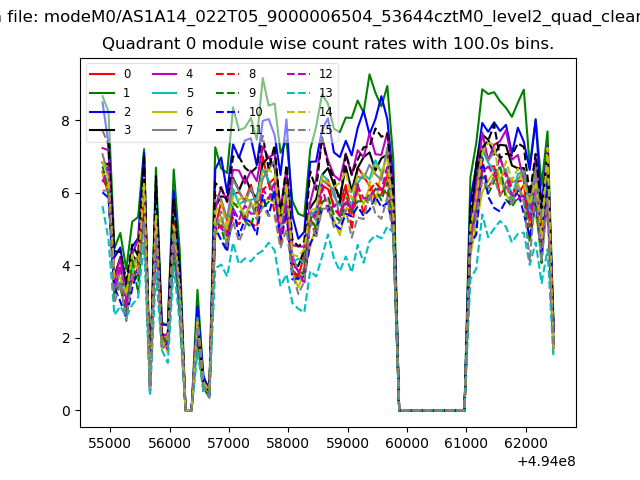 |
 |
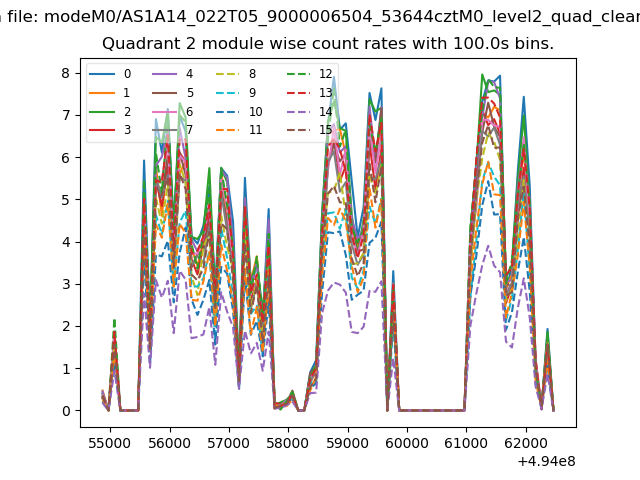
| Module-wise count rates for Quadrant B Data is divided into 100 sec bins |
 |
 |
| Module-wise count rates for Quadrant C Data is divided into 100 sec bins |
 |
 |
| Module-wise count rates for Quadrant D Data is divided into 100 sec bins |
 |
 |
| Parameter | Plot |
|---|---|
| CZT HV Monitor | 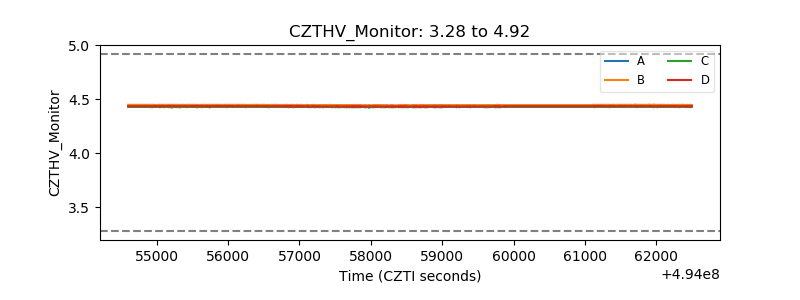 |
| D_VDD | 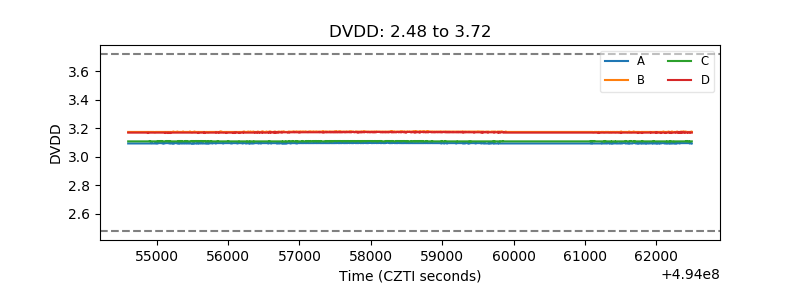 |
| Temperature 1 | 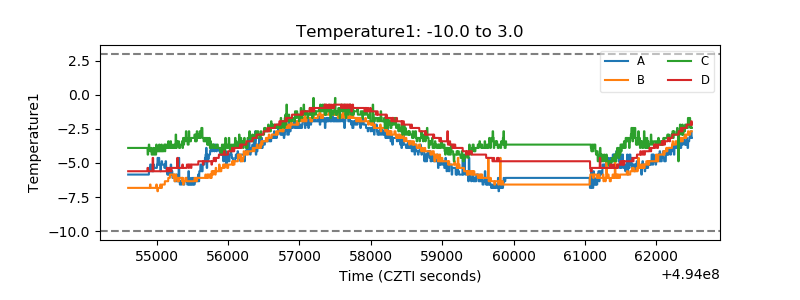 |
| Veto HV Monitor | 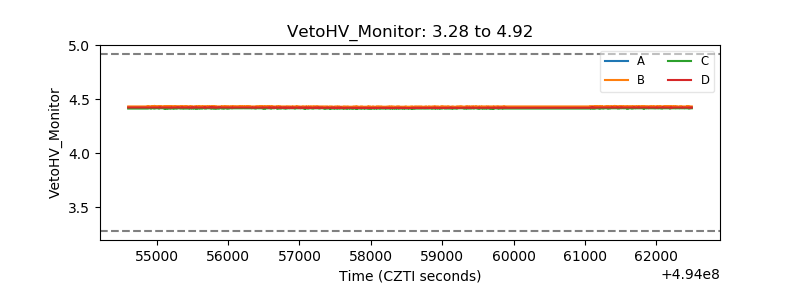 |
| Veto LLD | 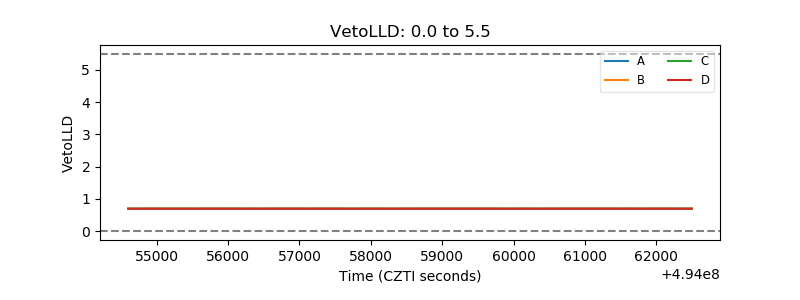 |
| Alpha Counter | 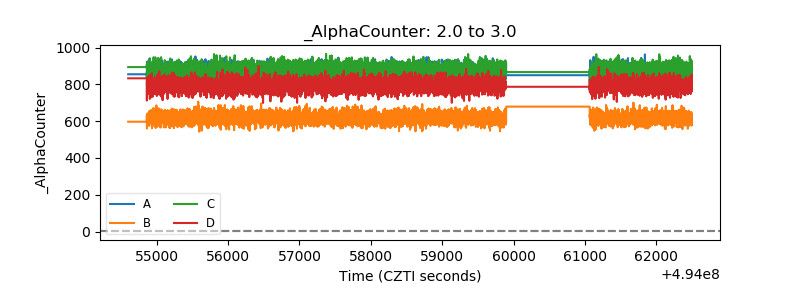 |
| _CPM_Rate | 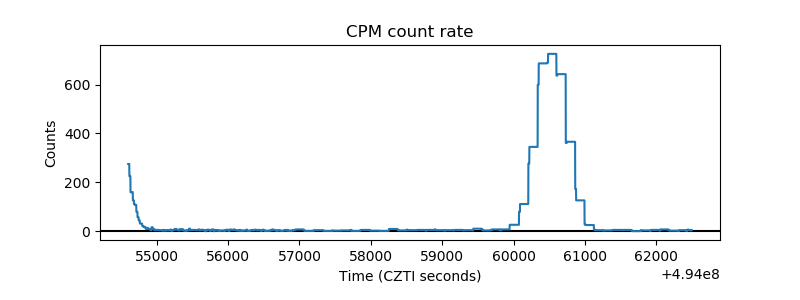 |
| CZT Counter | 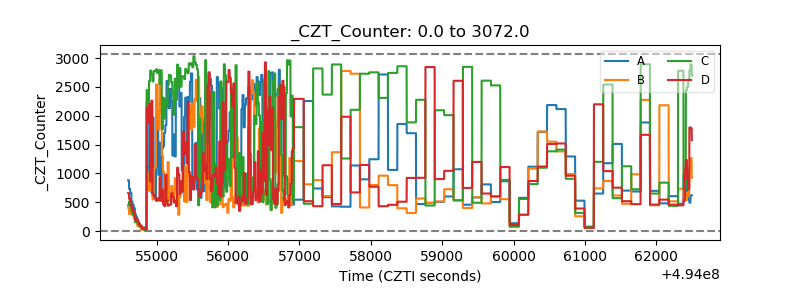 |
| +2.5 Volts monitor |  |
| +5 Volts monitor | 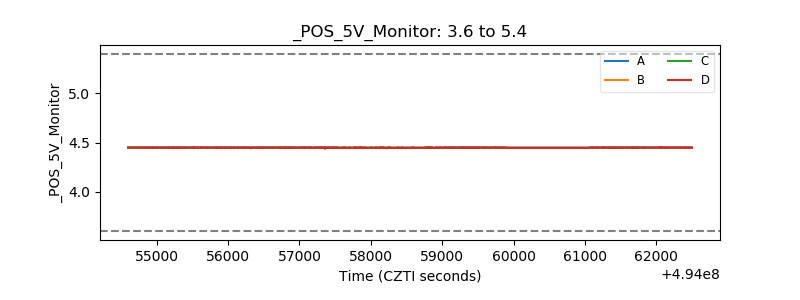 |
| _ROLL_ROT | 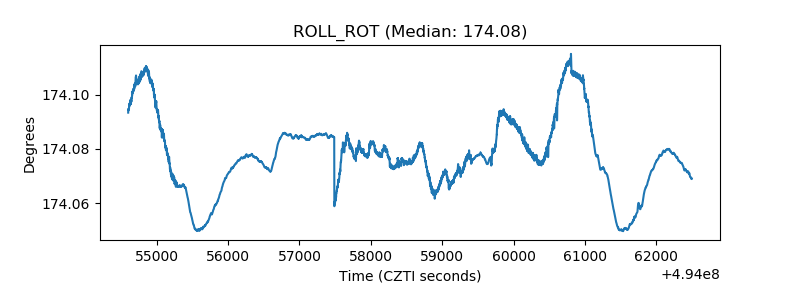 |
| _Roll_DEC | 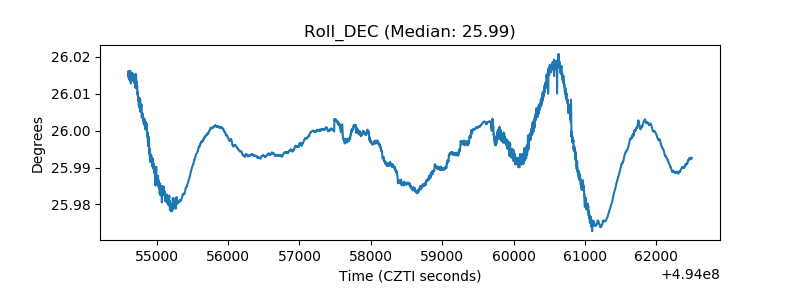 |
| _Roll_RA | 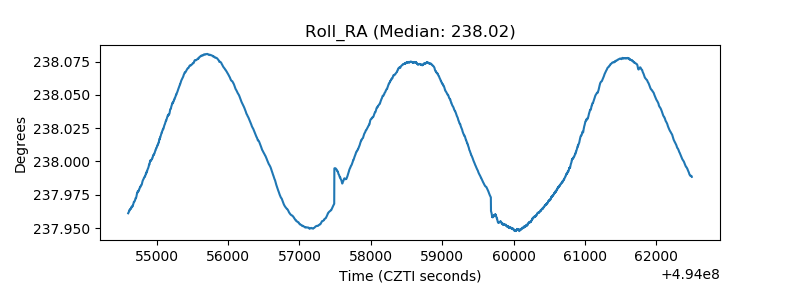 |
| Veto Counter | 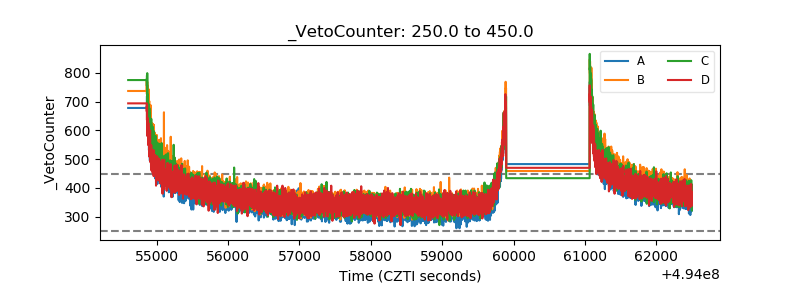 |