| Param | Original file | Final file |
|---|---|---|
| Filename | modeM0/AS1A14_022T05_9000006504_53645cztM0_level2.fits | modeM0/AS1A14_022T05_9000006504_53645cztM0_level2_quad_clean.evt |
| Size (bytes) | 1,038,977,280 | 75,585,600 |
| Size | 990.8 MB | 72.1 MB |
| Events in quadrant A | 8,560,827 | 524,633 |
| Events in quadrant B | 7,027,676 | 613,230 |
| Events in quadrant C | 14,128,242 | 209,461 |
| Events in quadrant D | 8,238,732 | 484,590 |
| Mode SS | |||
|---|---|---|---|
| Quadrant | BADHDUFLAG | Total packets | Discarded packets |
| A | 0 | 134 | 0 |
| B | 0 | 134 | 0 |
| C | 0 | 134 | 0 |
| D | 0 | 134 | 0 |
| Mode M9 | |||
|---|---|---|---|
| Quadrant | BADHDUFLAG | Total packets | Discarded packets |
| A | 0 | 15 | 0 |
| B | 0 | 15 | 0 |
| C | 0 | 16 | 0 |
| D | 0 | 16 | 0 |
| Mode M0 | |||
|---|---|---|---|
| Quadrant | BADHDUFLAG | Total packets | Discarded packets |
| A | 0 | 29963 | 2 |
| B | 0 | 25324 | 2 |
| C | 0 | 46340 | 9 |
| D | 0 | 29019 | 2 |
| Quadrant | Total seconds | Saturated seconds | Saturation percentage |
|---|---|---|---|
| A | 6541 | 1804 | 27.579881% |
| B | 6541 | 1323 | 20.226265% |
| C | 6540 | 4662 | 71.284404% |
| D | 6540 | 1516 | 23.180428% |
Noise dominated data is calculated using 1-second bins in cleaned event files. If a bin has >2000 counts, and if more than 50% of those come from <1% of pixels, then it is considered to be noise-dominated and hence unusable.
| Quadrant | # 1 sec bins | Bins with >0 counts | Bins with >2000 counts | High rate bins dominated by noise | Noise dominated (total time) | Noise dominated (detector-on time) | Marked lightcurve |
|---|---|---|---|---|---|---|---|
| A | 7651 | 6542 | 1510 | 1510 | 19.74% | 23.08% | 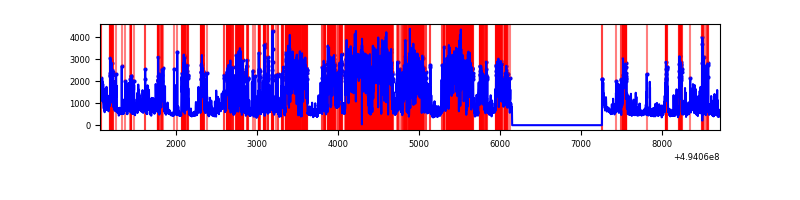 |
| B | 7650 | 6541 | 835 | 835 | 10.92% | 12.77% | 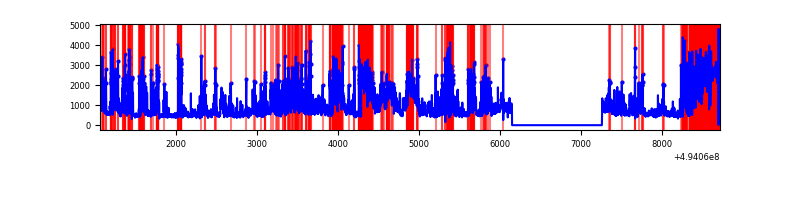 |
| C | 7650 | 6539 | 4159 | 4159 | 54.37% | 63.60% | 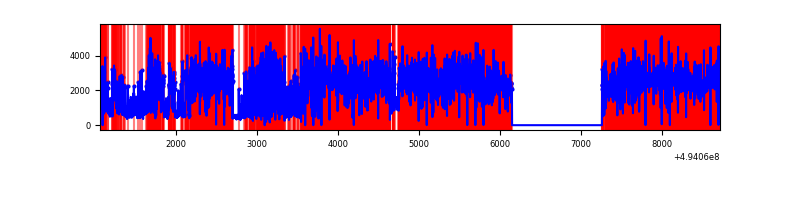 |
| D | 7650 | 6541 | 1247 | 1247 | 16.30% | 19.06% | 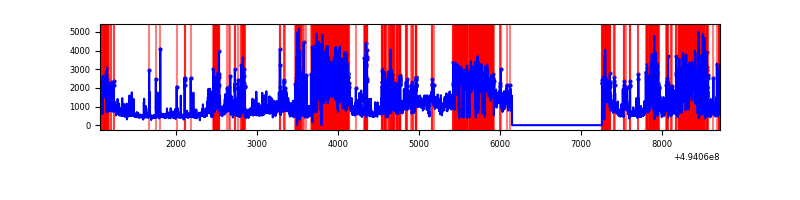 |
Top three noisy pixels from each quadrant. If the there are fewer than three noisy pixels in the level2.evt file, extra rows are filled as -1
| Pixel properties | Quadrant properties | ||||||
|---|---|---|---|---|---|---|---|
| Quadrant | DetID | PixID | Counts | Sigma | Mean | Median | Sigma |
| A | 3 | 78 | 4308288 | 25023.06 | 694 | 676 | 172.1 |
| A | 4 | 191 | 675774 | 3921.67 | 694 | 676 | 172.1 |
| A | 15 | 174 | 336442 | 1950.48 | 694 | 676 | 172.1 |
| B | 4 | 206 | 2132765 | 14382.9 | 696 | 675 | 148.2 |
| B | 5 | 172 | 848879 | 5721.91 | 696 | 675 | 148.2 |
| B | 7 | 0 | 413673 | 2786.05 | 696 | 675 | 148.2 |
| C | 1 | 241 | 9355713 | 80112.01 | 420 | 417 | 116.8 |
| C | 15 | 224 | 1388567 | 11887.12 | 420 | 417 | 116.8 |
| C | 13 | 49 | 983604 | 8419.3 | 420 | 417 | 116.8 |
| D | 10 | 172 | 2472580 | 12963.6 | 672 | 644 | 190.7 |
| D | 8 | 176 | 2358048 | 12362.96 | 672 | 644 | 190.7 |
| D | 3 | 224 | 229883 | 1202.2 | 672 | 644 | 190.7 |
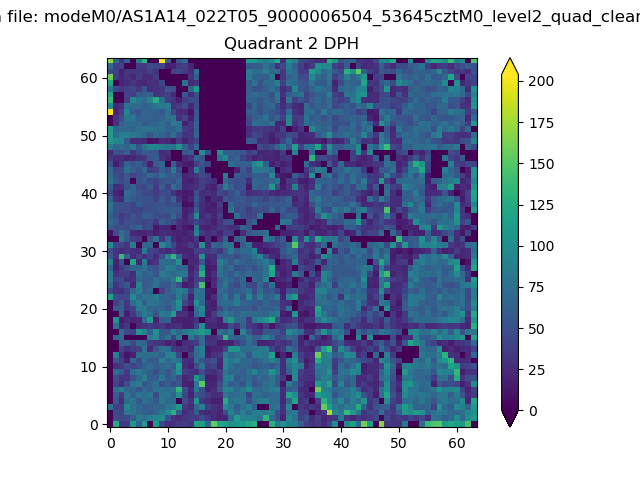
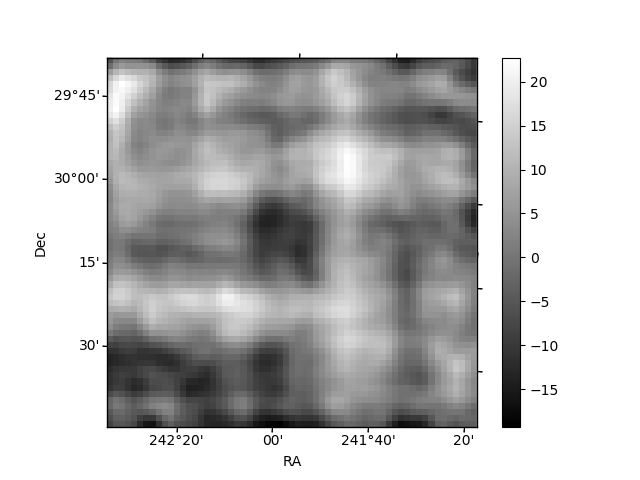
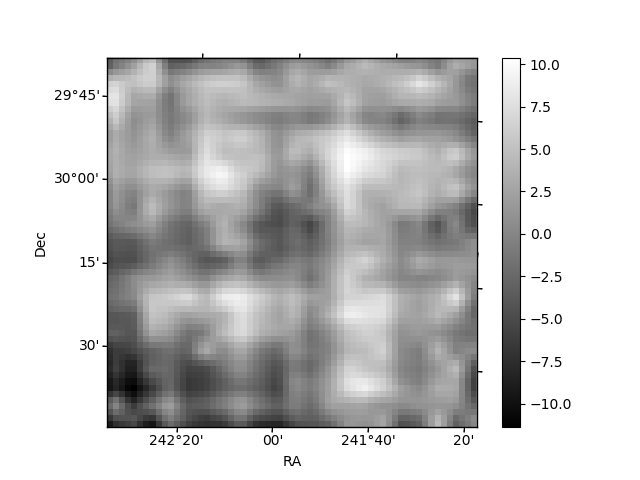
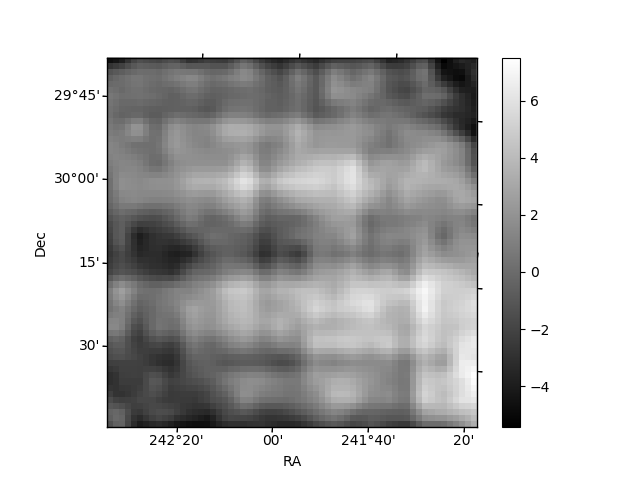
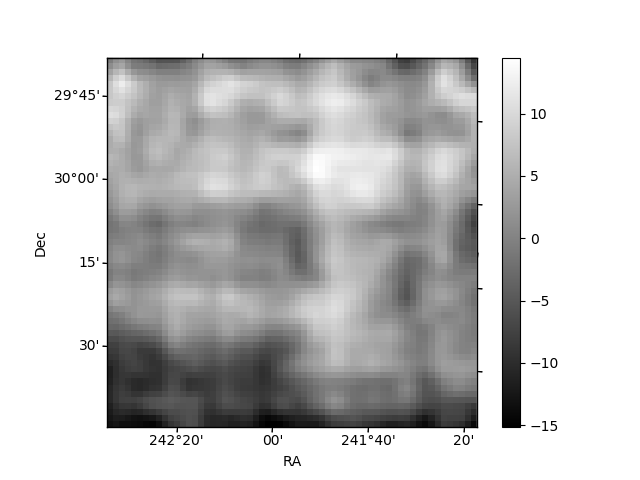
Histogram calculated using DETX and DETY for each event in the final _common_clean file
| Quadrant A | 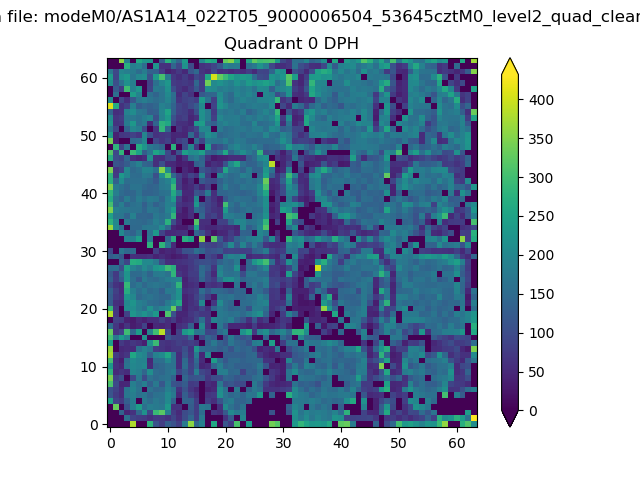 |
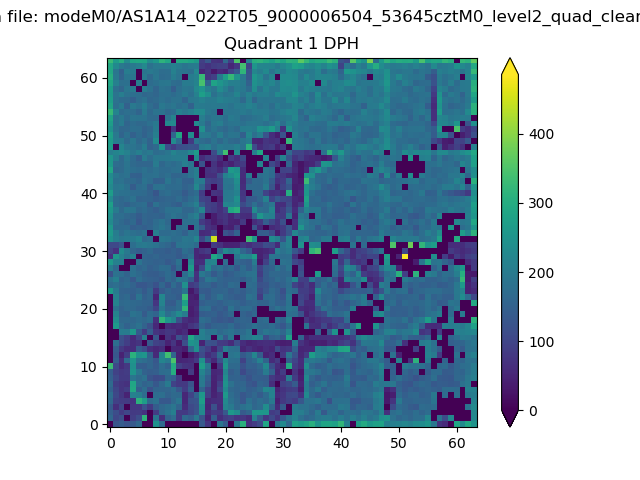 |
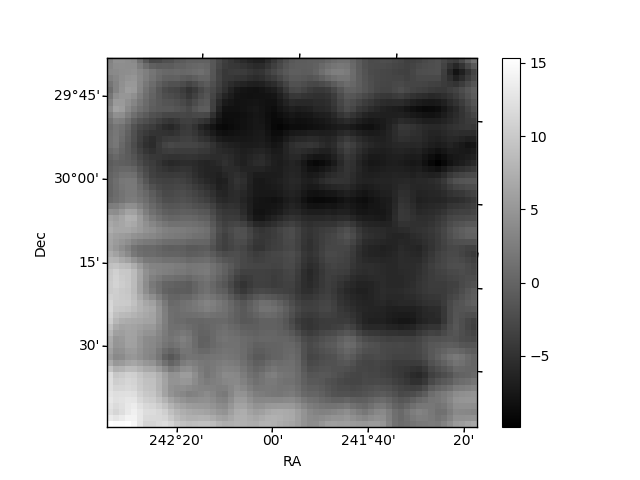
Quadrant B |
|---|---|---|---|
| Quadrant D | 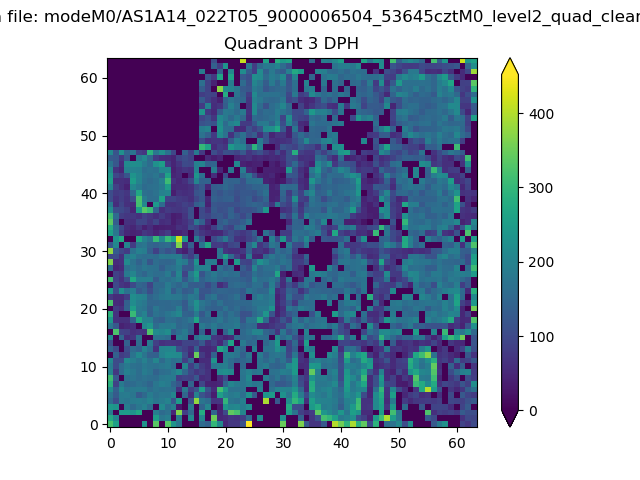 |
 |
Quadrant C |
| Plot type | Count rate plots | Images |
|---|---|---|
| Comparison with Poisson distribution Blue bars denote a histogram of data divided into 1 sec bins. Red curve is a Poisson curve with rate = median count rate of data. |
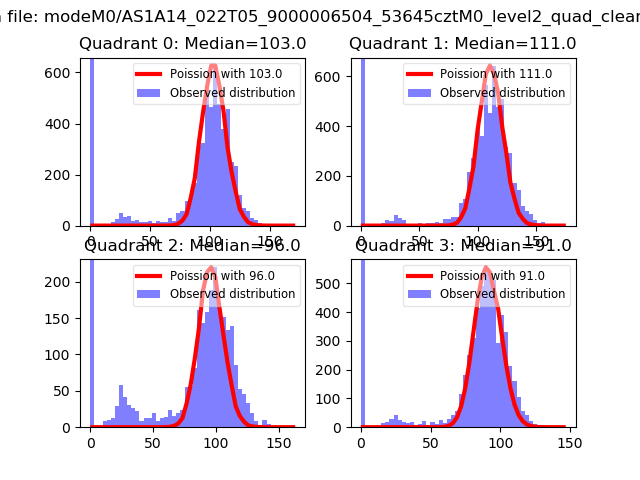 |
 |
| Quadrant-wise count rates Data is divided into 100 sec bins |
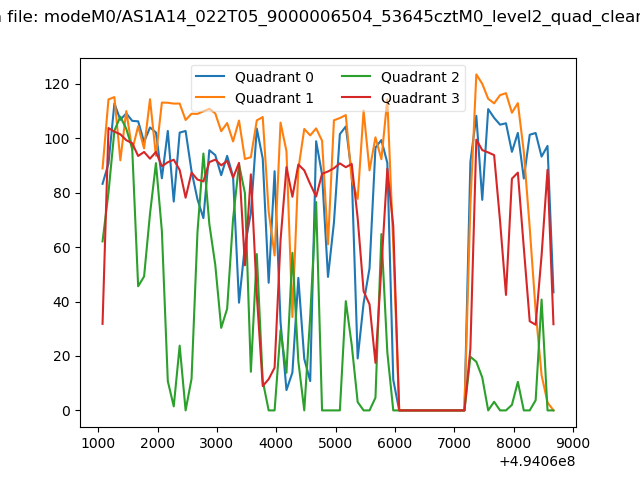 |
|
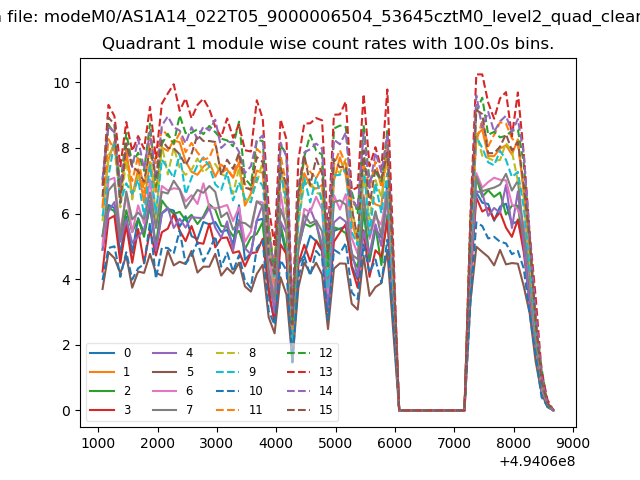
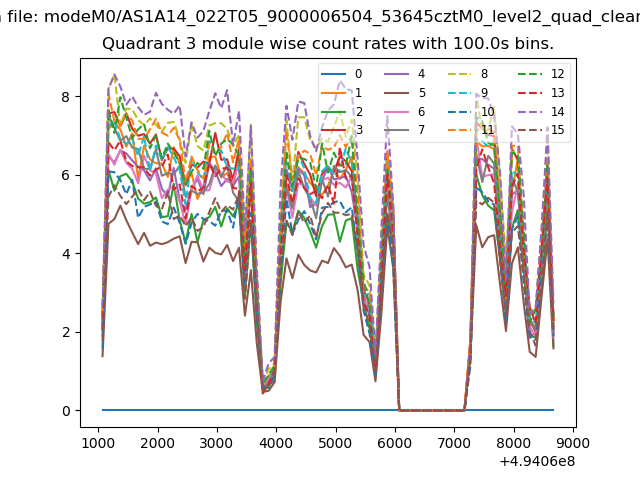
| Module-wise count rates for Quadrant A Data is divided into 100 sec bins |
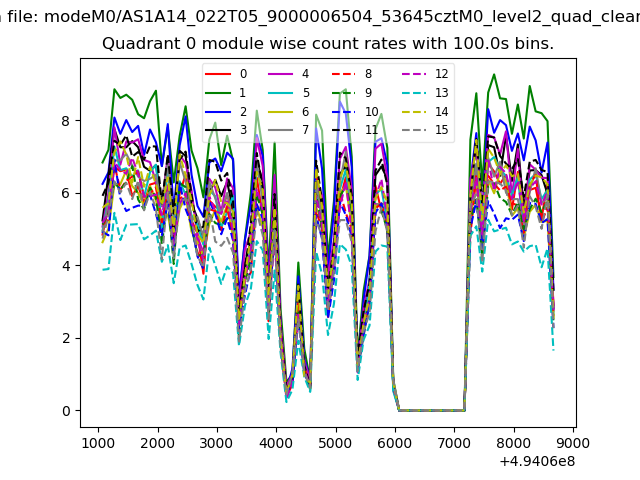 |
 |
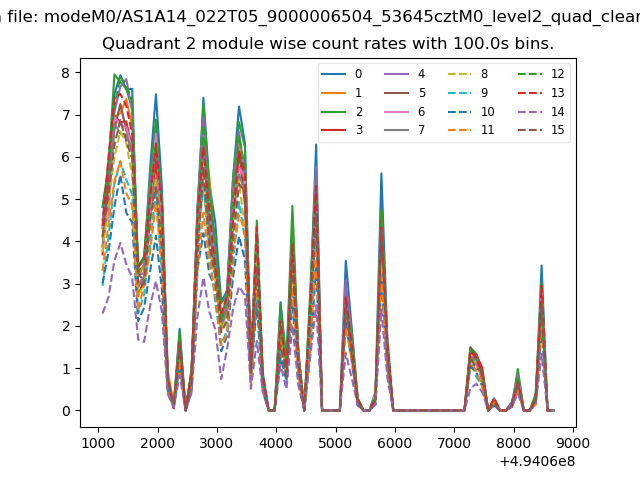
| Module-wise count rates for Quadrant B Data is divided into 100 sec bins |
 |
 |
| Module-wise count rates for Quadrant C Data is divided into 100 sec bins |
 |
 |
| Module-wise count rates for Quadrant D Data is divided into 100 sec bins |
 |
 |
| Parameter | Plot |
|---|---|
| CZT HV Monitor |  |
| D_VDD | 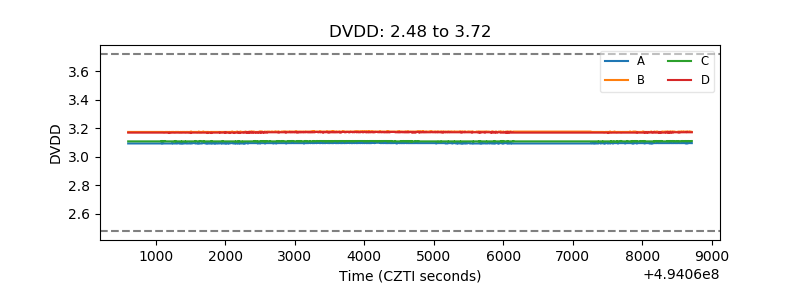 |
| Temperature 1 | 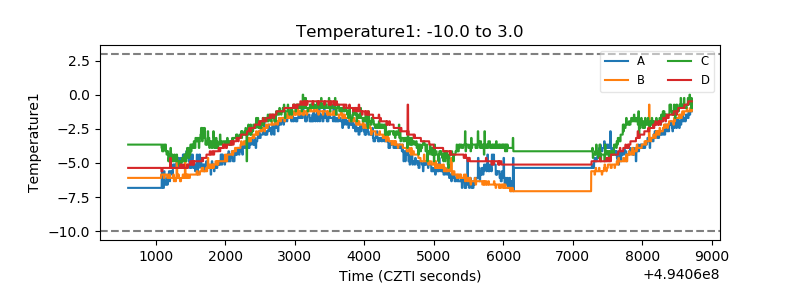 |
| Veto HV Monitor | 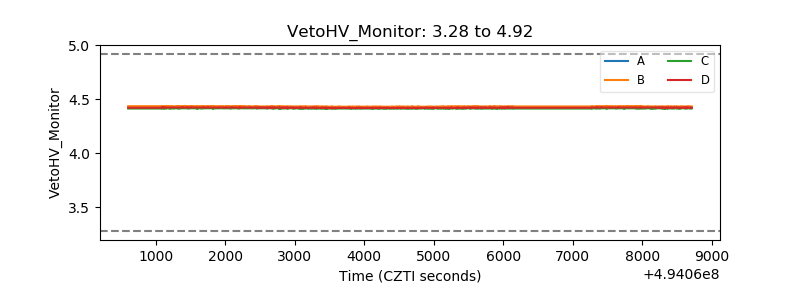 |
| Veto LLD | 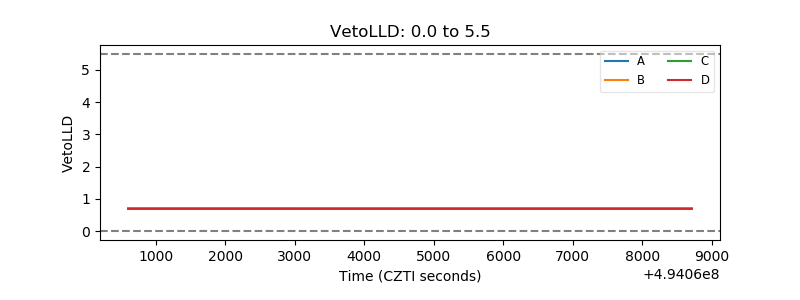 |
| Alpha Counter | 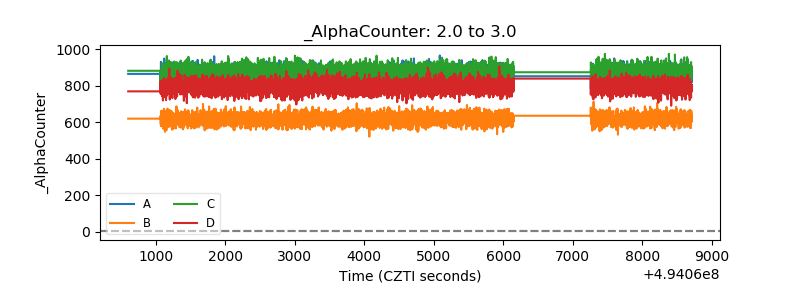 |
| _CPM_Rate | 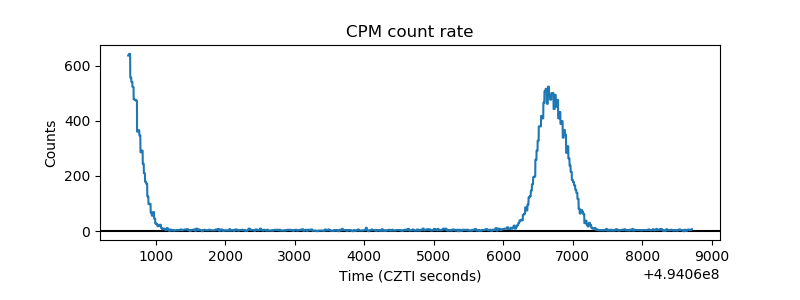 |
| CZT Counter | 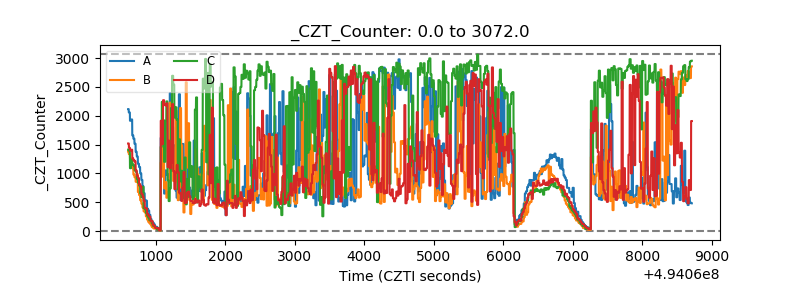 |
| +2.5 Volts monitor |  |
| +5 Volts monitor |  |
| _ROLL_ROT | 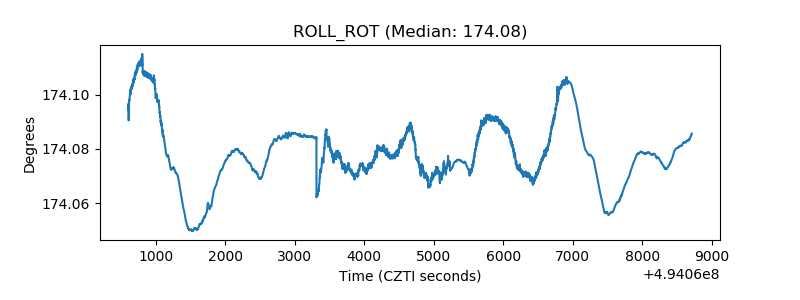 |
| _Roll_DEC | 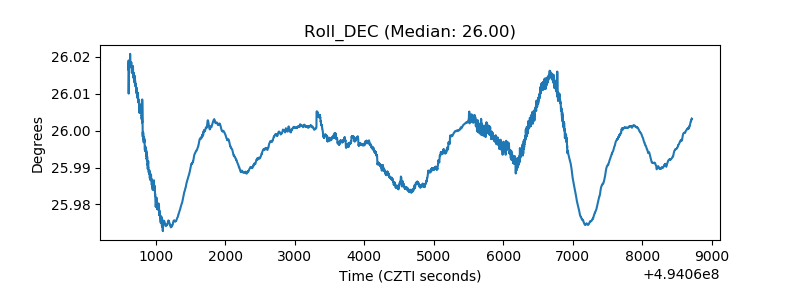 |
| _Roll_RA | 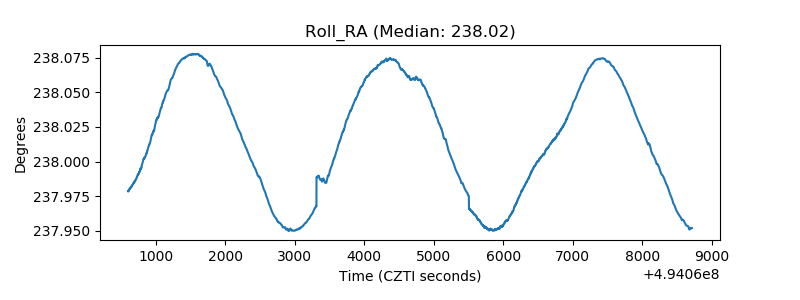 |
| Veto Counter | 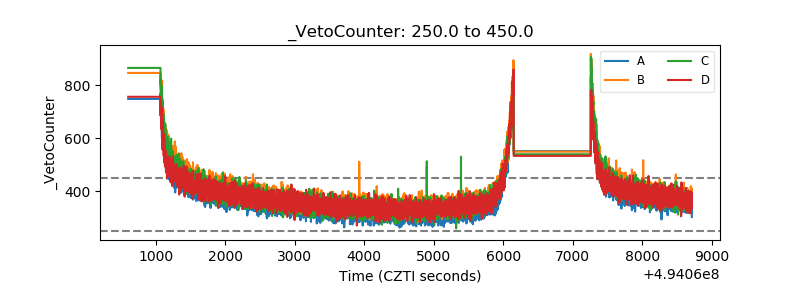 |