| Param | Original file | Final file |
|---|---|---|
| Filename | modeM0/AS1A14_022T05_9000006504_53646cztM0_level2.fits | modeM0/AS1A14_022T05_9000006504_53646cztM0_level2_quad_clean.evt |
| Size (bytes) | 1,008,561,600 | 70,778,880 |
| Size | 961.8 MB | 67.5 MB |
| Events in quadrant A | 4,589,273 | 626,359 |
| Events in quadrant B | 8,452,572 | 538,276 |
| Events in quadrant C | 15,168,975 | 112,585 |
| Events in quadrant D | 8,632,308 | 421,661 |
| Mode SS | |||
|---|---|---|---|
| Quadrant | BADHDUFLAG | Total packets | Discarded packets |
| A | 0 | 130 | 0 |
| B | 0 | 130 | 0 |
| C | 0 | 130 | 0 |
| D | 0 | 130 | 0 |
| Mode M9 | |||
|---|---|---|---|
| Quadrant | BADHDUFLAG | Total packets | Discarded packets |
| A | 0 | 10 | 0 |
| B | 0 | 10 | 0 |
| C | 0 | 10 | 0 |
| D | 0 | 10 | 0 |
| Mode M0 | |||
|---|---|---|---|
| Quadrant | BADHDUFLAG | Total packets | Discarded packets |
| A | 0 | 17947 | 1 |
| B | 0 | 29560 | 1 |
| C | 0 | 49341 | 1 |
| D | 0 | 29980 | 1 |
| Quadrant | Total seconds | Saturated seconds | Saturation percentage |
|---|---|---|---|
| A | 6358 | 363 | 5.709343% |
| B | 6359 | 1683 | 26.466426% |
| C | 6359 | 5329 | 83.802485% |
| D | 6359 | 1975 | 31.058343% |
Noise dominated data is calculated using 1-second bins in cleaned event files. If a bin has >2000 counts, and if more than 50% of those come from <1% of pixels, then it is considered to be noise-dominated and hence unusable.
| Quadrant | # 1 sec bins | Bins with >0 counts | Bins with >2000 counts | High rate bins dominated by noise | Noise dominated (total time) | Noise dominated (detector-on time) | Marked lightcurve |
|---|---|---|---|---|---|---|---|
| A | 7388 | 6359 | 192 | 192 | 2.60% | 3.02% | 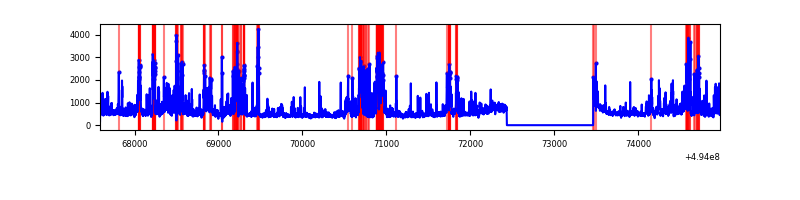 |
| B | 7389 | 6360 | 1264 | 1264 | 17.11% | 19.87% | 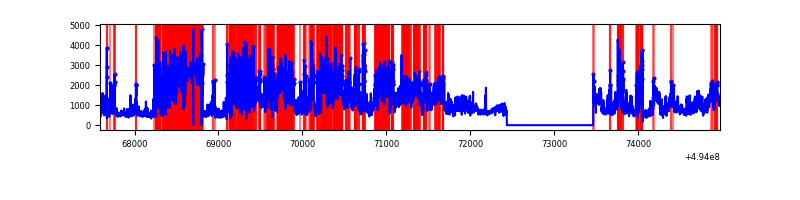 |
| C | 7389 | 6359 | 4915 | 4915 | 66.52% | 77.29% | 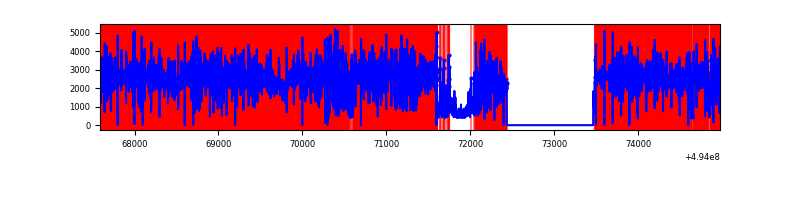 |
| D | 7389 | 6359 | 1580 | 1580 | 21.38% | 24.85% | 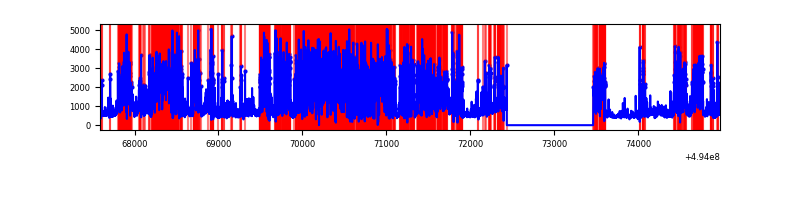 |
Top three noisy pixels from each quadrant. If the there are fewer than three noisy pixels in the level2.evt file, extra rows are filled as -1
| Pixel properties | Quadrant properties | ||||||
|---|---|---|---|---|---|---|---|
| Quadrant | DetID | PixID | Counts | Sigma | Mean | Median | Sigma |
| A | 3 | 78 | 821458 | 4595.03 | 720 | 704 | 178.6 |
| A | 15 | 174 | 359031 | 2006.11 | 720 | 704 | 178.6 |
| A | 4 | 191 | 197043 | 1099.21 | 720 | 704 | 178.6 |
| B | 4 | 206 | 4236742 | 31263.78 | 638 | 616 | 135.5 |
| B | 5 | 172 | 559842 | 4127.24 | 638 | 616 | 135.5 |
| B | 5 | 185 | 367582 | 2708.31 | 638 | 616 | 135.5 |
| C | 1 | 241 | 11674421 | 120264.91 | 347 | 345 | 97.1 |
| C | 15 | 224 | 973441 | 10024.72 | 347 | 345 | 97.1 |
| C | 13 | 3 | 624879 | 6433.87 | 347 | 345 | 97.1 |
| D | 8 | 176 | 4377147 | 24724.89 | 609 | 581 | 177.0 |
| D | 10 | 172 | 534438 | 3015.96 | 609 | 581 | 177.0 |
| D | 15 | 93 | 378568 | 2135.39 | 609 | 581 | 177.0 |
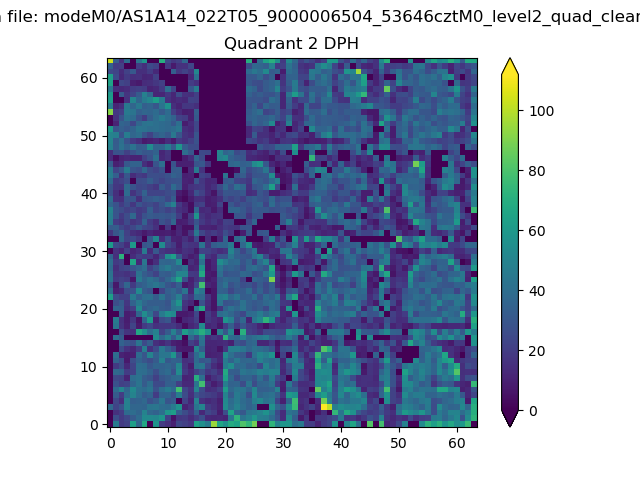
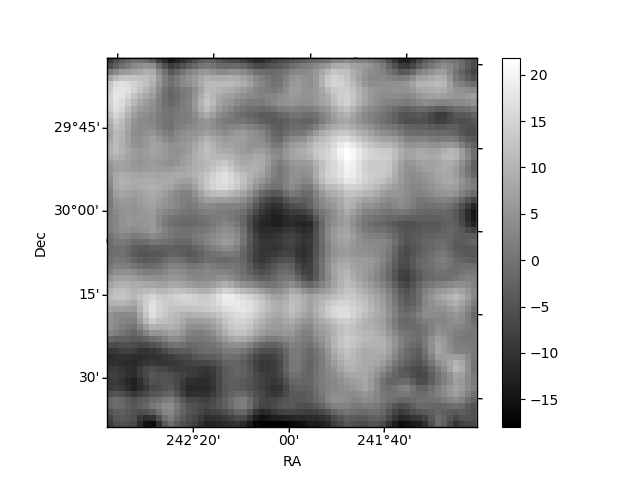
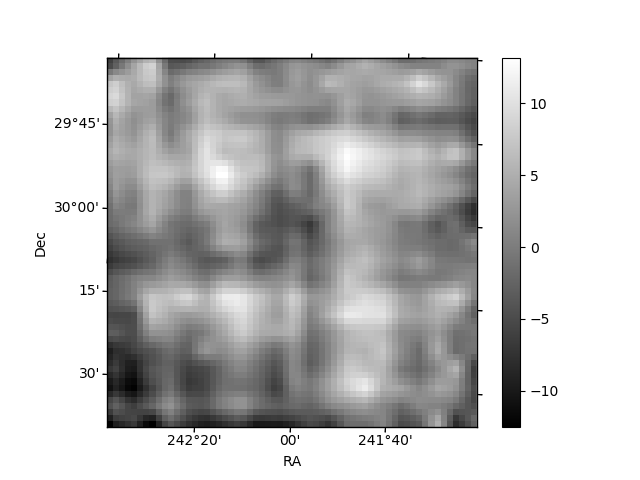
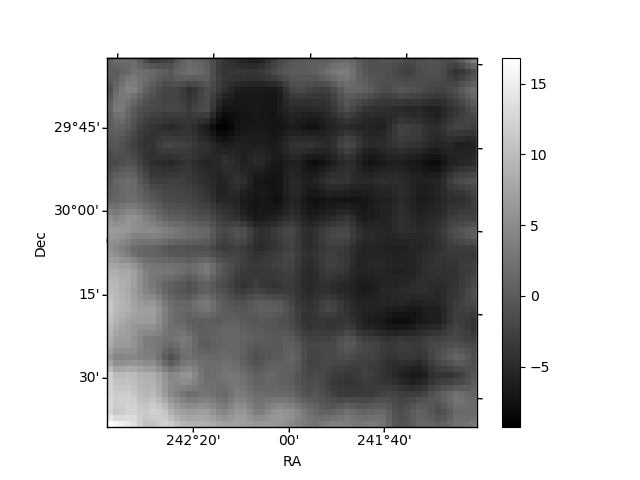
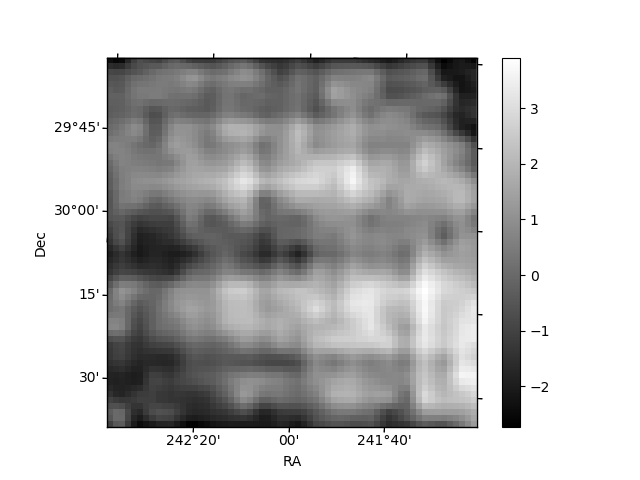
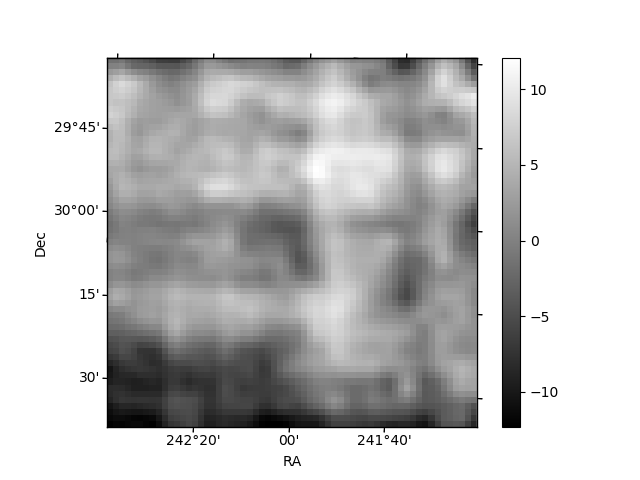
Histogram calculated using DETX and DETY for each event in the final _common_clean file
| Quadrant A | 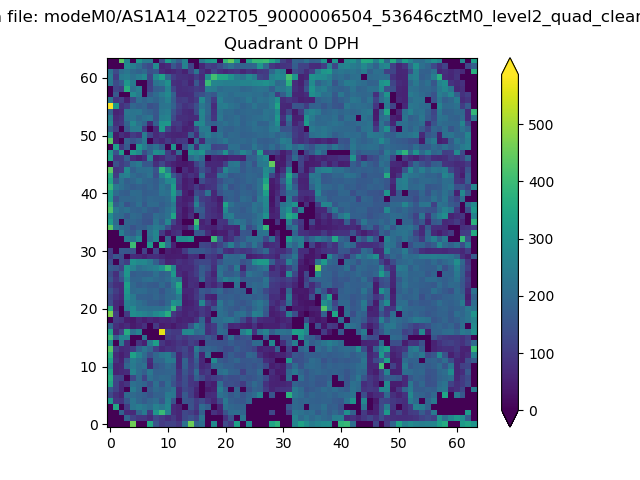 |
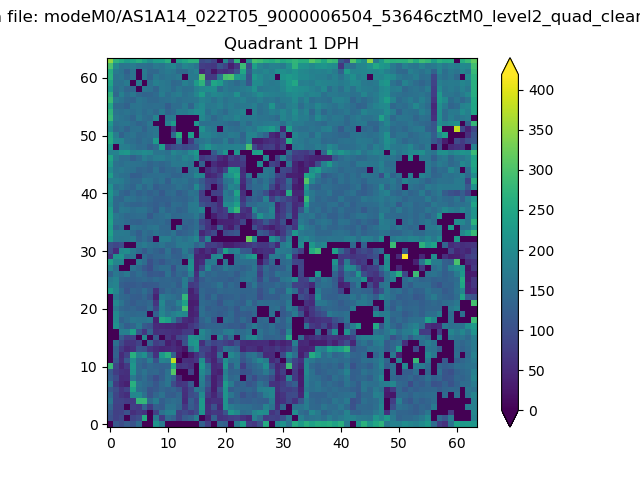 |
Quadrant B |
|---|---|---|---|
| Quadrant D | 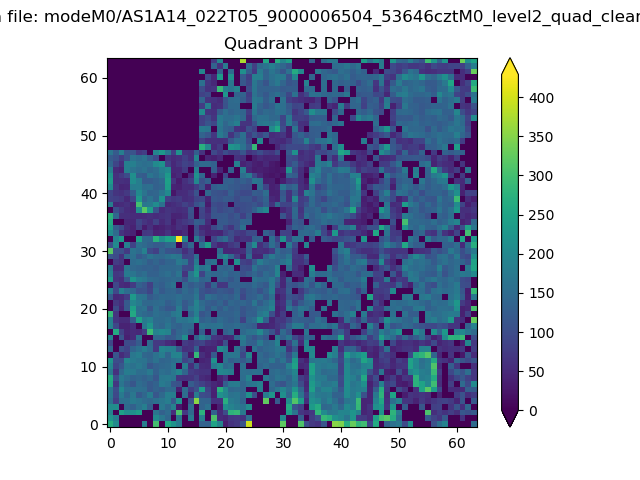 |
 |
Quadrant C |
| Plot type | Count rate plots | Images |
|---|---|---|
| Comparison with Poisson distribution Blue bars denote a histogram of data divided into 1 sec bins. Red curve is a Poisson curve with rate = median count rate of data. |
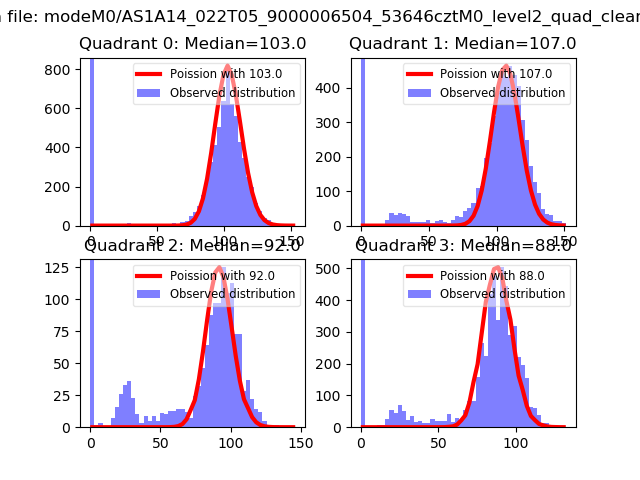 |
 |
| Quadrant-wise count rates Data is divided into 100 sec bins |
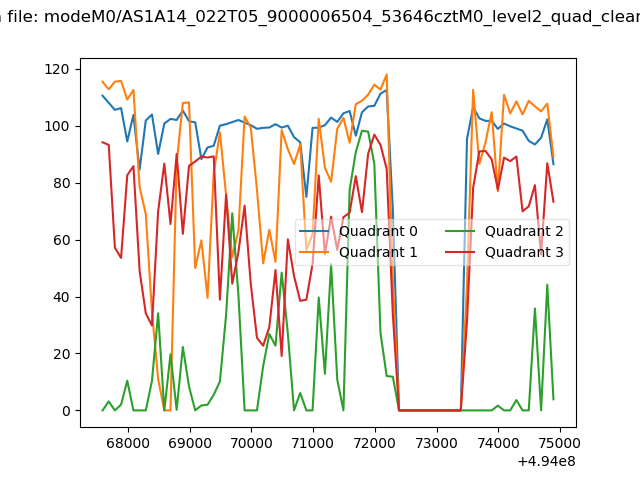 |
|
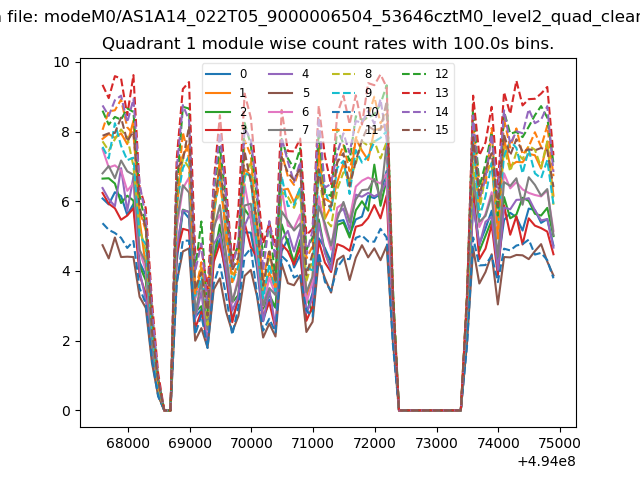
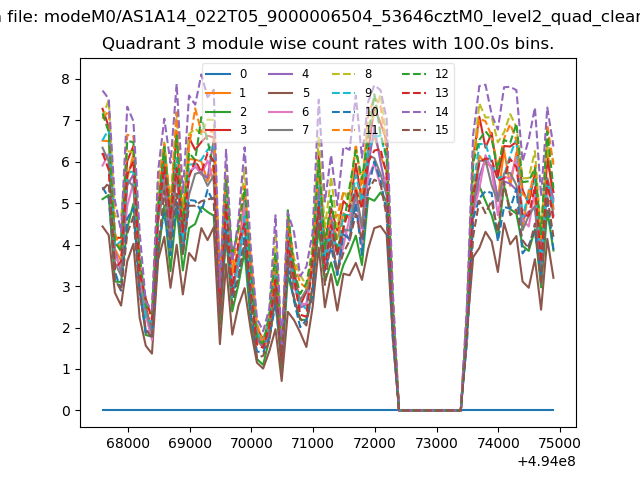
| Module-wise count rates for Quadrant A Data is divided into 100 sec bins |
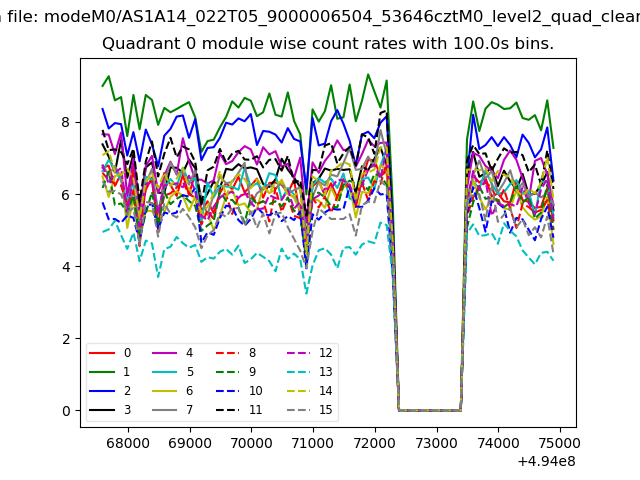 |
 |
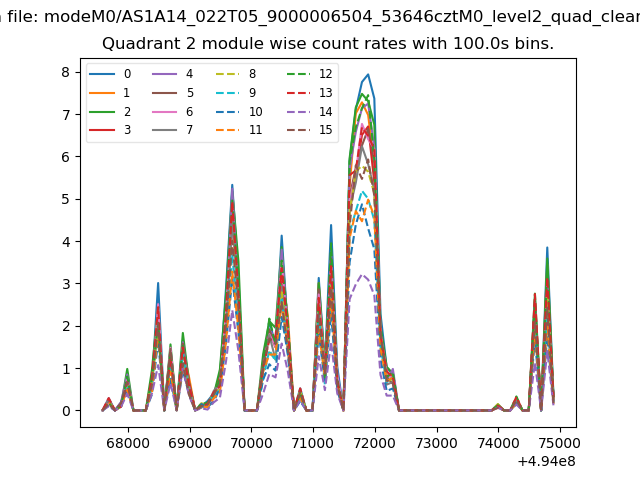
| Module-wise count rates for Quadrant B Data is divided into 100 sec bins |
 |
 |
| Module-wise count rates for Quadrant C Data is divided into 100 sec bins |
 |
 |
| Module-wise count rates for Quadrant D Data is divided into 100 sec bins |
 |
 |
| Parameter | Plot |
|---|---|
| CZT HV Monitor | 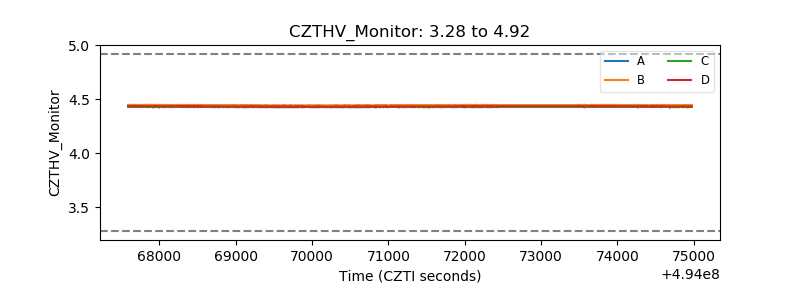 |
| D_VDD | 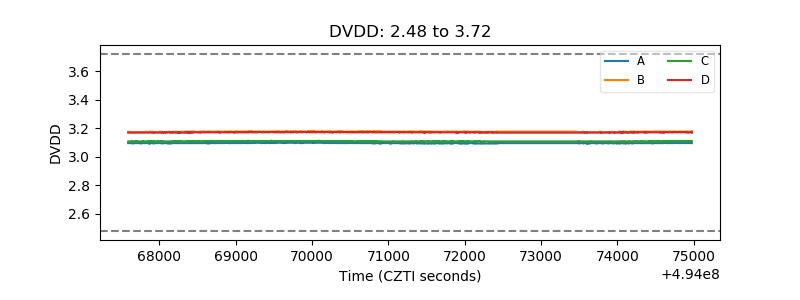 |
| Temperature 1 | 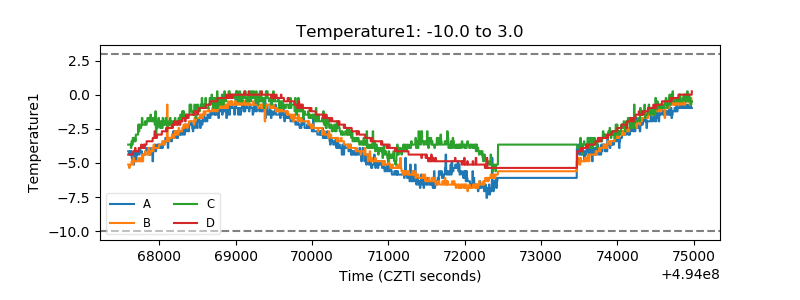 |
| Veto HV Monitor |  |
| Veto LLD | 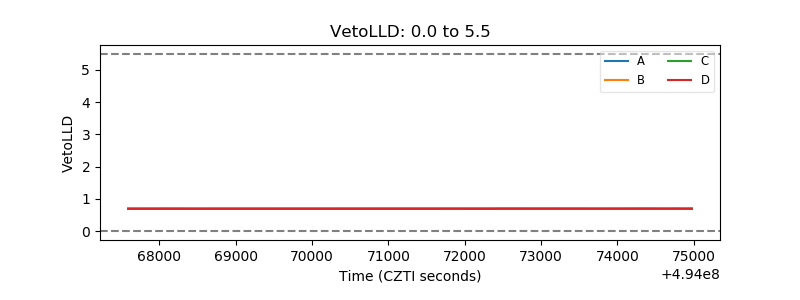 |
| Alpha Counter | 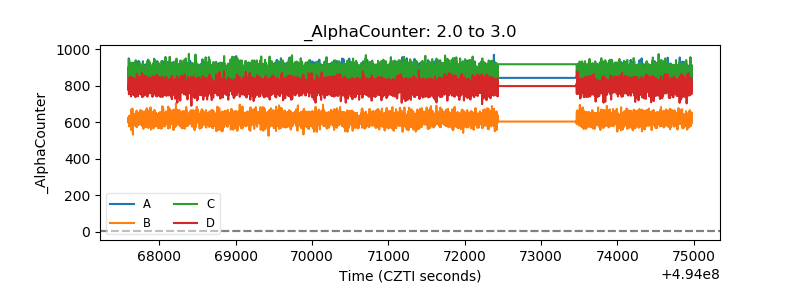 |
| _CPM_Rate | 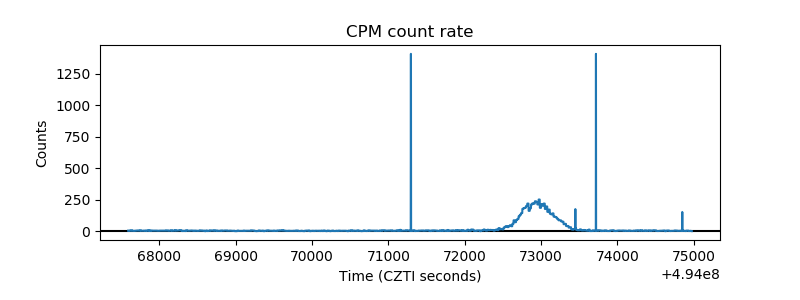 |
| CZT Counter | 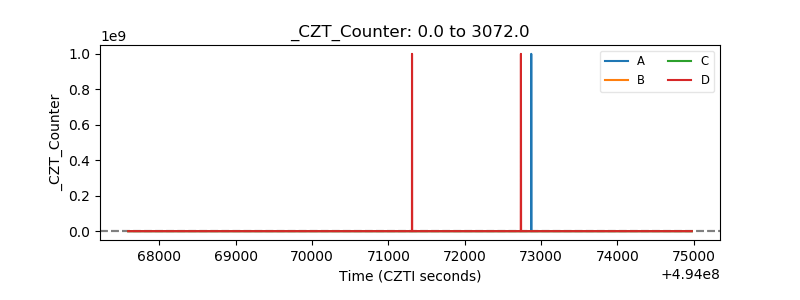 |
| +2.5 Volts monitor |  |
| +5 Volts monitor |  |
| _ROLL_ROT | 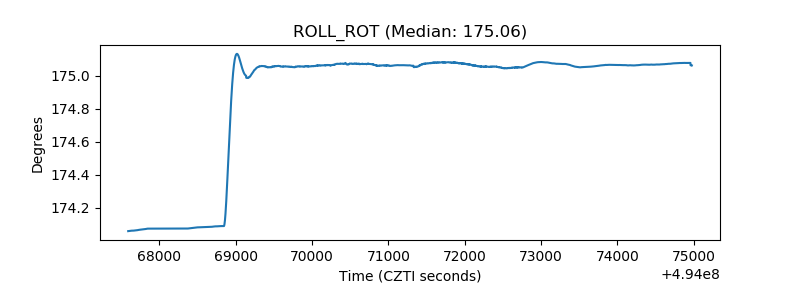 |
| _Roll_DEC | 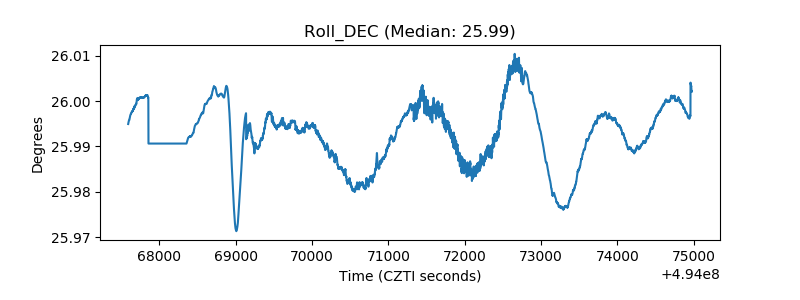 |
| _Roll_RA | 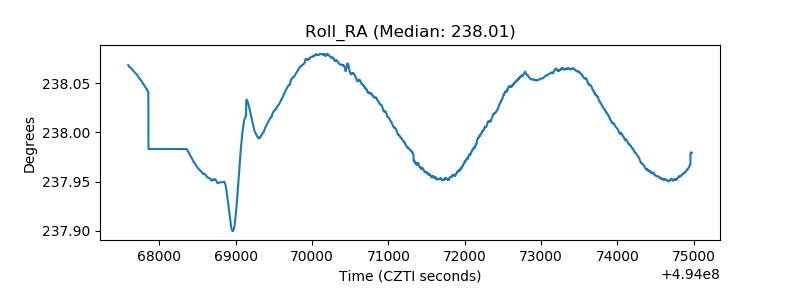 |
| Veto Counter | 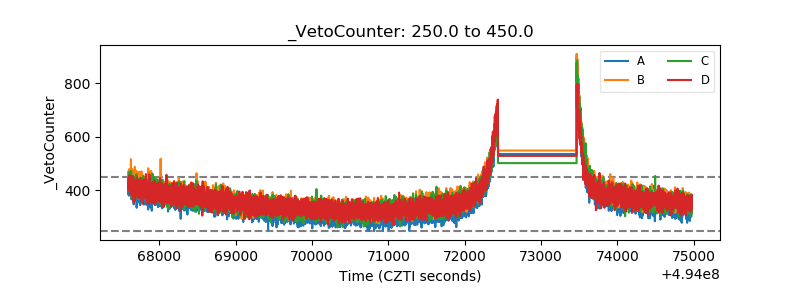 |