| Param | Original file | Final file |
|---|---|---|
| Filename | modeM0/AS1A14_022T05_9000006504_53647cztM0_level2.fits | modeM0/AS1A14_022T05_9000006504_53647cztM0_level2_quad_clean.evt |
| Size (bytes) | 917,081,280 | 72,809,280 |
| Size | 874.6 MB | 69.4 MB |
| Events in quadrant A | 5,877,436 | 564,312 |
| Events in quadrant B | 5,755,090 | 625,084 |
| Events in quadrant C | 15,256,236 | 96,022 |
| Events in quadrant D | 6,569,950 | 477,790 |
| Mode SS | |||
|---|---|---|---|
| Quadrant | BADHDUFLAG | Total packets | Discarded packets |
| A | 0 | 128 | 0 |
| B | 0 | 128 | 0 |
| C | 0 | 128 | 0 |
| D | 0 | 128 | 0 |
| Mode M9 | |||
|---|---|---|---|
| Quadrant | BADHDUFLAG | Total packets | Discarded packets |
| A | 0 | 8 | 0 |
| B | 0 | 8 | 0 |
| C | 0 | 8 | 0 |
| D | 0 | 8 | 0 |
| Mode M0 | |||
|---|---|---|---|
| Quadrant | BADHDUFLAG | Total packets | Discarded packets |
| A | 0 | 21859 | 1 |
| B | 0 | 21319 | 1 |
| C | 0 | 49568 | 1 |
| D | 0 | 23883 | 1 |
| Quadrant | Total seconds | Saturated seconds | Saturation percentage |
|---|---|---|---|
| A | 6319 | 780 | 12.343725% |
| B | 6319 | 497 | 7.865169% |
| C | 6320 | 5473 | 86.598101% |
| D | 6320 | 1126 | 17.816456% |
Noise dominated data is calculated using 1-second bins in cleaned event files. If a bin has >2000 counts, and if more than 50% of those come from <1% of pixels, then it is considered to be noise-dominated and hence unusable.
| Quadrant | # 1 sec bins | Bins with >0 counts | Bins with >2000 counts | High rate bins dominated by noise | Noise dominated (total time) | Noise dominated (detector-on time) | Marked lightcurve |
|---|---|---|---|---|---|---|---|
| A | 7129 | 6320 | 523 | 523 | 7.34% | 8.28% | 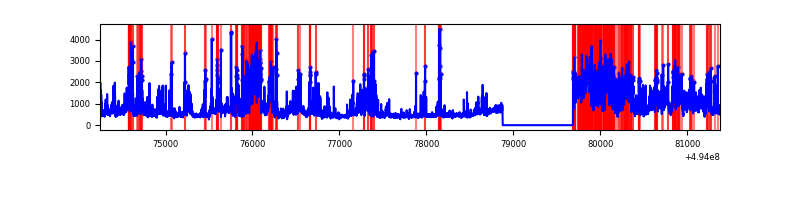 |
| B | 7129 | 6320 | 357 | 357 | 5.01% | 5.65% | 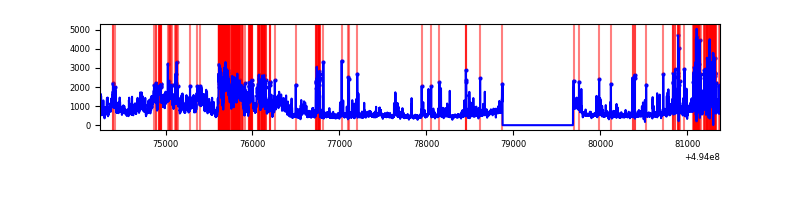 |
| C | 7129 | 6319 | 5017 | 5017 | 70.37% | 79.40% | 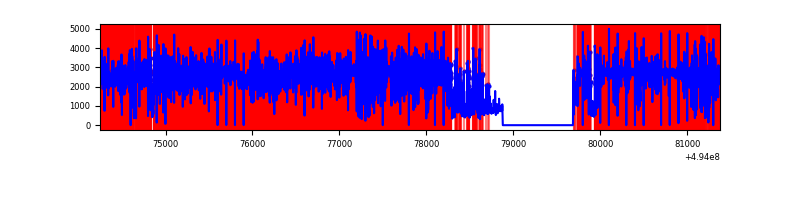 |
| D | 7130 | 6321 | 821 | 821 | 11.51% | 12.99% | 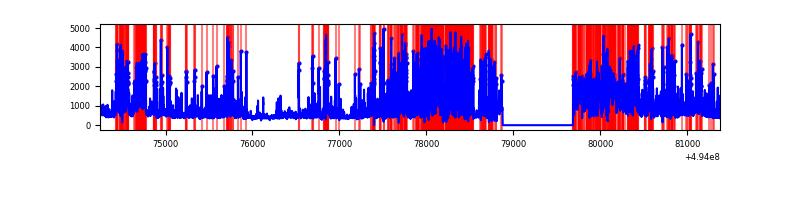 |
Top three noisy pixels from each quadrant. If the there are fewer than three noisy pixels in the level2.evt file, extra rows are filled as -1
| Pixel properties | Quadrant properties | ||||||
|---|---|---|---|---|---|---|---|
| Quadrant | DetID | PixID | Counts | Sigma | Mean | Median | Sigma |
| A | 3 | 78 | 1933255 | 11465.23 | 672 | 655 | 168.6 |
| A | 15 | 174 | 519244 | 3076.55 | 672 | 655 | 168.6 |
| A | 4 | 191 | 443628 | 2627.96 | 672 | 655 | 168.6 |
| B | 4 | 206 | 1621210 | 11423.92 | 667 | 645 | 141.9 |
| B | 5 | 172 | 651840 | 4590.5 | 667 | 645 | 141.9 |
| B | 7 | 0 | 256834 | 1805.96 | 667 | 645 | 141.9 |
| C | 1 | 241 | 10589823 | 117257.75 | 321 | 318 | 90.3 |
| C | 15 | 224 | 1444754 | 15994.26 | 321 | 318 | 90.3 |
| C | 13 | 3 | 1140347 | 12623.56 | 321 | 318 | 90.3 |
| D | 15 | 93 | 2256680 | 12405.12 | 626 | 597 | 181.9 |
| D | 8 | 176 | 700024 | 3845.82 | 626 | 597 | 181.9 |
| D | 3 | 224 | 228645 | 1253.93 | 626 | 597 | 181.9 |
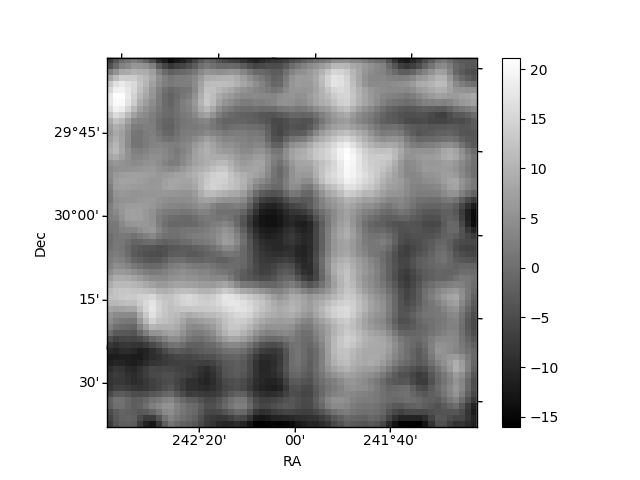
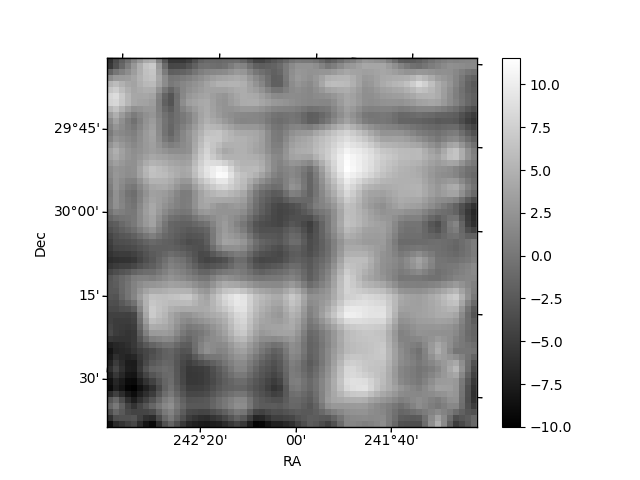
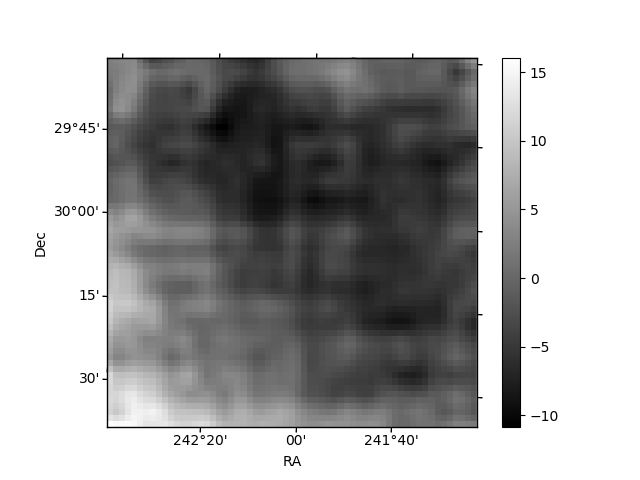
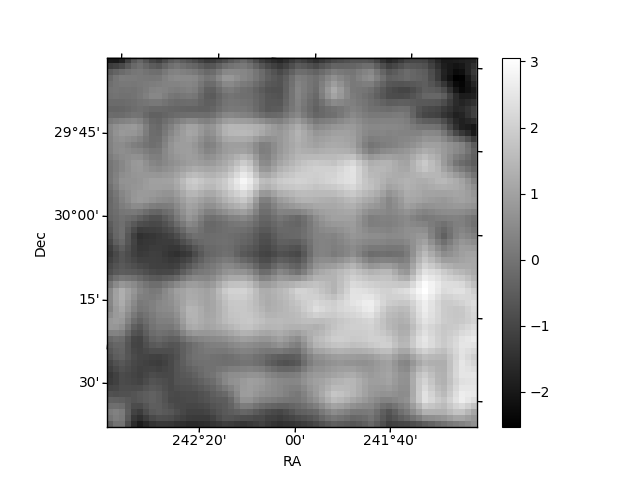
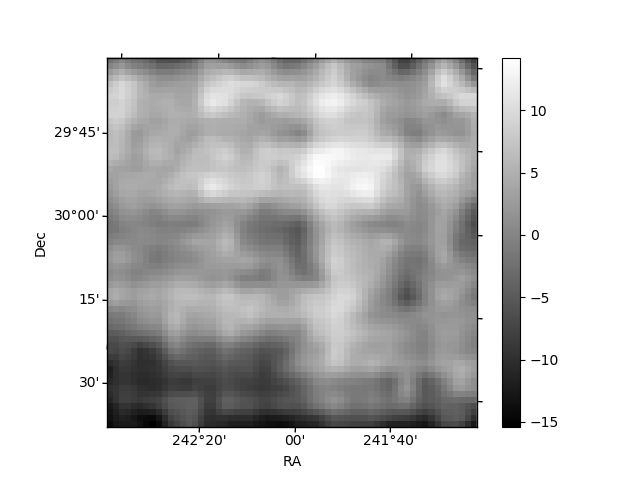
Histogram calculated using DETX and DETY for each event in the final _common_clean file
| Quadrant A | 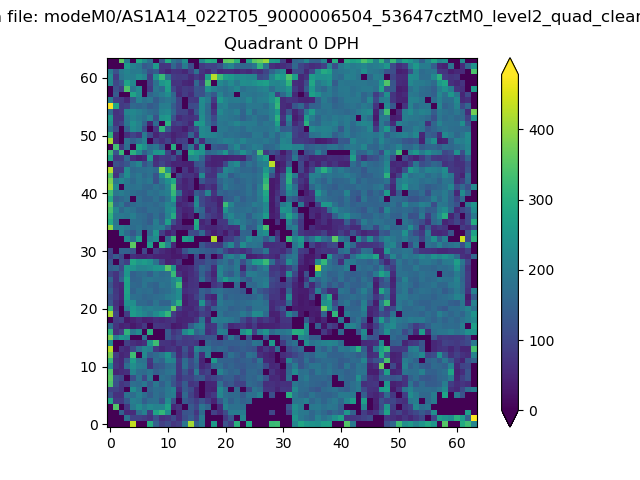 |
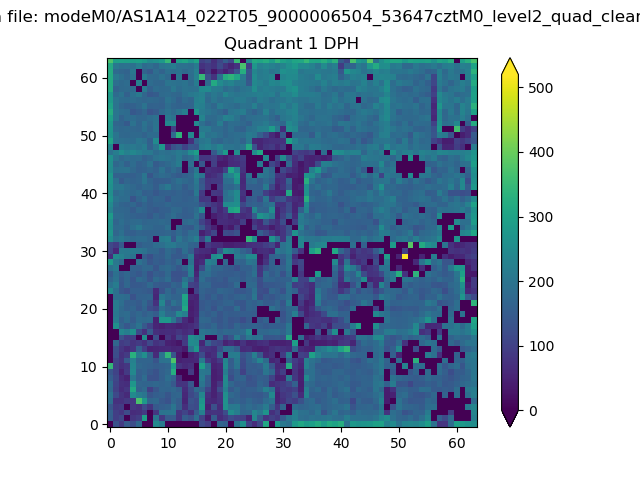 |
Quadrant B |
|---|---|---|---|
| Quadrant D | 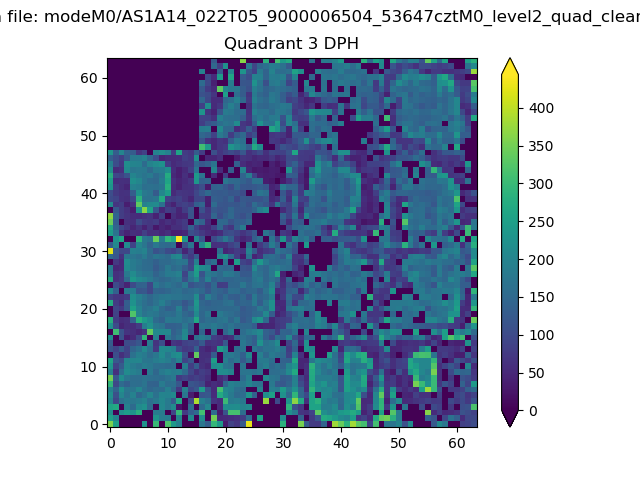 |
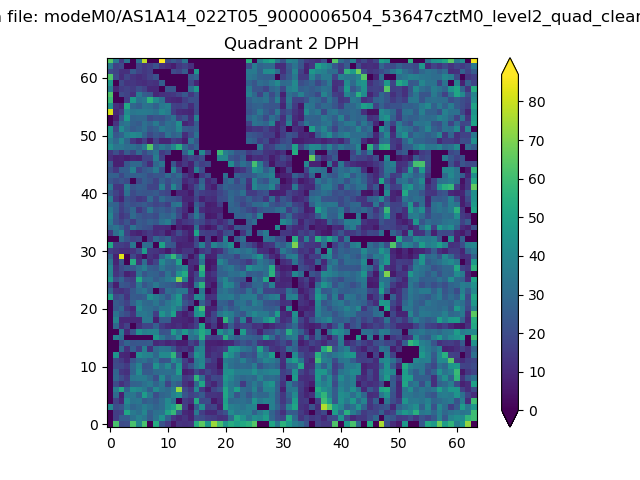 |
Quadrant C |
| Plot type | Count rate plots | Images |
|---|---|---|
| Comparison with Poisson distribution Blue bars denote a histogram of data divided into 1 sec bins. Red curve is a Poisson curve with rate = median count rate of data. |
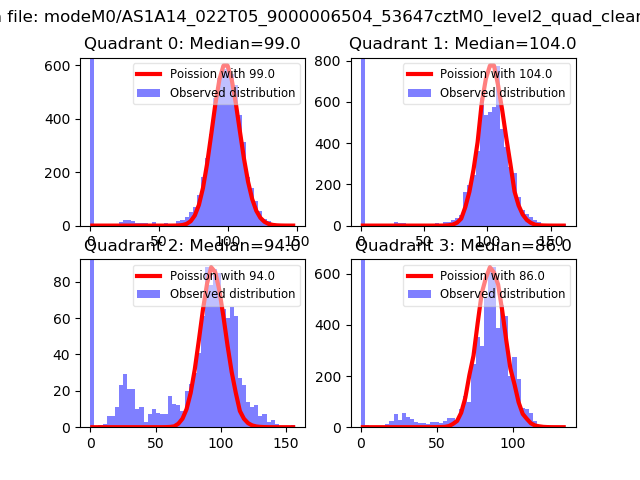 |
 |
| Quadrant-wise count rates Data is divided into 100 sec bins |
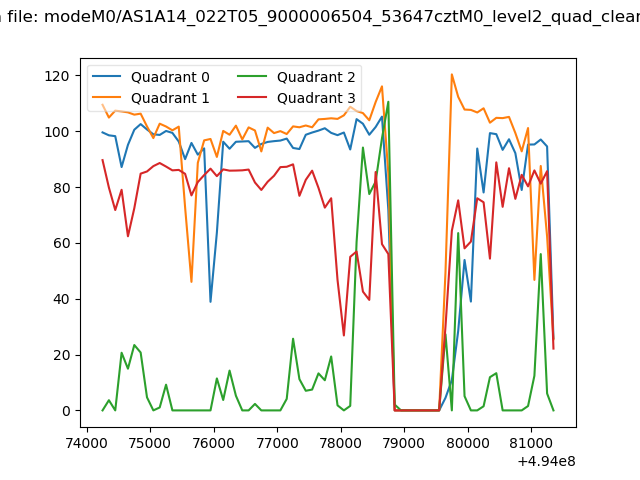 |
|
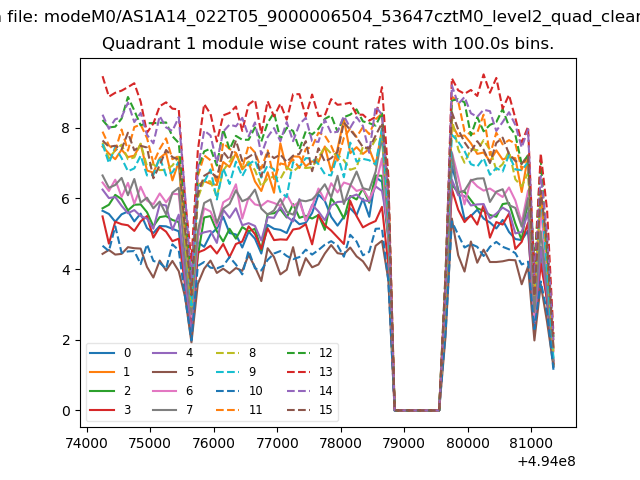
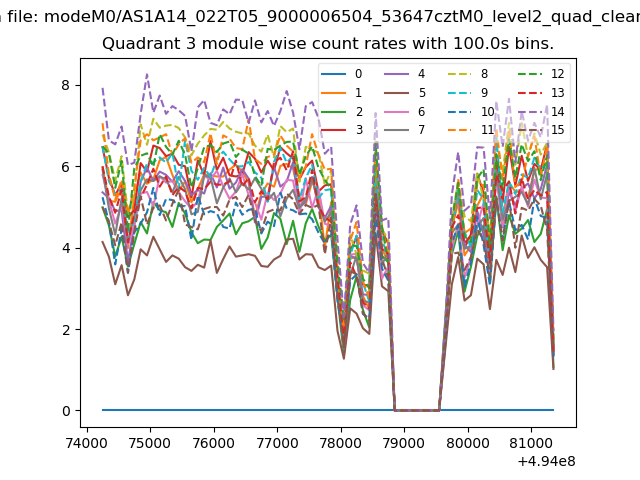
| Module-wise count rates for Quadrant A Data is divided into 100 sec bins |
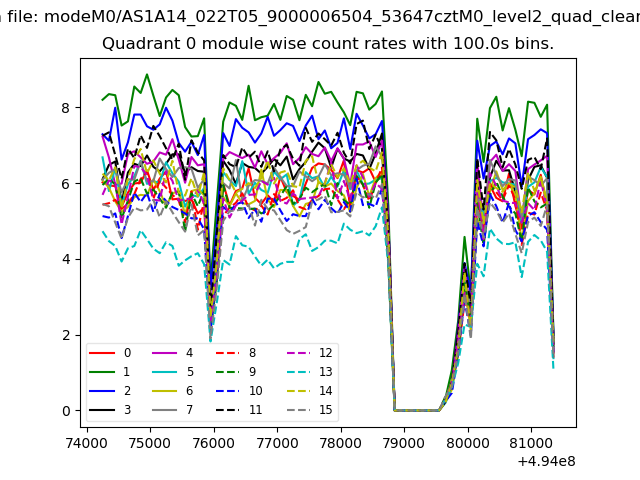 |
 |
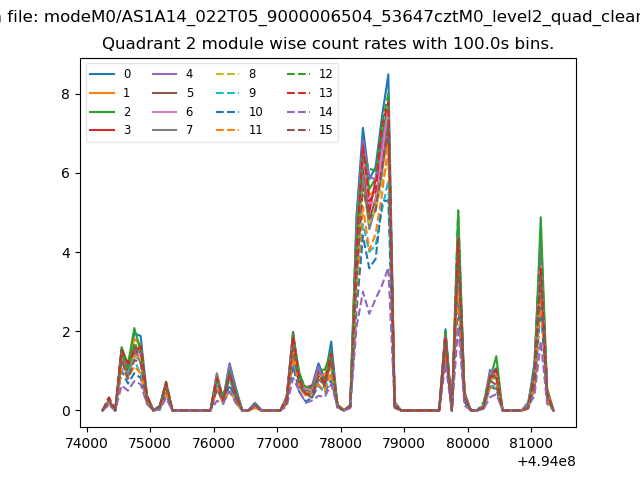
| Module-wise count rates for Quadrant B Data is divided into 100 sec bins |
 |
 |
| Module-wise count rates for Quadrant C Data is divided into 100 sec bins |
 |
 |
| Module-wise count rates for Quadrant D Data is divided into 100 sec bins |
 |
 |
| Parameter | Plot |
|---|---|
| CZT HV Monitor | 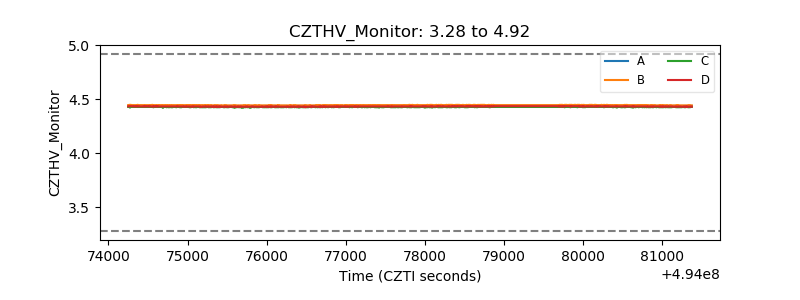 |
| D_VDD | 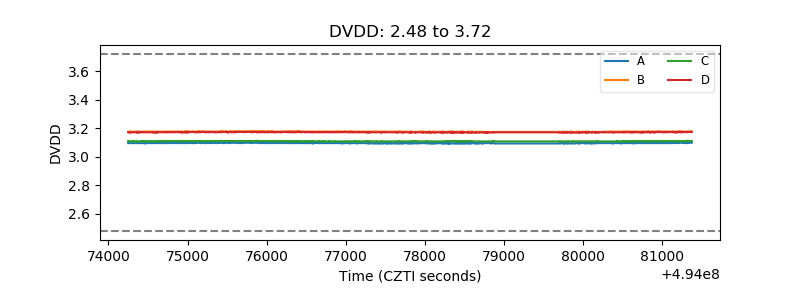 |
| Temperature 1 | 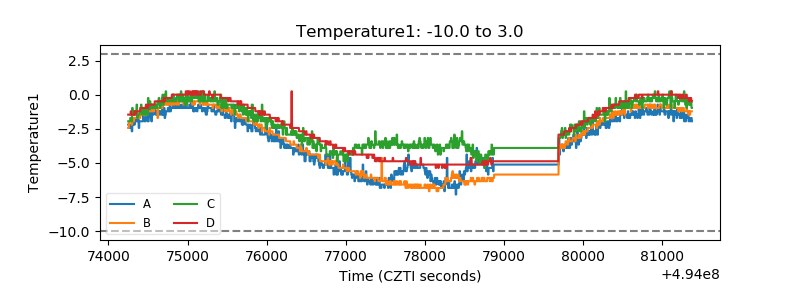 |
| Veto HV Monitor | 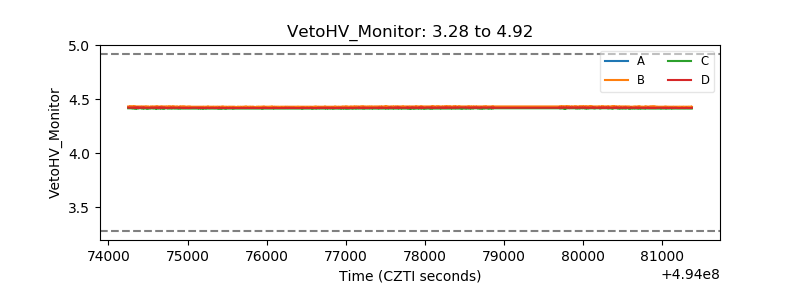 |
| Veto LLD | 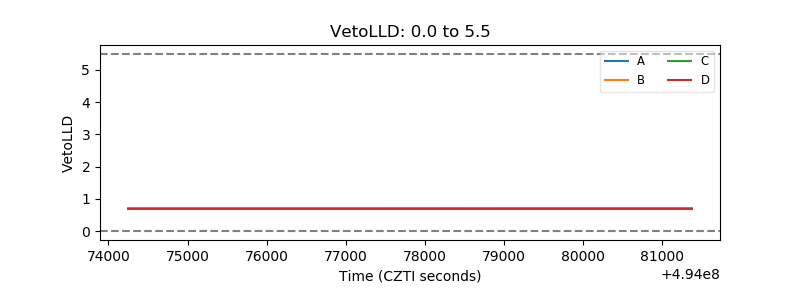 |
| Alpha Counter | 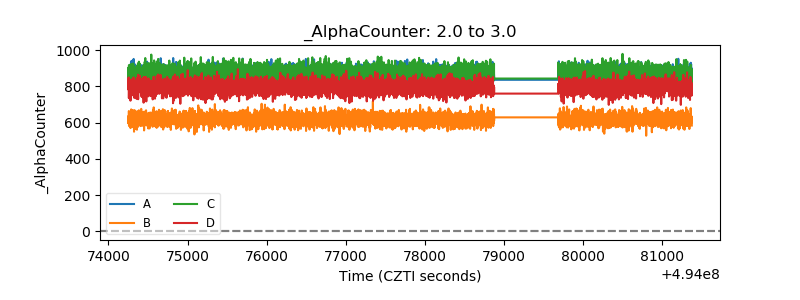 |
| _CPM_Rate | 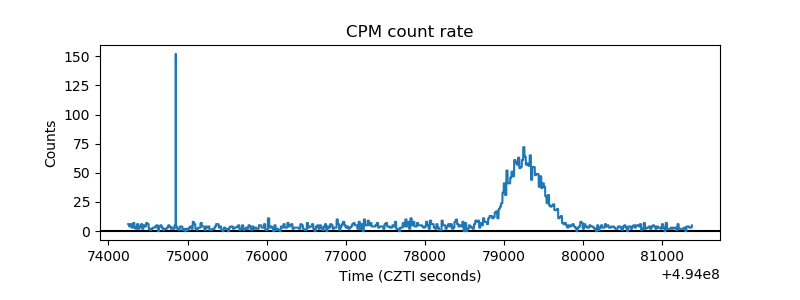 |
| CZT Counter | 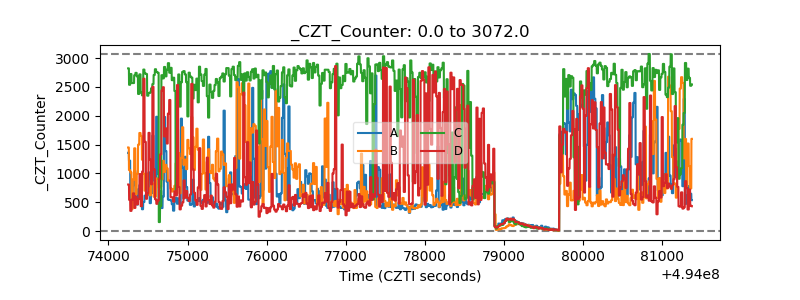 |
| +2.5 Volts monitor |  |
| +5 Volts monitor | 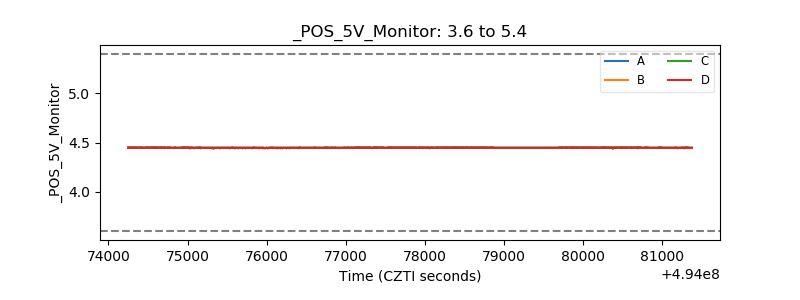 |
| _ROLL_ROT | 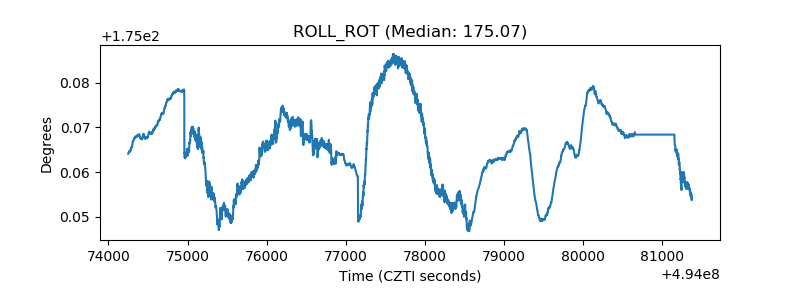 |
| _Roll_DEC | 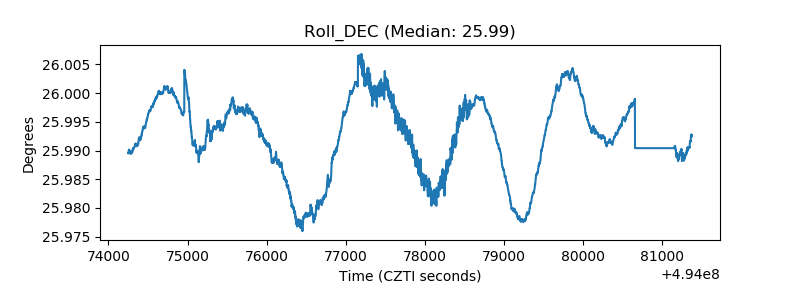 |
| _Roll_RA | 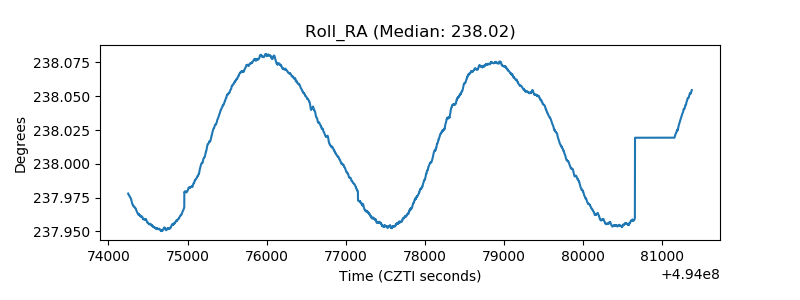 |
| Veto Counter | 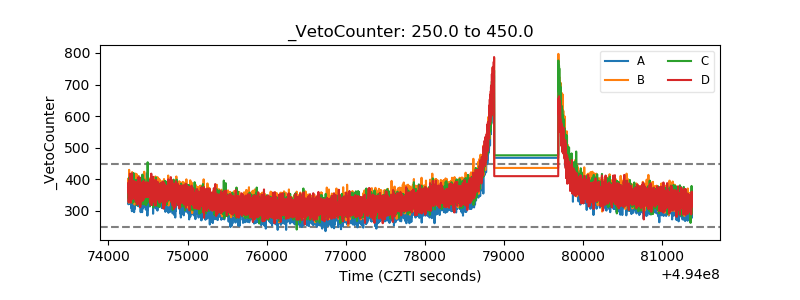 |