| Param | Original file | Final file |
|---|---|---|
| Filename | modeM0/AS1A14_022T05_9000006504_53648cztM0_level2.fits | modeM0/AS1A14_022T05_9000006504_53648cztM0_level2_quad_clean.evt |
| Size (bytes) | 1,015,655,040 | 83,174,400 |
| Size | 968.6 MB | 79.3 MB |
| Events in quadrant A | 9,010,179 | 537,397 |
| Events in quadrant B | 8,441,141 | 571,696 |
| Events in quadrant C | 12,297,685 | 363,916 |
| Events in quadrant D | 7,302,451 | 552,380 |
| Mode SS | |||
|---|---|---|---|
| Quadrant | BADHDUFLAG | Total packets | Discarded packets |
| A | 0 | 146 | 0 |
| B | 0 | 146 | 0 |
| C | 0 | 146 | 0 |
| D | 0 | 146 | 0 |
| Mode M9 | |||
|---|---|---|---|
| Quadrant | BADHDUFLAG | Total packets | Discarded packets |
| A | 0 | 2 | 0 |
| B | 0 | 2 | 0 |
| C | 0 | 2 | 0 |
| D | 0 | 2 | 0 |
| Mode M0 | |||
|---|---|---|---|
| Quadrant | BADHDUFLAG | Total packets | Discarded packets |
| A | 0 | 31660 | 2 |
| B | 0 | 29894 | 2 |
| C | 0 | 41271 | 2 |
| D | 0 | 26557 | 2 |
| Quadrant | Total seconds | Saturated seconds | Saturation percentage |
|---|---|---|---|
| A | 7061 | 1836 | 26.001983% |
| B | 7062 | 1789 | 25.332767% |
| C | 7062 | 3429 | 48.555650% |
| D | 7062 | 1052 | 14.896630% |
Noise dominated data is calculated using 1-second bins in cleaned event files. If a bin has >2000 counts, and if more than 50% of those come from <1% of pixels, then it is considered to be noise-dominated and hence unusable.
| Quadrant | # 1 sec bins | Bins with >0 counts | Bins with >2000 counts | High rate bins dominated by noise | Noise dominated (total time) | Noise dominated (detector-on time) | Marked lightcurve |
|---|---|---|---|---|---|---|---|
| A | 7351 | 7063 | 1409 | 1409 | 19.17% | 19.95% | 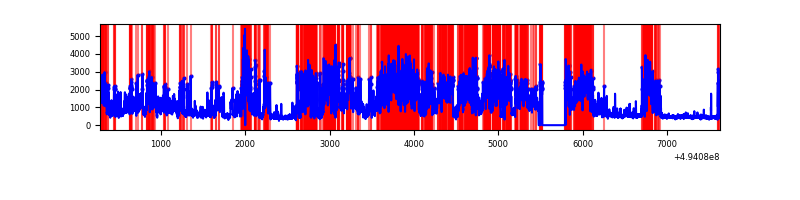 |
| B | 7352 | 7064 | 1212 | 1212 | 16.49% | 17.16% | 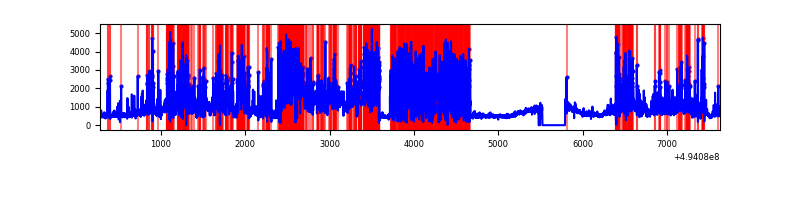 |
| C | 7352 | 7063 | 3072 | 3072 | 41.78% | 43.49% | 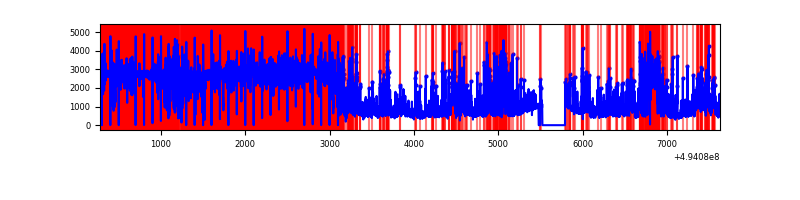 |
| D | 7352 | 7063 | 831 | 831 | 11.30% | 11.77% | 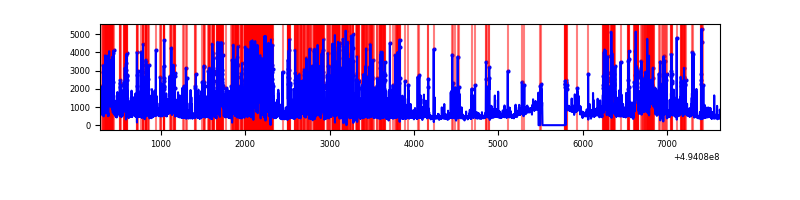 |
Top three noisy pixels from each quadrant. If the there are fewer than three noisy pixels in the level2.evt file, extra rows are filled as -1
| Pixel properties | Quadrant properties | ||||||
|---|---|---|---|---|---|---|---|
| Quadrant | DetID | PixID | Counts | Sigma | Mean | Median | Sigma |
| A | 3 | 78 | 3939128 | 22184.23 | 709 | 691 | 177.5 |
| A | 4 | 191 | 1228573 | 6916.35 | 709 | 691 | 177.5 |
| A | 0 | 8 | 361471 | 2032.18 | 709 | 691 | 177.5 |
| B | 5 | 172 | 2950559 | 20151.1 | 677 | 654 | 146.4 |
| B | 4 | 206 | 1661547 | 11345.73 | 677 | 654 | 146.4 |
| B | 7 | 0 | 663467 | 4527.74 | 677 | 654 | 146.4 |
| C | 1 | 241 | 6759452 | 44358.04 | 547 | 543 | 152.4 |
| C | 15 | 224 | 2346208 | 15394.36 | 547 | 543 | 152.4 |
| C | 13 | 3 | 428985 | 2811.82 | 547 | 543 | 152.4 |
| D | 15 | 93 | 2578018 | 12174.53 | 726 | 692 | 211.7 |
| D | 8 | 176 | 657896 | 3104.44 | 726 | 692 | 211.7 |
| D | 3 | 224 | 218715 | 1029.88 | 726 | 692 | 211.7 |
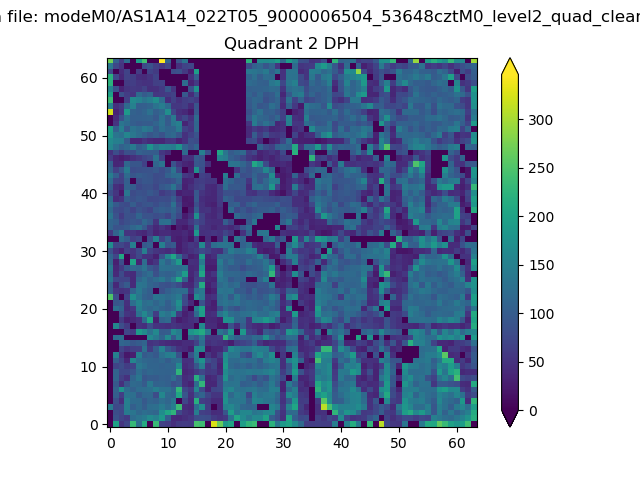
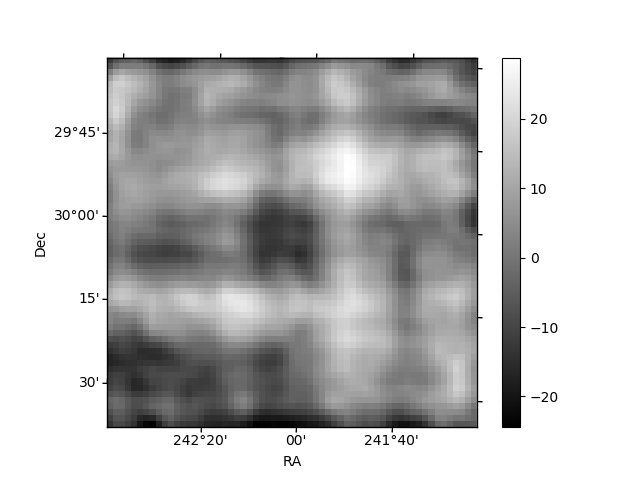
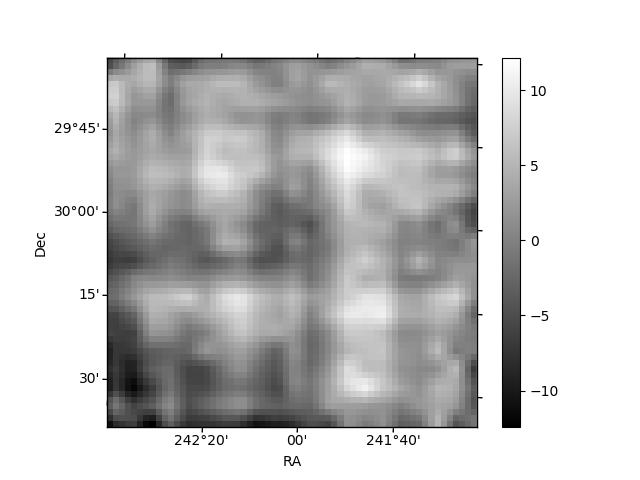
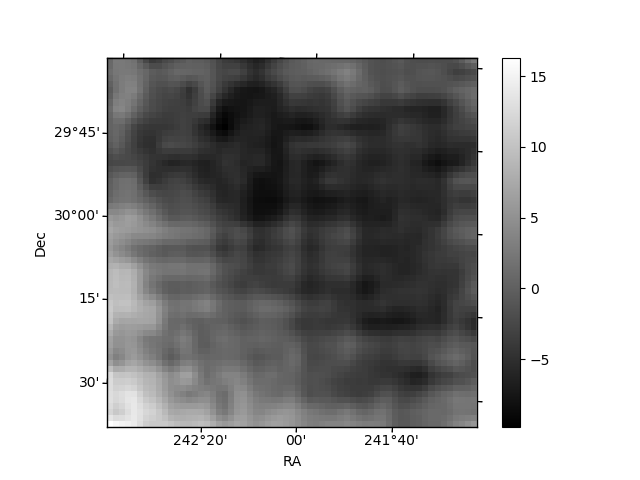
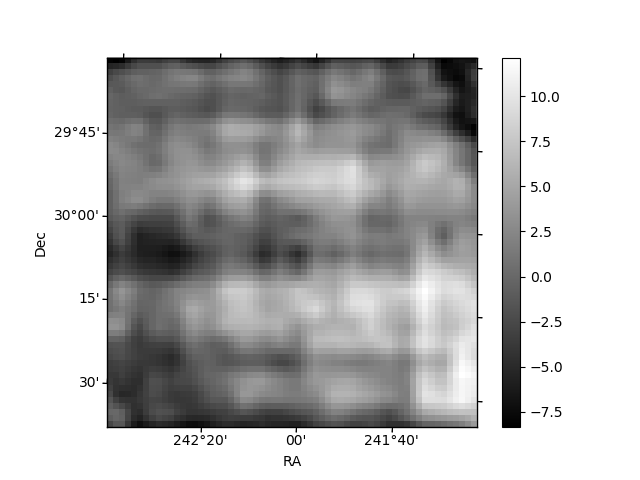
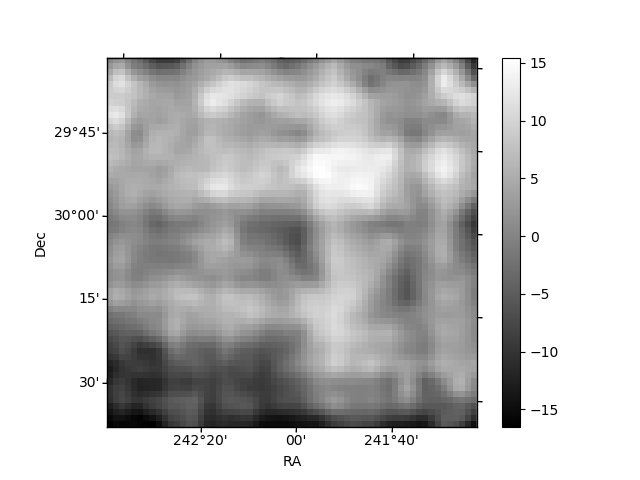
Histogram calculated using DETX and DETY for each event in the final _common_clean file
| Quadrant A | 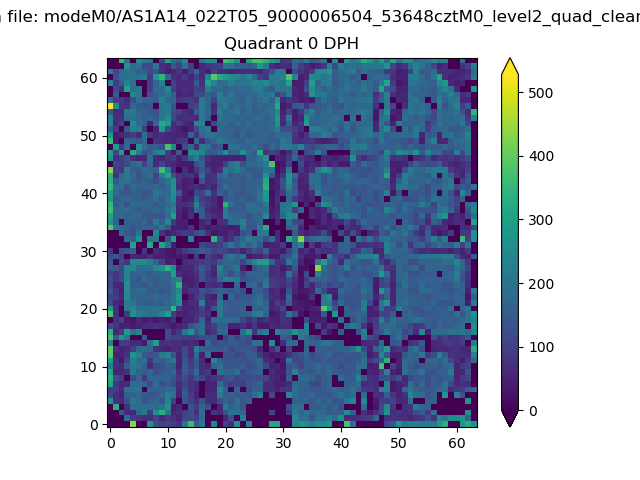 |
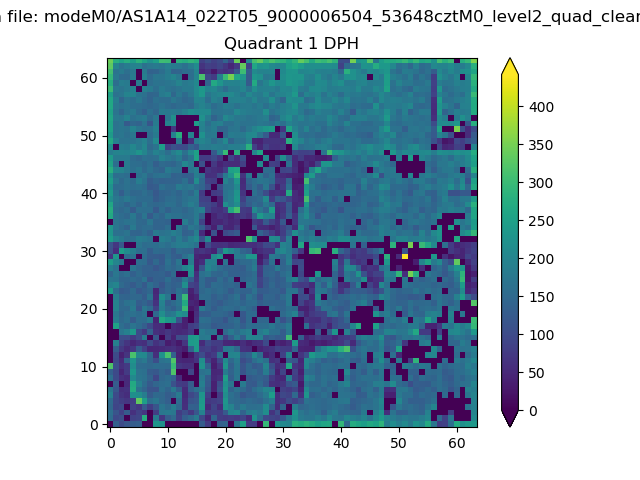 |
Quadrant B |
|---|---|---|---|
| Quadrant D | 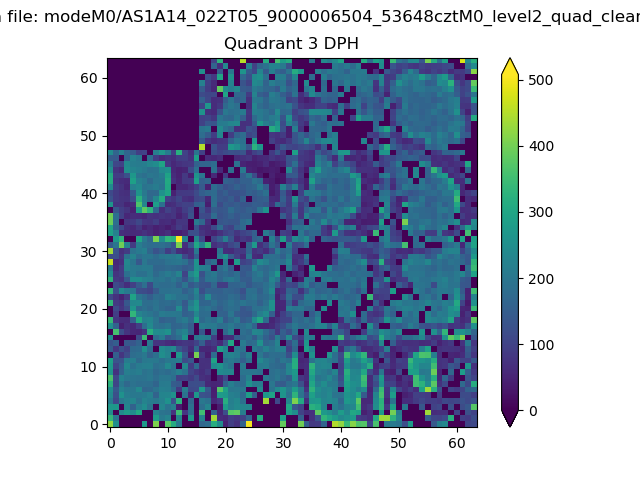 |
 |
Quadrant C |
| Plot type | Count rate plots | Images |
|---|---|---|
| Comparison with Poisson distribution Blue bars denote a histogram of data divided into 1 sec bins. Red curve is a Poisson curve with rate = median count rate of data. |
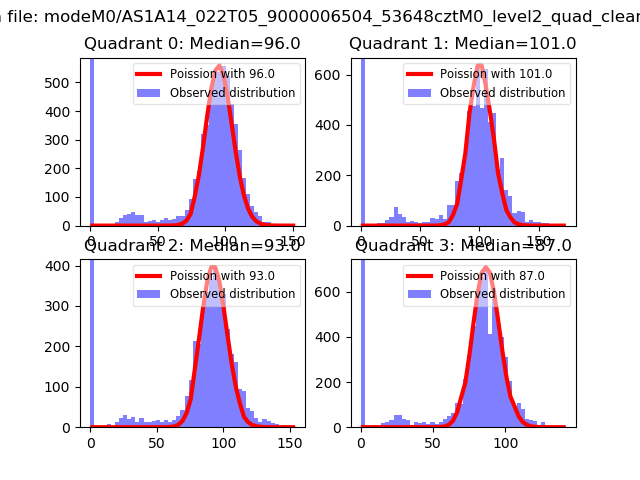 |
 |
| Quadrant-wise count rates Data is divided into 100 sec bins |
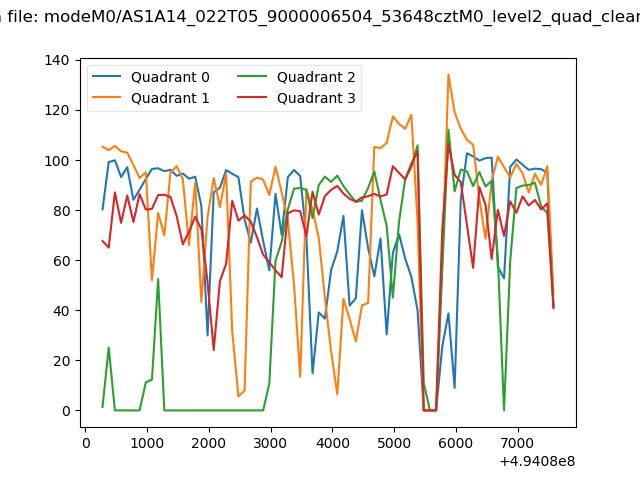 |
|
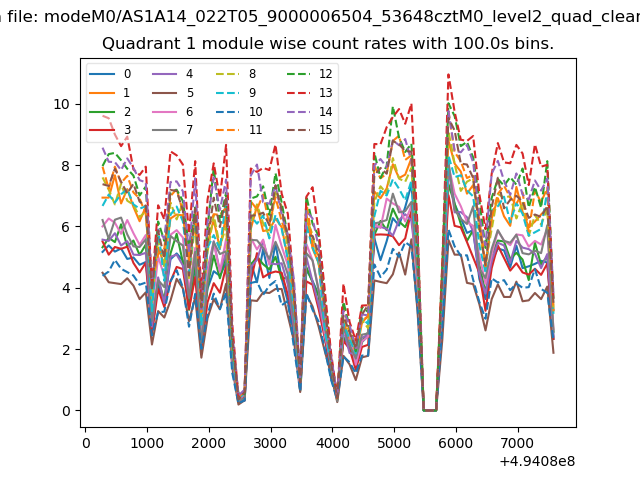
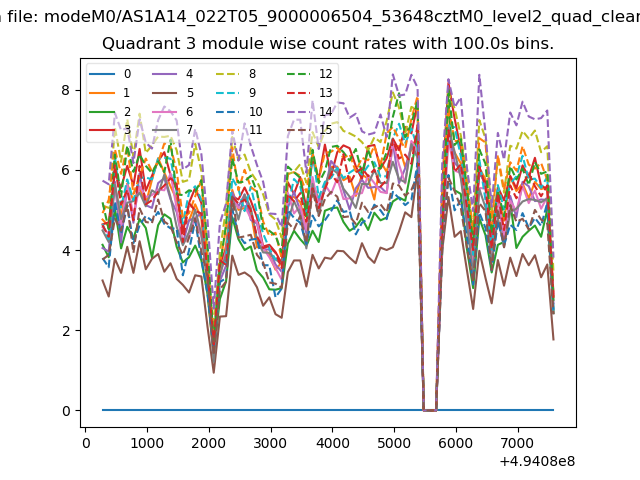
| Module-wise count rates for Quadrant A Data is divided into 100 sec bins |
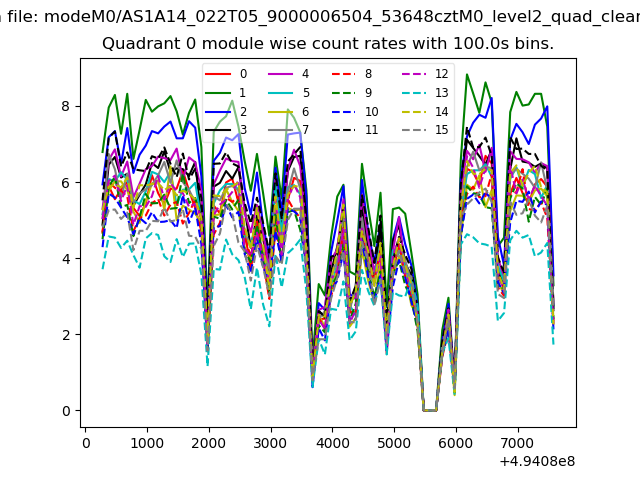 |
 |
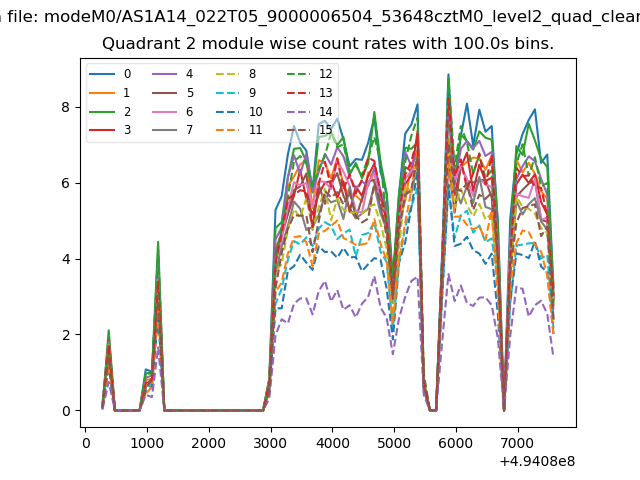
| Module-wise count rates for Quadrant B Data is divided into 100 sec bins |
 |
 |
| Module-wise count rates for Quadrant C Data is divided into 100 sec bins |
 |
 |
| Module-wise count rates for Quadrant D Data is divided into 100 sec bins |
 |
 |
| Parameter | Plot |
|---|---|
| CZT HV Monitor | 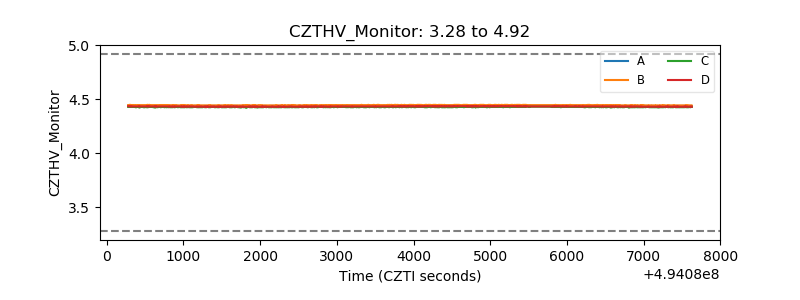 |
| D_VDD | 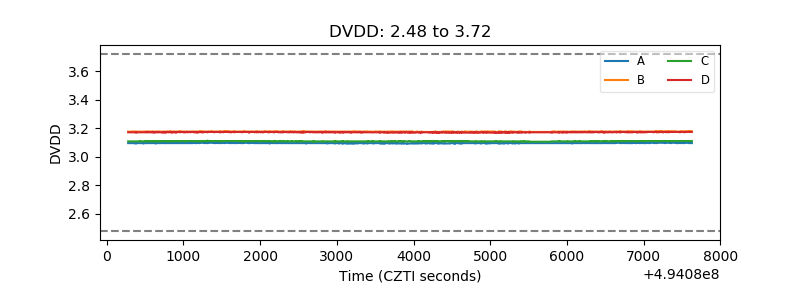 |
| Temperature 1 | 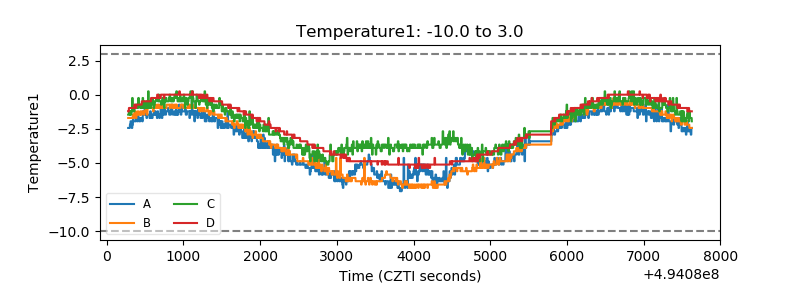 |
| Veto HV Monitor | 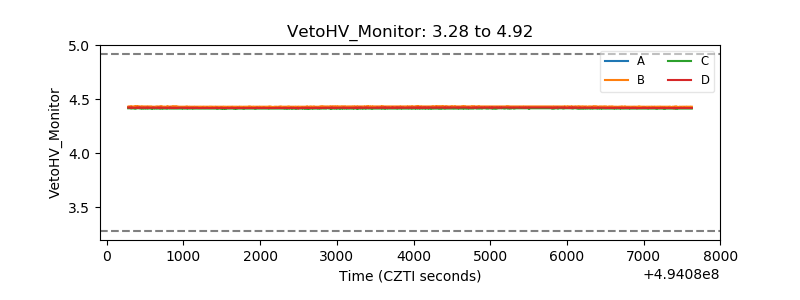 |
| Veto LLD | 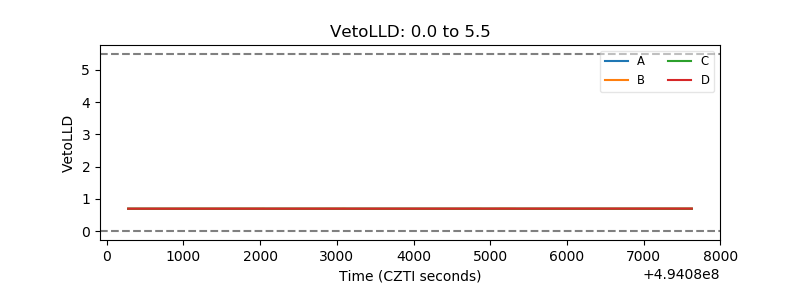 |
| Alpha Counter | 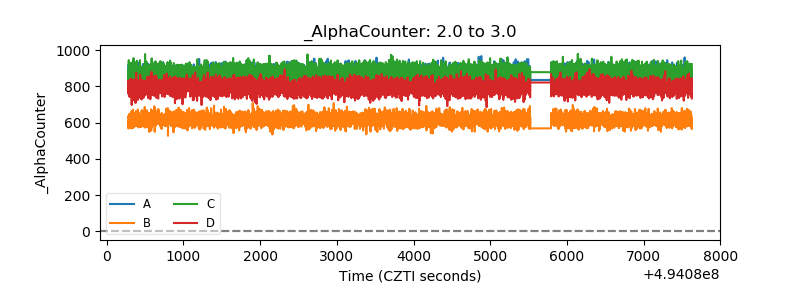 |
| _CPM_Rate | 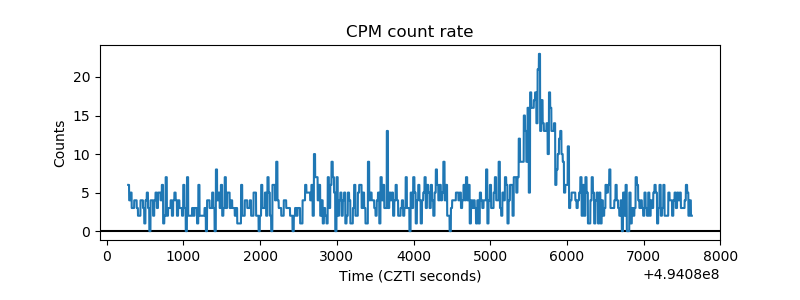 |
| CZT Counter | 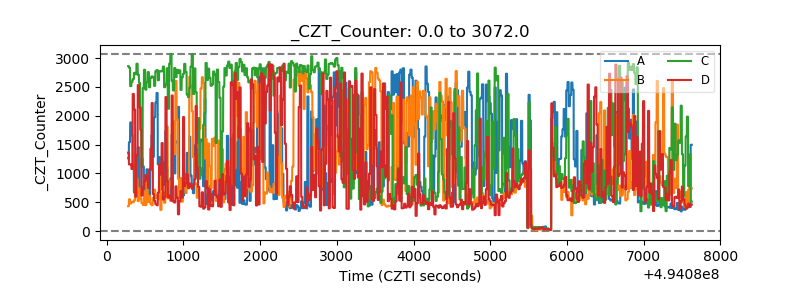 |
| +2.5 Volts monitor |  |
| +5 Volts monitor |  |
| _ROLL_ROT | 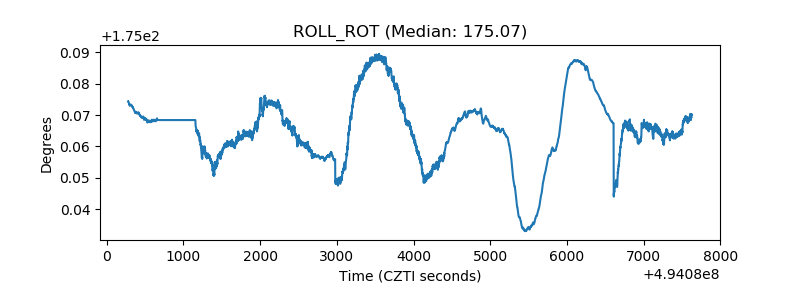 |
| _Roll_DEC | 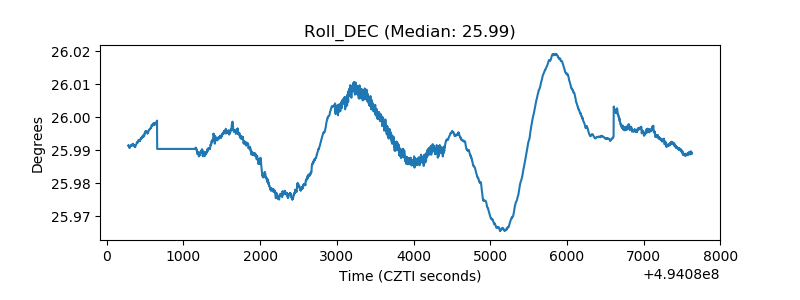 |
| _Roll_RA | 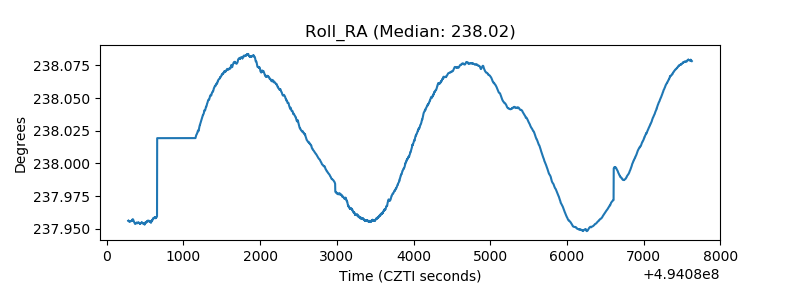 |
| Veto Counter | 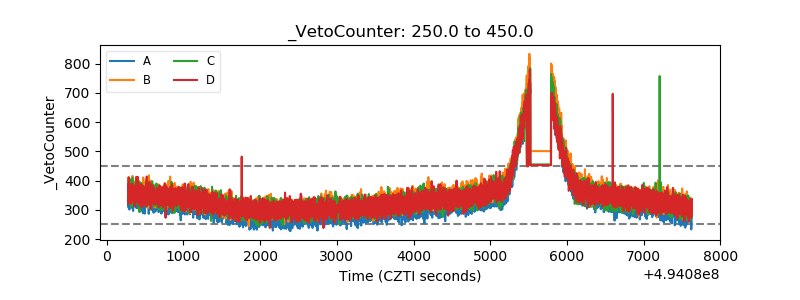 |