| Param | Original file | Final file |
|---|---|---|
| Filename | modeM0/AS1A14_022T05_9000006504_53649cztM0_level2.fits | modeM0/AS1A14_022T05_9000006504_53649cztM0_level2_quad_clean.evt |
| Size (bytes) | 3,191,765,760 | 268,067,520 |
| Size | 3.0 GB | 255.6 MB |
| Events in quadrant A | 24,640,543 | 1,811,361 |
| Events in quadrant B | 25,151,286 | 2,008,061 |
| Events in quadrant C | 42,727,964 | 1,006,785 |
| Events in quadrant D | 23,836,294 | 1,682,399 |
| Mode SS | |||
|---|---|---|---|
| Quadrant | BADHDUFLAG | Total packets | Discarded packets |
| A | 0 | 476 | 0 |
| B | 0 | 476 | 0 |
| C | 0 | 476 | 0 |
| D | 0 | 476 | 0 |
| Mode M9 | |||
|---|---|---|---|
| Quadrant | BADHDUFLAG | Total packets | Discarded packets |
| A | 0 | 20 | 0 |
| B | 0 | 20 | 0 |
| C | 0 | 20 | 0 |
| D | 0 | 20 | 0 |
| Mode M0 | |||
|---|---|---|---|
| Quadrant | BADHDUFLAG | Total packets | Discarded packets |
| A | 0 | 89334 | 4 |
| B | 0 | 90781 | 5 |
| C | 0 | 142688 | 4 |
| D | 0 | 86897 | 4 |
| Quadrant | Total seconds | Saturated seconds | Saturation percentage |
|---|---|---|---|
| A | 23324 | 4512 | 19.344881% |
| B | 23323 | 3982 | 17.073275% |
| C | 23323 | 12912 | 55.361660% |
| D | 23323 | 3897 | 16.708828% |
Noise dominated data is calculated using 1-second bins in cleaned event files. If a bin has >2000 counts, and if more than 50% of those come from <1% of pixels, then it is considered to be noise-dominated and hence unusable.
| Quadrant | # 1 sec bins | Bins with >0 counts | Bins with >2000 counts | High rate bins dominated by noise | Noise dominated (total time) | Noise dominated (detector-on time) | Marked lightcurve |
|---|---|---|---|---|---|---|---|
| A | 25454 | 23328 | 3363 | 3363 | 13.21% | 14.42% | 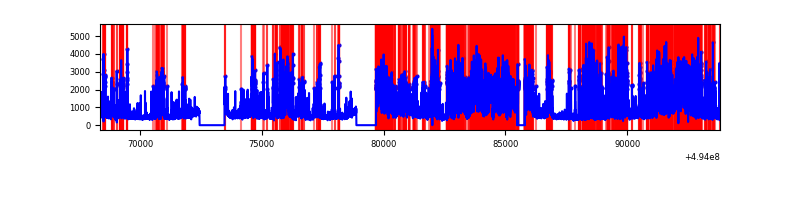 |
| B | 25453 | 23327 | 2766 | 2766 | 10.87% | 11.86% | 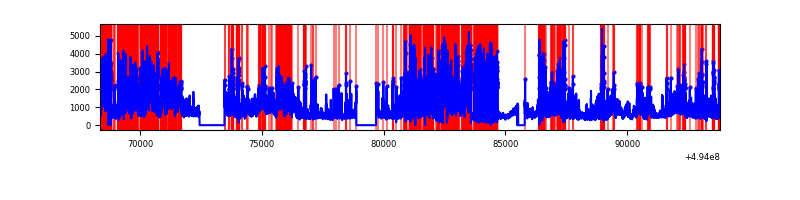 |
| C | 25452 | 23324 | 11701 | 11701 | 45.97% | 50.17% | 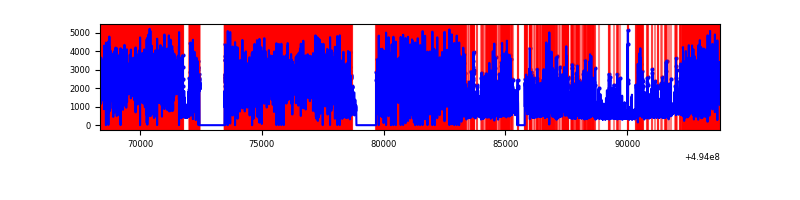 |
| D | 25453 | 23325 | 3053 | 3053 | 11.99% | 13.09% | 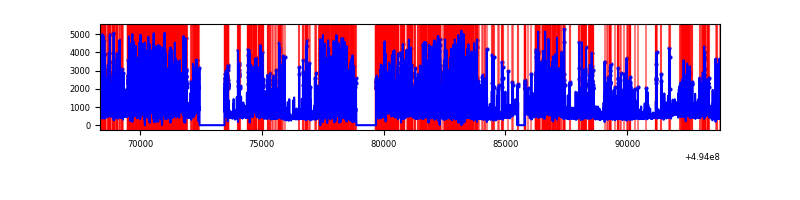 |
Top three noisy pixels from each quadrant. If the there are fewer than three noisy pixels in the level2.evt file, extra rows are filled as -1
| Pixel properties | Quadrant properties | ||||||
|---|---|---|---|---|---|---|---|
| Quadrant | DetID | PixID | Counts | Sigma | Mean | Median | Sigma |
| A | 3 | 78 | 9921913 | 16726.24 | 2395 | 2341 | 593.1 |
| A | 4 | 191 | 1589026 | 2675.45 | 2395 | 2341 | 593.1 |
| A | 15 | 174 | 955434 | 1607.09 | 2395 | 2341 | 593.1 |
| B | 4 | 206 | 7040957 | 14049.09 | 2369 | 2285 | 501.0 |
| B | 5 | 172 | 4041790 | 8062.79 | 2369 | 2285 | 501.0 |
| B | 7 | 0 | 1761410 | 3511.19 | 2369 | 2285 | 501.0 |
| C | 1 | 241 | 25544616 | 54121.29 | 1712 | 1699 | 472.0 |
| C | 15 | 224 | 6416951 | 13592.88 | 1712 | 1699 | 472.0 |
| C | 13 | 3 | 1638294 | 3467.68 | 1712 | 1699 | 472.0 |
| D | 8 | 176 | 5652052 | 8272.6 | 2352 | 2244 | 683.0 |
| D | 15 | 93 | 4572091 | 6691.29 | 2352 | 2244 | 683.0 |
| D | 10 | 172 | 636182 | 928.23 | 2352 | 2244 | 683.0 |
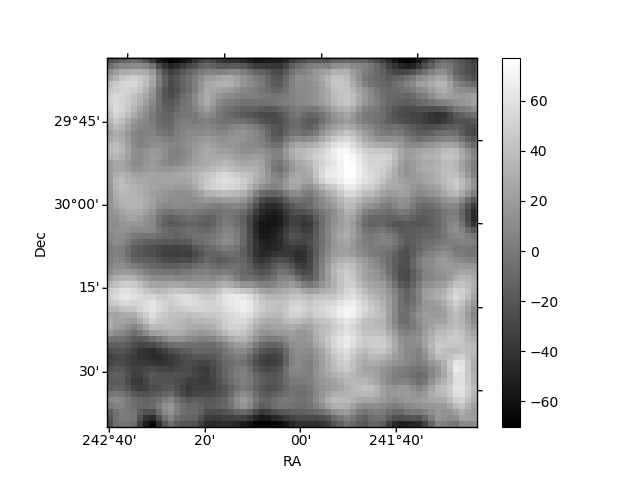
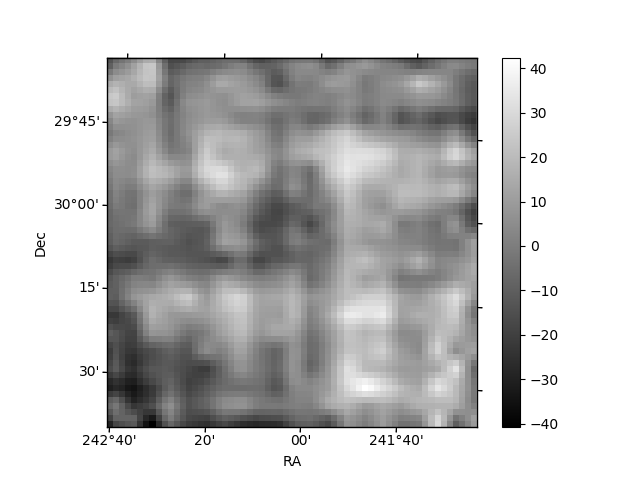
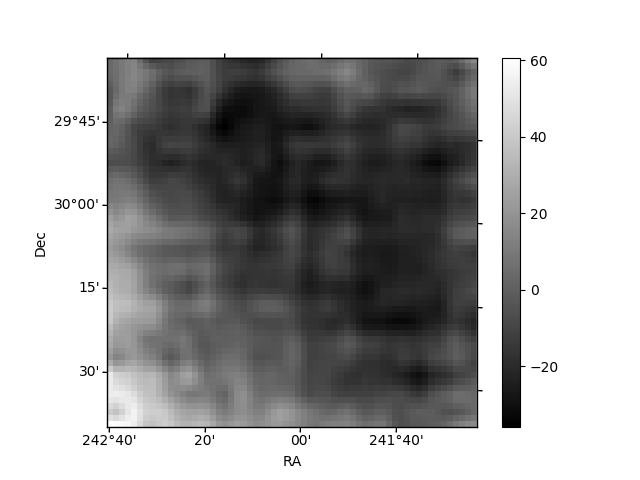
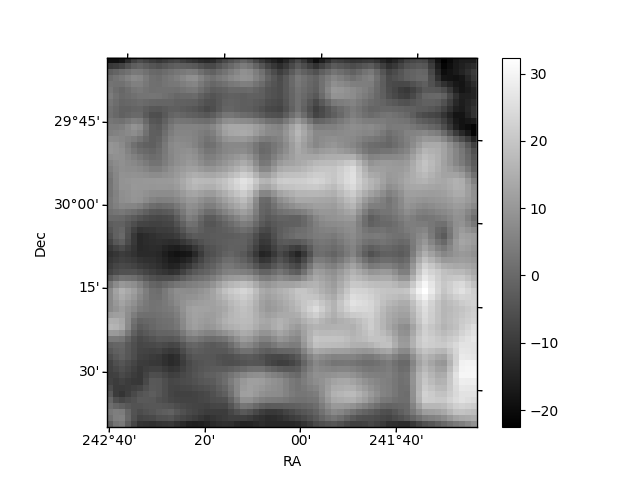
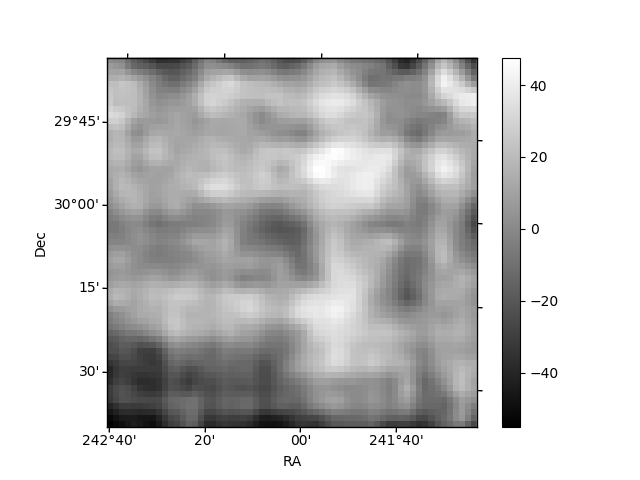
Histogram calculated using DETX and DETY for each event in the final _common_clean file
| Quadrant A | 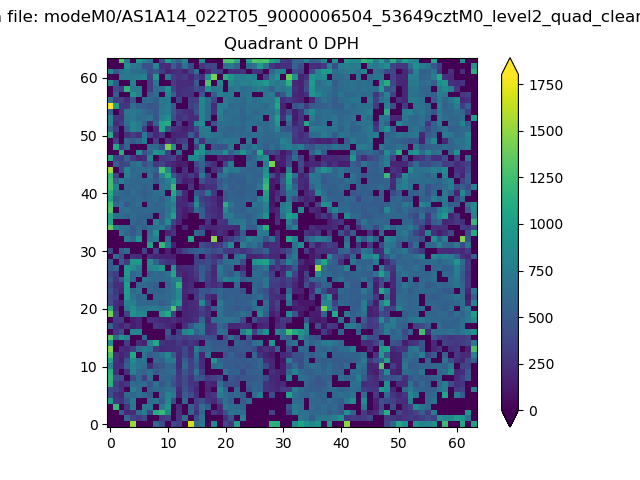 |
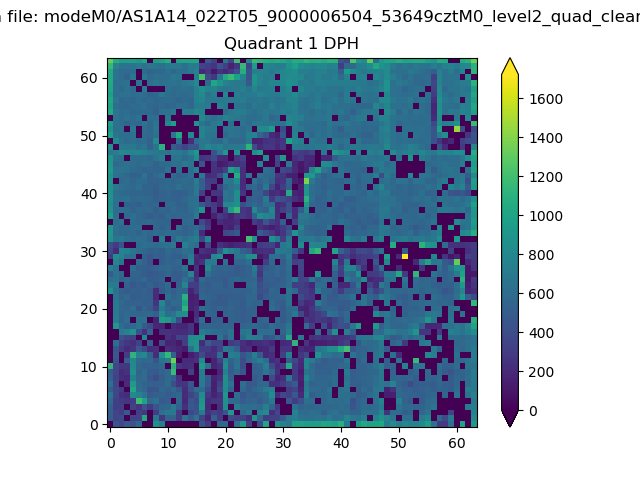 |
Quadrant B |
|---|---|---|---|
| Quadrant D | 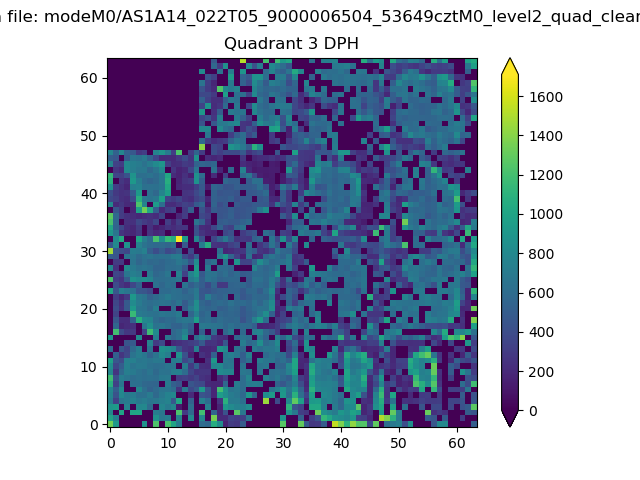 |
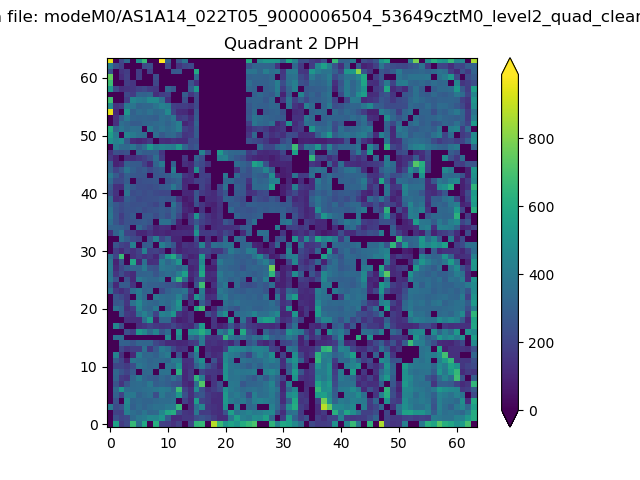 |
Quadrant C |
| Plot type | Count rate plots | Images |
|---|---|---|
| Comparison with Poisson distribution Blue bars denote a histogram of data divided into 1 sec bins. Red curve is a Poisson curve with rate = median count rate of data. |
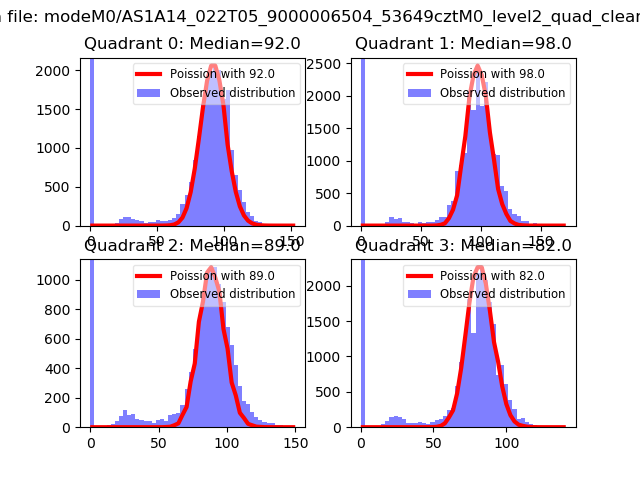 |
 |
| Quadrant-wise count rates Data is divided into 100 sec bins |
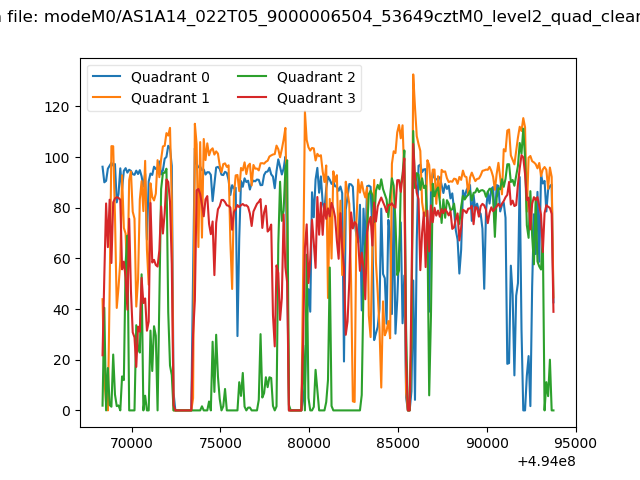 |
|
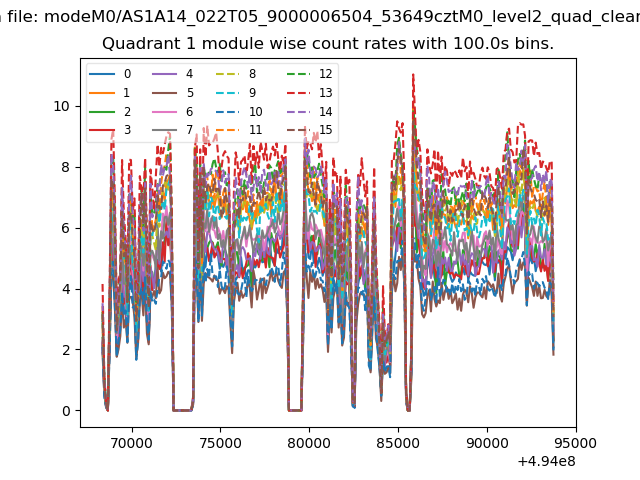
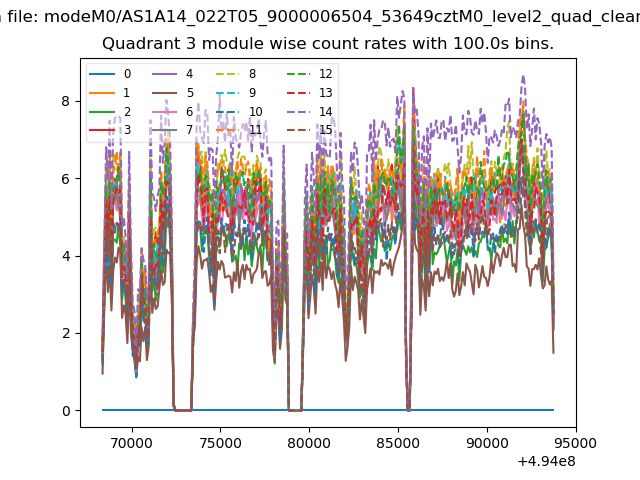
| Module-wise count rates for Quadrant A Data is divided into 100 sec bins |
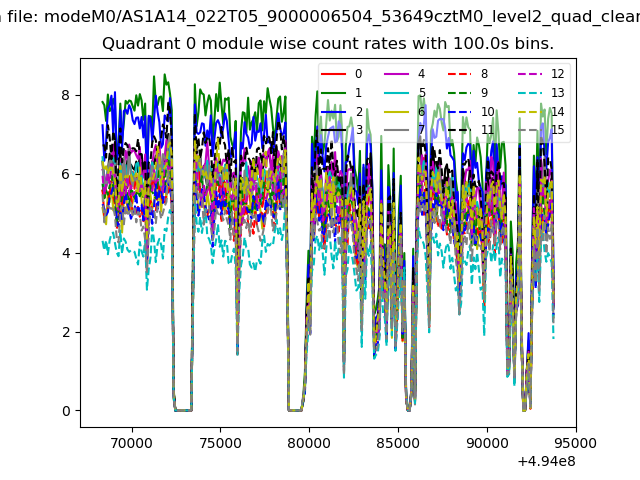 |
 |
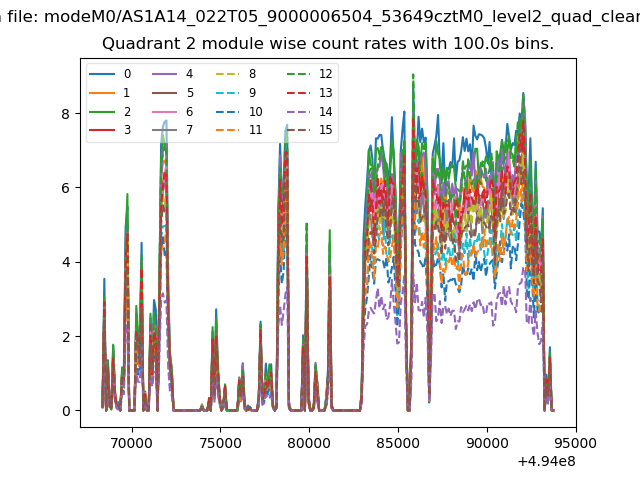
| Module-wise count rates for Quadrant B Data is divided into 100 sec bins |
 |
 |
| Module-wise count rates for Quadrant C Data is divided into 100 sec bins |
 |
 |
| Module-wise count rates for Quadrant D Data is divided into 100 sec bins |
 |
 |
| Parameter | Plot |
|---|---|
| CZT HV Monitor | 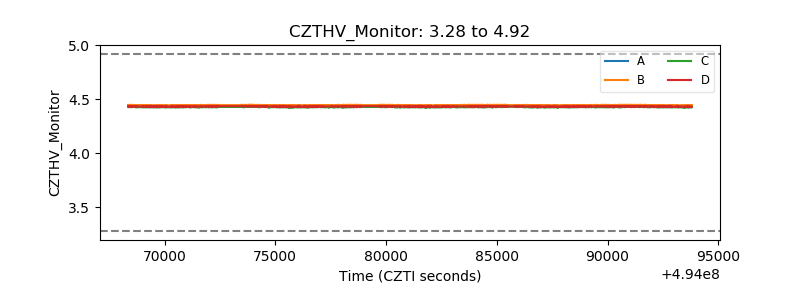 |
| D_VDD | 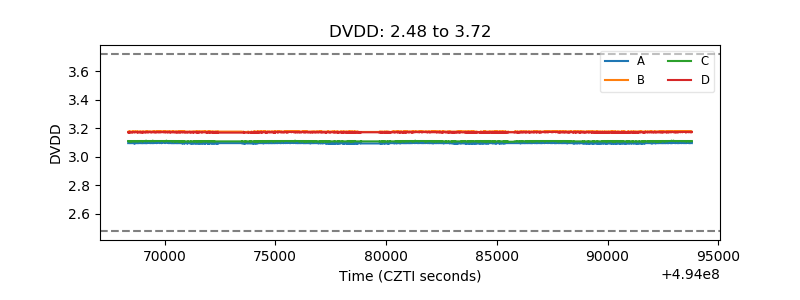 |
| Temperature 1 | 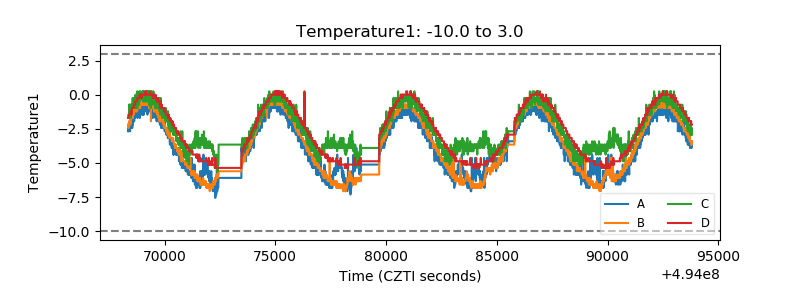 |
| Veto HV Monitor |  |
| Veto LLD | 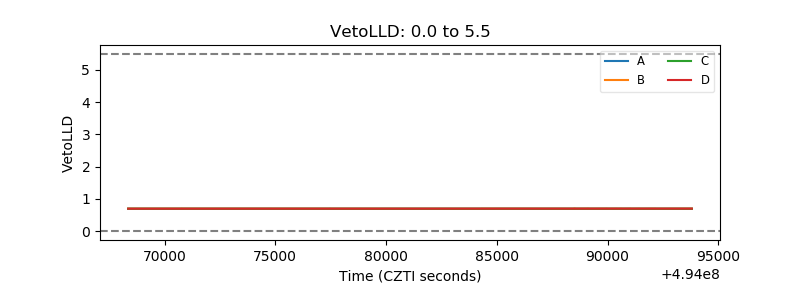 |
| Alpha Counter | 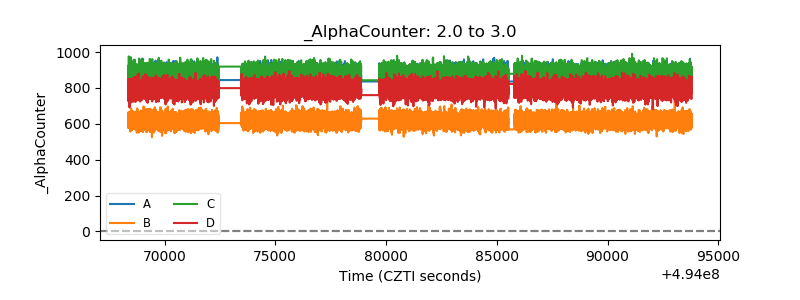 |
| _CPM_Rate | 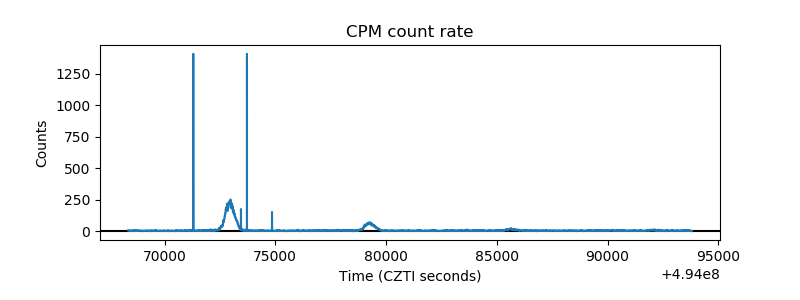 |
| CZT Counter | 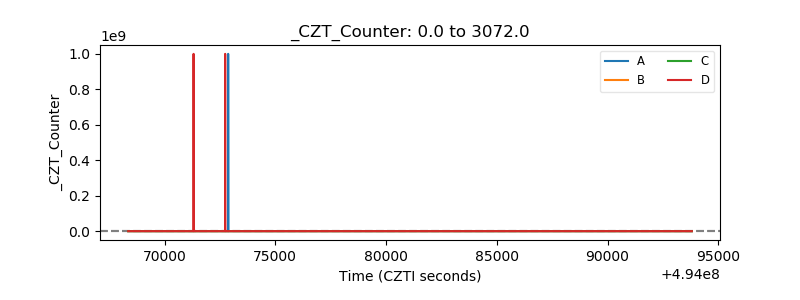 |
| +2.5 Volts monitor |  |
| +5 Volts monitor |  |
| _ROLL_ROT | 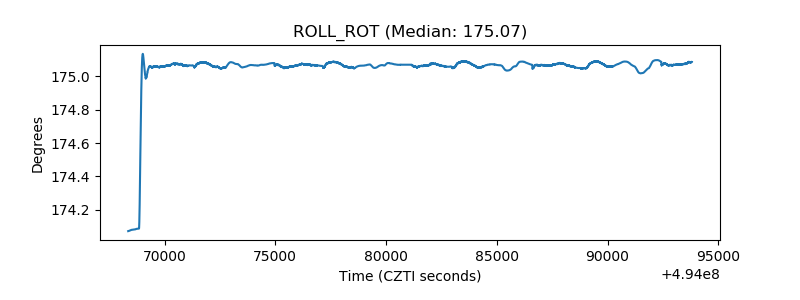 |
| _Roll_DEC | 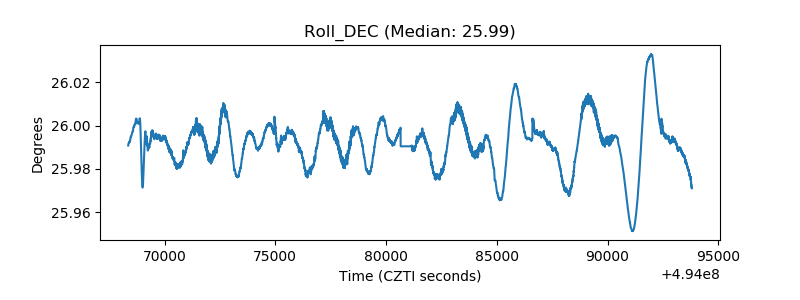 |
| _Roll_RA | 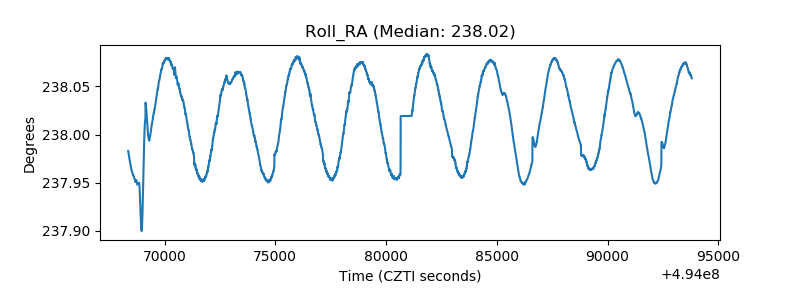 |
| Veto Counter | 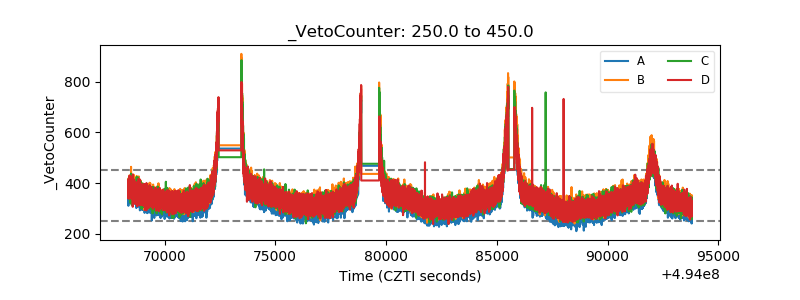 |