| Param | Original file | Final file |
|---|---|---|
| Filename | modeM0/AS1A14_022T05_9000006504_53650cztM0_level2.fits | modeM0/AS1A14_022T05_9000006504_53650cztM0_level2_quad_clean.evt |
| Size (bytes) | 992,456,640 | 96,537,600 |
| Size | 946.5 MB | 92.1 MB |
| Events in quadrant A | 10,661,772 | 528,624 |
| Events in quadrant B | 5,142,178 | 795,173 |
| Events in quadrant C | 13,551,281 | 406,391 |
| Events in quadrant D | 6,770,842 | 642,316 |
| Mode SS | |||
|---|---|---|---|
| Quadrant | BADHDUFLAG | Total packets | Discarded packets |
| A | 0 | 158 | 0 |
| B | 0 | 158 | 0 |
| C | 0 | 158 | 0 |
| D | 0 | 158 | 0 |
| Mode M0 | |||
|---|---|---|---|
| Quadrant | BADHDUFLAG | Total packets | Discarded packets |
| A | 0 | 37152 | 0 |
| B | 0 | 20814 | 0 |
| C | 0 | 45694 | 0 |
| D | 0 | 25642 | 7 |
| Quadrant | Total seconds | Saturated seconds | Saturation percentage |
|---|---|---|---|
| A | 7911 | 2664 | 33.674630% |
| B | 7911 | 187 | 2.363797% |
| C | 7912 | 3743 | 47.307887% |
| D | 7911 | 685 | 8.658829% |
Noise dominated data is calculated using 1-second bins in cleaned event files. If a bin has >2000 counts, and if more than 50% of those come from <1% of pixels, then it is considered to be noise-dominated and hence unusable.
| Quadrant | # 1 sec bins | Bins with >0 counts | Bins with >2000 counts | High rate bins dominated by noise | Noise dominated (total time) | Noise dominated (detector-on time) | Marked lightcurve |
|---|---|---|---|---|---|---|---|
| A | 7911 | 7911 | 2150 | 2150 | 27.18% | 27.18% | 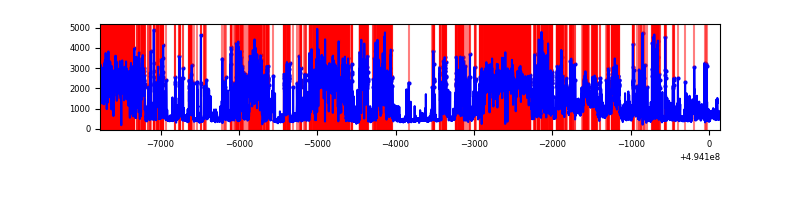 |
| B | 7911 | 7911 | 110 | 110 | 1.39% | 1.39% | 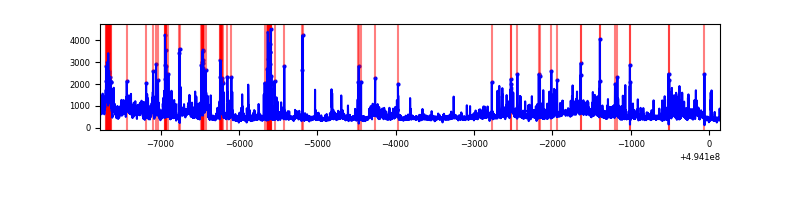 |
| C | 7912 | 7912 | 3330 | 3330 | 42.09% | 42.09% | 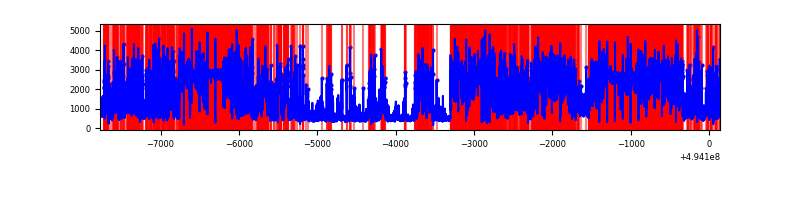 |
| D | 7912 | 7912 | 601 | 601 | 7.60% | 7.60% | 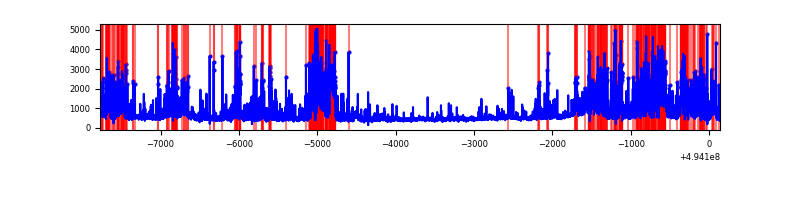 |
Top three noisy pixels from each quadrant. If the there are fewer than three noisy pixels in the level2.evt file, extra rows are filled as -1
| Pixel properties | Quadrant properties | ||||||
|---|---|---|---|---|---|---|---|
| Quadrant | DetID | PixID | Counts | Sigma | Mean | Median | Sigma |
| A | 3 | 78 | 5360258 | 29546.33 | 728 | 711 | 181.4 |
| A | 3 | 63 | 1352800 | 7453.85 | 728 | 711 | 181.4 |
| A | 10 | 253 | 472886 | 2603.03 | 728 | 711 | 181.4 |
| B | 5 | 172 | 491609 | 2727.39 | 837 | 806 | 180.0 |
| B | 7 | 0 | 490944 | 2723.69 | 837 | 806 | 180.0 |
| B | 5 | 185 | 460888 | 2556.67 | 837 | 806 | 180.0 |
| C | 1 | 241 | 5812717 | 34511.12 | 600 | 594 | 168.4 |
| C | 15 | 224 | 3472351 | 20614.54 | 600 | 594 | 168.4 |
| C | 10 | 22 | 508673 | 3016.86 | 600 | 594 | 168.4 |
| D | 8 | 176 | 1749693 | 7365.23 | 811 | 774 | 237.5 |
| D | 10 | 172 | 356535 | 1498.22 | 811 | 774 | 237.5 |
| D | 13 | 153 | 336928 | 1415.65 | 811 | 774 | 237.5 |
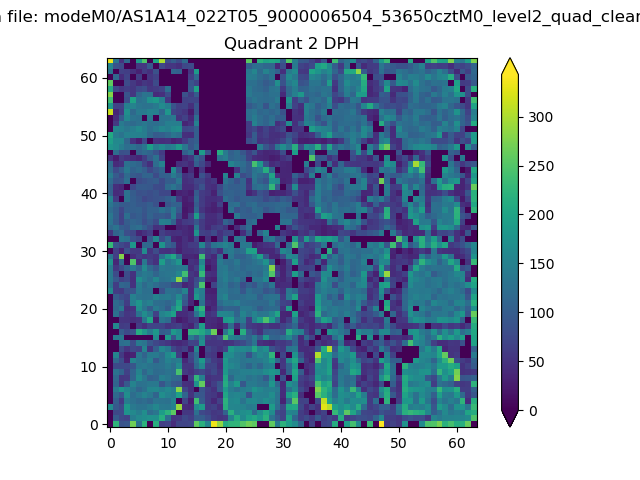
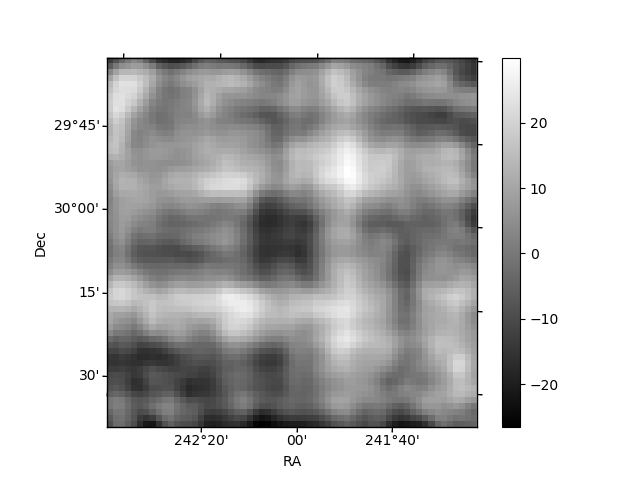
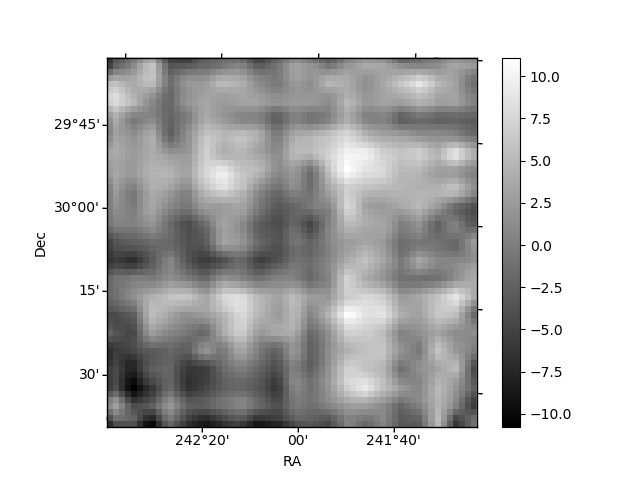
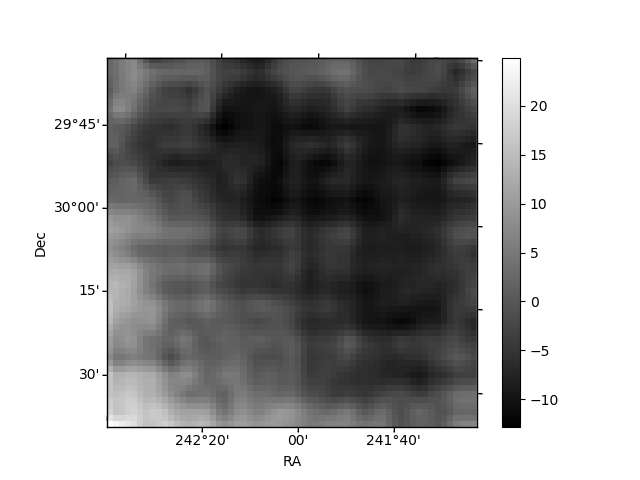
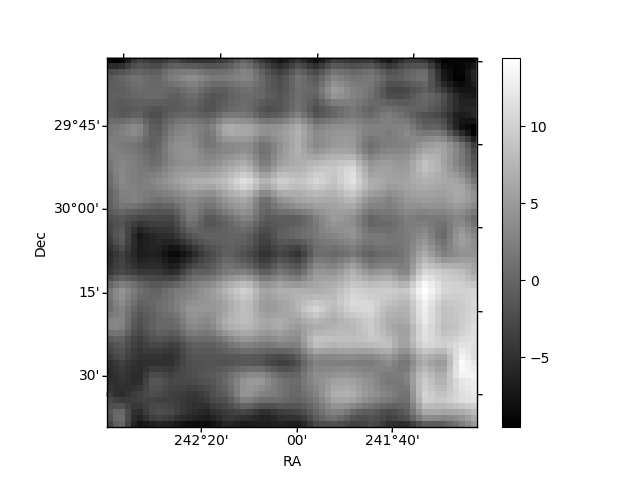
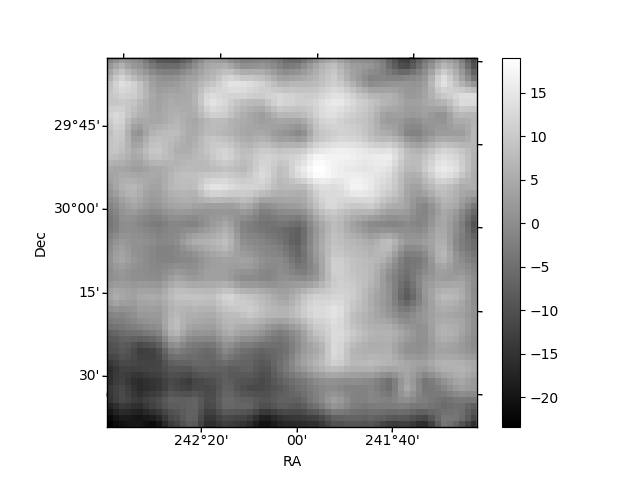
Histogram calculated using DETX and DETY for each event in the final _common_clean file
| Quadrant A | 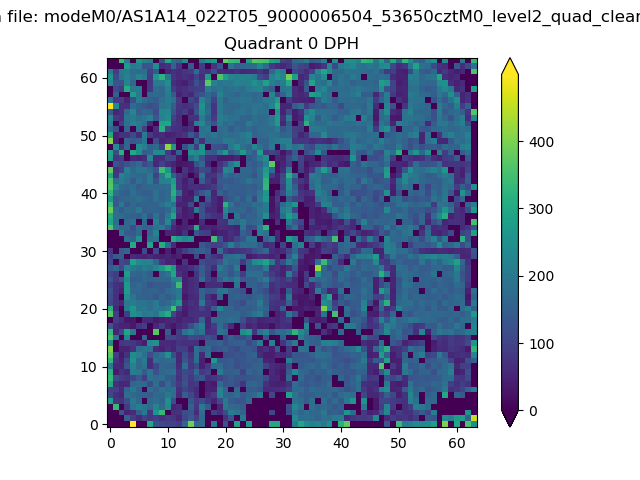 |
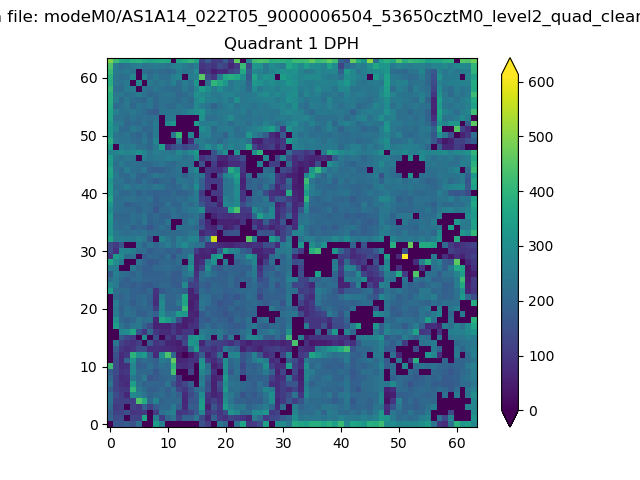 |
Quadrant B |
|---|---|---|---|
| Quadrant D | 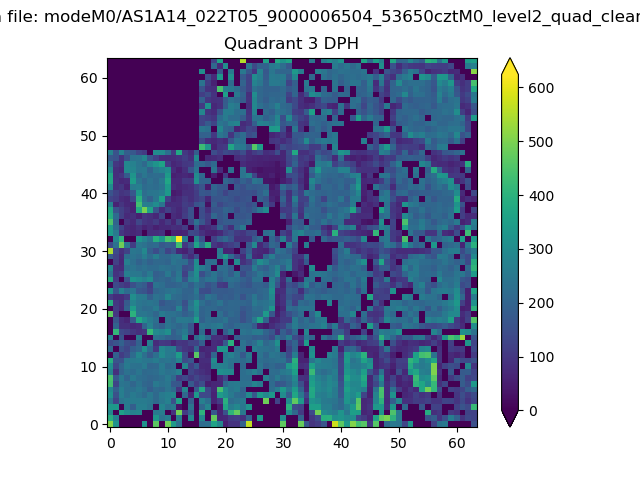 |
 |
Quadrant C |
| Plot type | Count rate plots | Images |
|---|---|---|
| Comparison with Poisson distribution Blue bars denote a histogram of data divided into 1 sec bins. Red curve is a Poisson curve with rate = median count rate of data. |
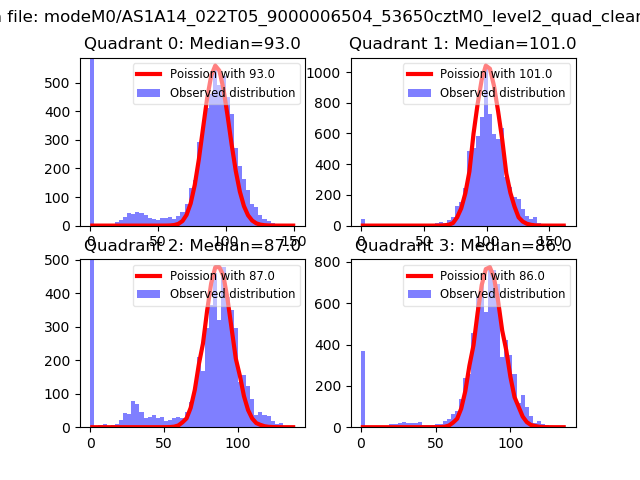 |
 |
| Quadrant-wise count rates Data is divided into 100 sec bins |
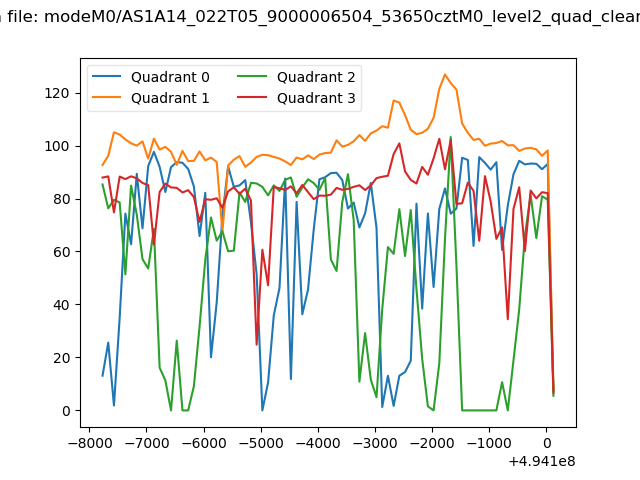 |
|
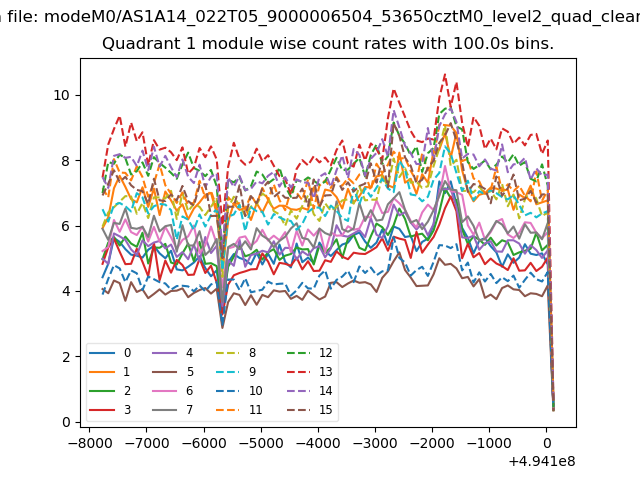
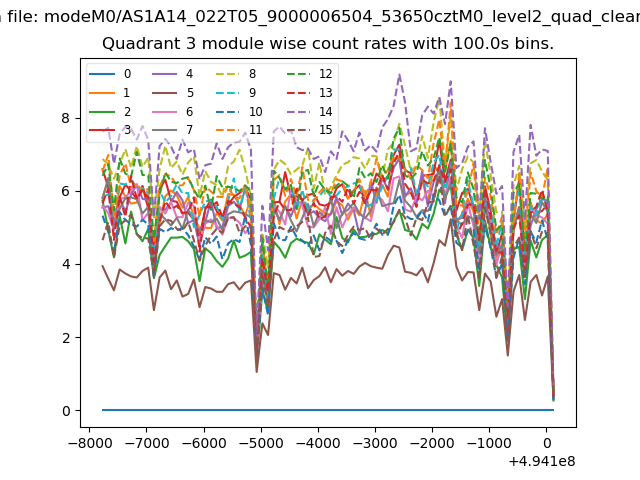
| Module-wise count rates for Quadrant A Data is divided into 100 sec bins |
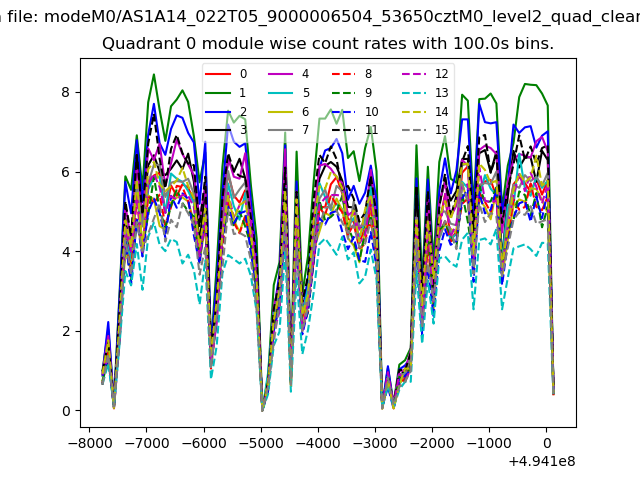 |
 |
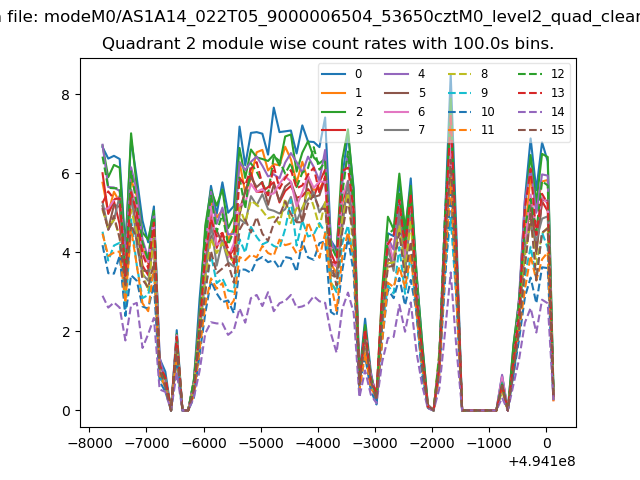
| Module-wise count rates for Quadrant B Data is divided into 100 sec bins |
 |
 |
| Module-wise count rates for Quadrant C Data is divided into 100 sec bins |
 |
 |
| Module-wise count rates for Quadrant D Data is divided into 100 sec bins |
 |
 |
| Parameter | Plot |
|---|---|
| CZT HV Monitor | 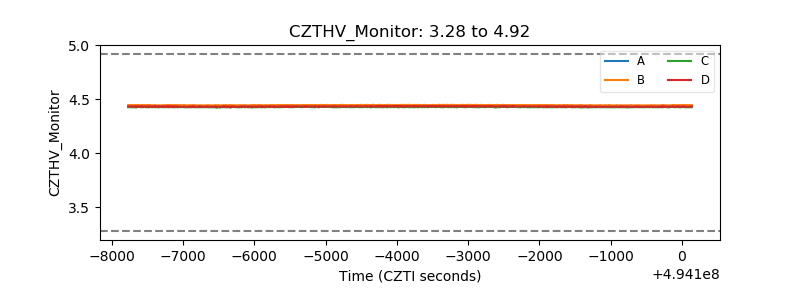 |
| D_VDD | 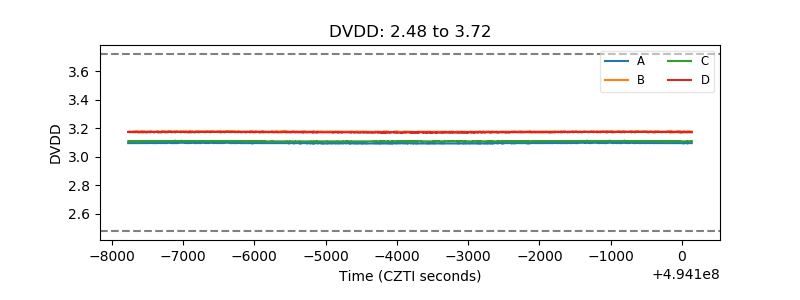 |
| Temperature 1 | 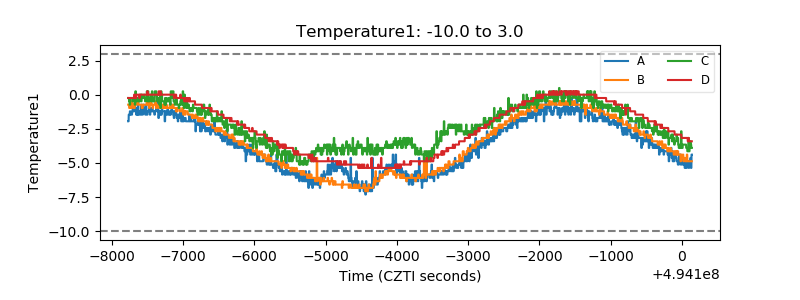 |
| Veto HV Monitor | 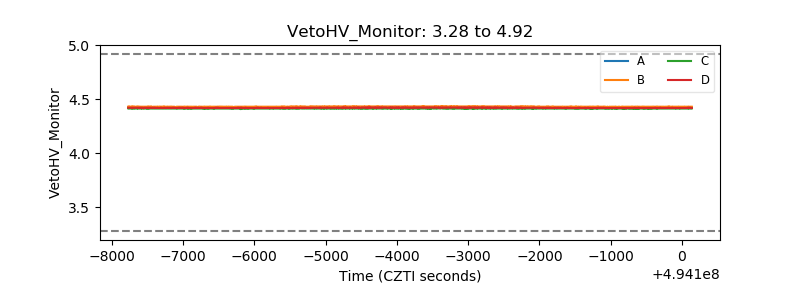 |
| Veto LLD | 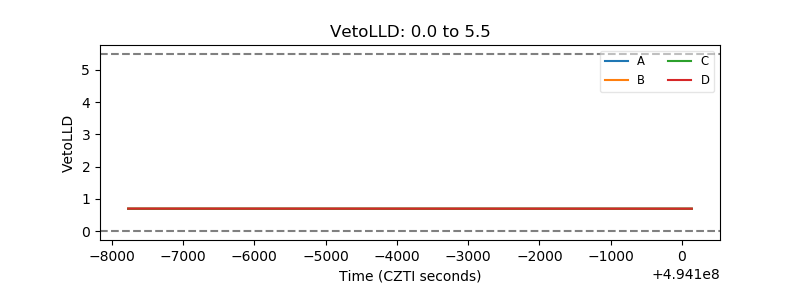 |
| Alpha Counter | 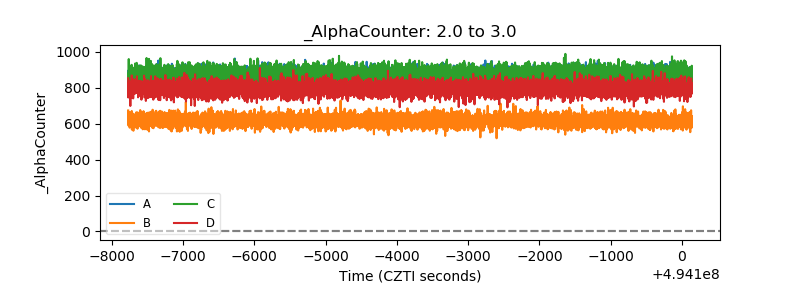 |
| _CPM_Rate | 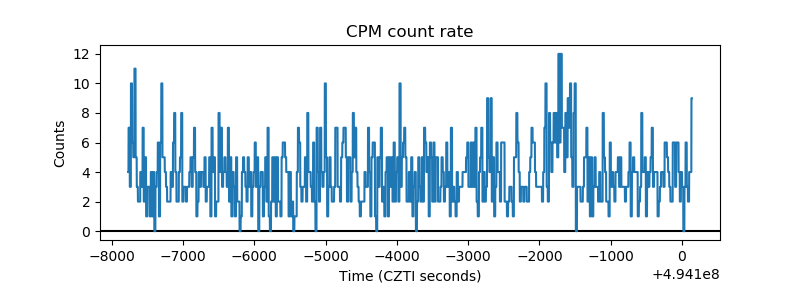 |
| CZT Counter | 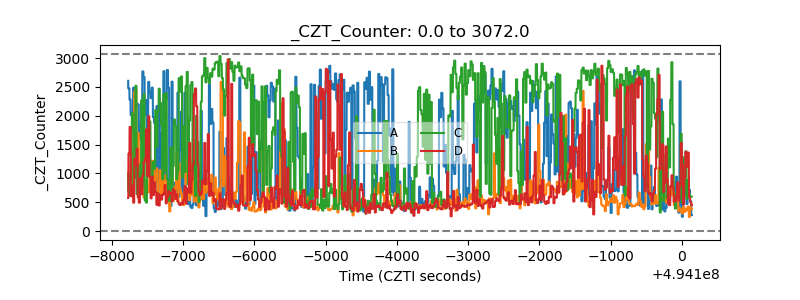 |
| +2.5 Volts monitor | 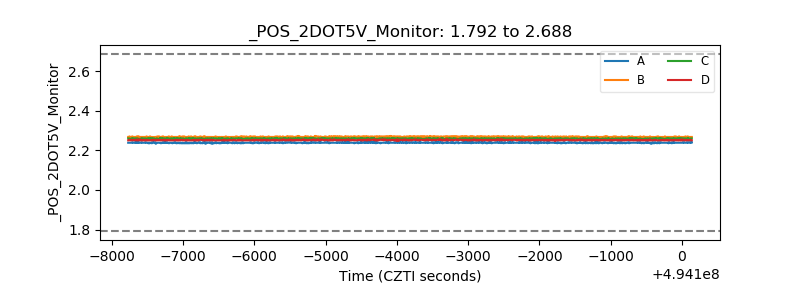 |
| +5 Volts monitor | 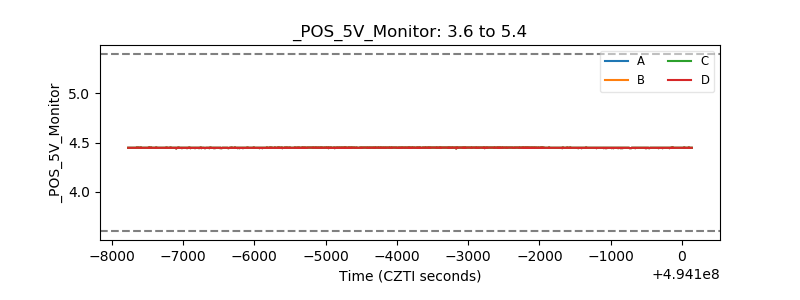 |
| _ROLL_ROT | 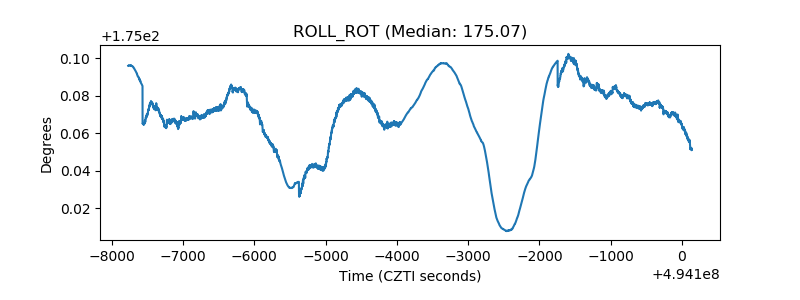 |
| _Roll_DEC | 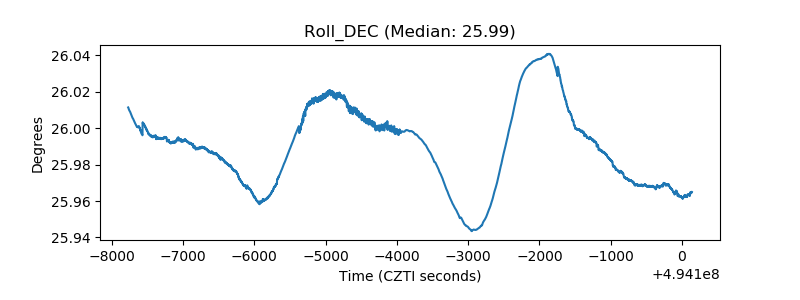 |
| _Roll_RA | 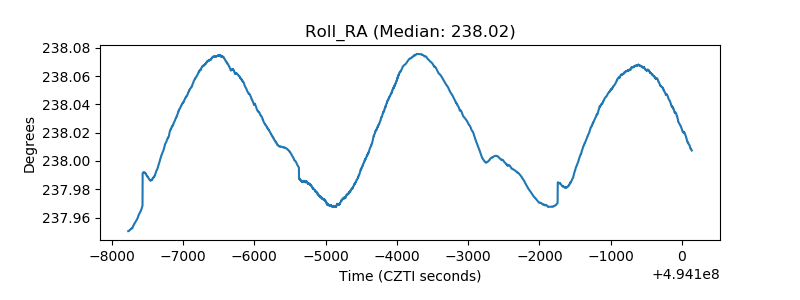 |
| Veto Counter | 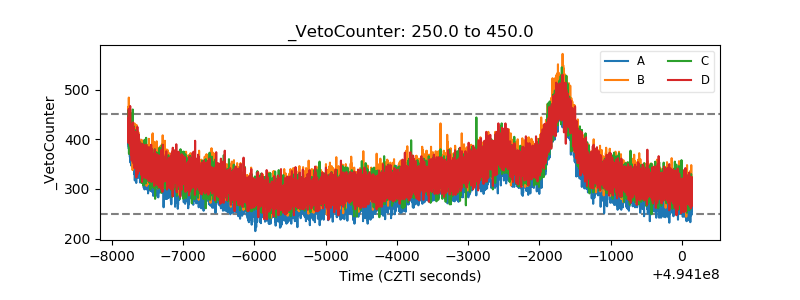 |