| Param | Original file | Final file |
|---|---|---|
| Filename | modeM0/AS1A14_022T05_9000006504_53653cztM0_level2.fits | modeM0/AS1A14_022T05_9000006504_53653cztM0_level2_quad_clean.evt |
| Size (bytes) | 2,050,292,160 | 152,046,720 |
| Size | 1.9 GB | 145.0 MB |
| Events in quadrant A | 23,581,042 | 628,536 |
| Events in quadrant B | 13,772,961 | 1,109,496 |
| Events in quadrant C | 24,661,834 | 725,181 |
| Events in quadrant D | 12,753,891 | 1,131,715 |
| Mode SS | |||
|---|---|---|---|
| Quadrant | BADHDUFLAG | Total packets | Discarded packets |
| A | 0 | 296 | 0 |
| B | 0 | 296 | 0 |
| C | 0 | 296 | 0 |
| D | 0 | 296 | 0 |
| Mode M9 | |||
|---|---|---|---|
| Quadrant | BADHDUFLAG | Total packets | Discarded packets |
| A | 0 | 4 | 0 |
| B | 0 | 4 | 0 |
| C | 0 | 4 | 0 |
| D | 0 | 4 | 0 |
| Mode M0 | |||
|---|---|---|---|
| Quadrant | BADHDUFLAG | Total packets | Discarded packets |
| A | 0 | 80070 | 2 |
| B | 0 | 51070 | 2 |
| C | 0 | 83289 | 2 |
| D | 0 | 48308 | 7 |
| Quadrant | Total seconds | Saturated seconds | Saturation percentage |
|---|---|---|---|
| A | 14591 | 8457 | 57.960387% |
| B | 14591 | 3464 | 23.740662% |
| C | 14592 | 6835 | 46.840735% |
| D | 14589 | 1538 | 10.542189% |
Noise dominated data is calculated using 1-second bins in cleaned event files. If a bin has >2000 counts, and if more than 50% of those come from <1% of pixels, then it is considered to be noise-dominated and hence unusable.
| Quadrant | # 1 sec bins | Bins with >0 counts | Bins with >2000 counts | High rate bins dominated by noise | Noise dominated (total time) | Noise dominated (detector-on time) | Marked lightcurve |
|---|---|---|---|---|---|---|---|
| A | 15097 | 14592 | 5253 | 5253 | 34.79% | 36.00% | 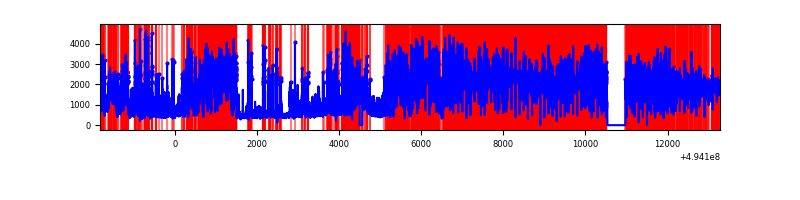 |
| B | 15098 | 14593 | 1806 | 1806 | 11.96% | 12.38% | 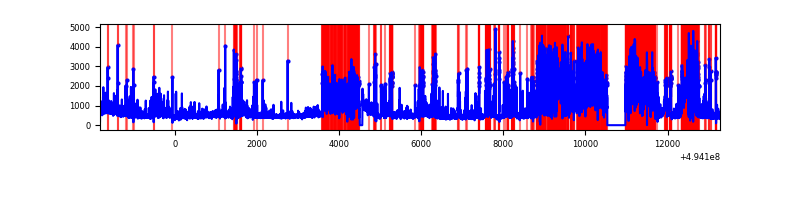 |
| C | 15099 | 14594 | 6174 | 6174 | 40.89% | 42.31% | 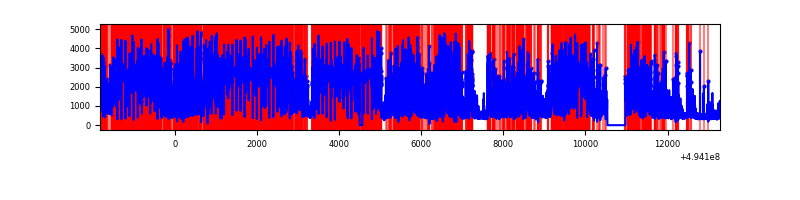 |
| D | 15098 | 14593 | 1316 | 1316 | 8.72% | 9.02% | 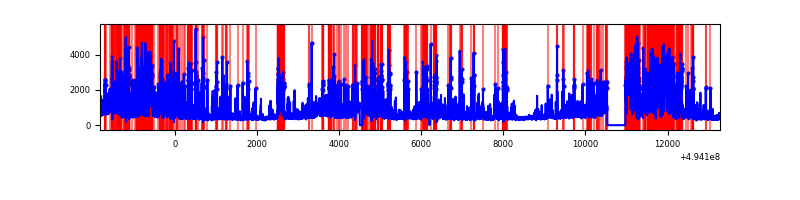 |
Top three noisy pixels from each quadrant. If the there are fewer than three noisy pixels in the level2.evt file, extra rows are filled as -1
| Pixel properties | Quadrant properties | ||||||
|---|---|---|---|---|---|---|---|
| Quadrant | DetID | PixID | Counts | Sigma | Mean | Median | Sigma |
| A | 3 | 78 | 9222535 | 35846.65 | 1027 | 1002 | 257.2 |
| A | 3 | 63 | 8092267 | 31452.98 | 1027 | 1002 | 257.2 |
| A | 14 | 254 | 1135969 | 4411.93 | 1027 | 1002 | 257.2 |
| B | 4 | 206 | 6162423 | 22674.18 | 1279 | 1232 | 271.7 |
| B | 5 | 172 | 713270 | 2620.42 | 1279 | 1232 | 271.7 |
| B | 7 | 0 | 594031 | 2181.6 | 1279 | 1232 | 271.7 |
| C | 1 | 241 | 12001750 | 39225.37 | 1091 | 1082 | 305.9 |
| C | 15 | 224 | 4010254 | 13104.37 | 1091 | 1082 | 305.9 |
| C | 14 | 80 | 939430 | 3067.08 | 1091 | 1082 | 305.9 |
| D | 8 | 176 | 2928996 | 6875.13 | 1470 | 1403 | 425.8 |
| D | 10 | 172 | 669476 | 1568.89 | 1470 | 1403 | 425.8 |
| D | 11 | 245 | 647451 | 1517.17 | 1470 | 1403 | 425.8 |
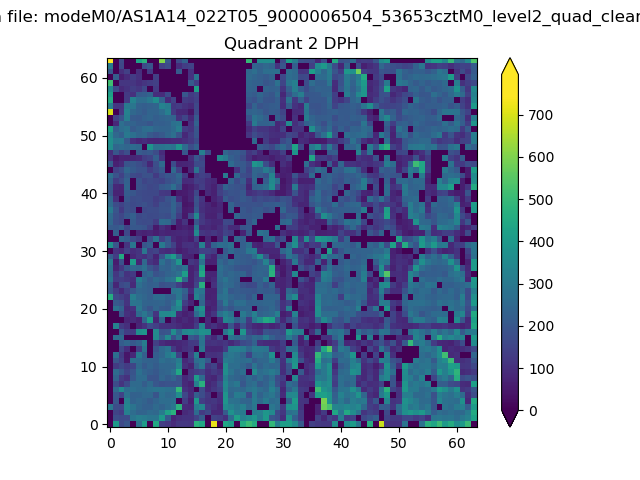
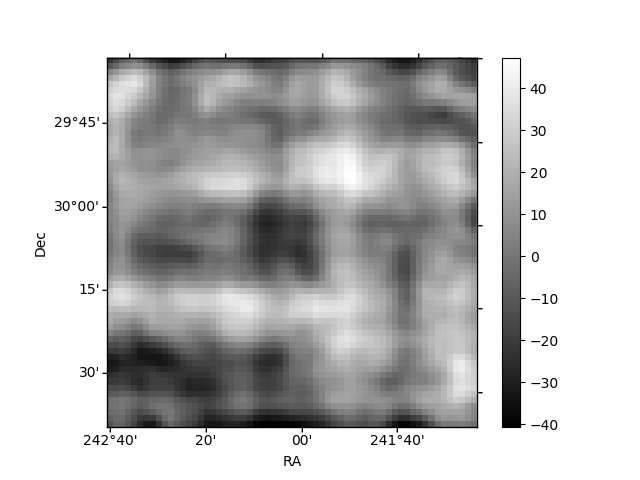
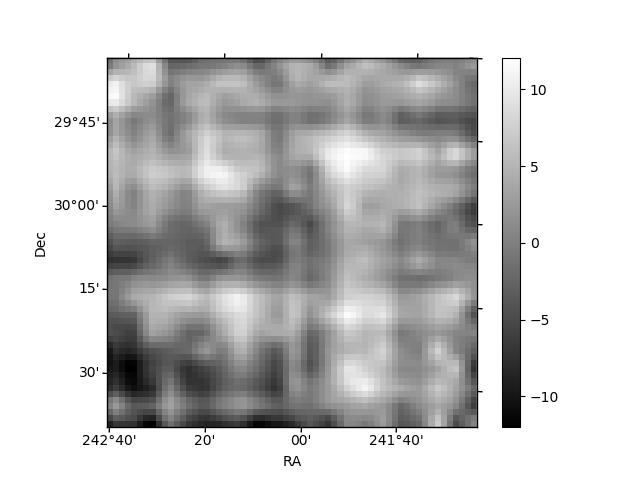
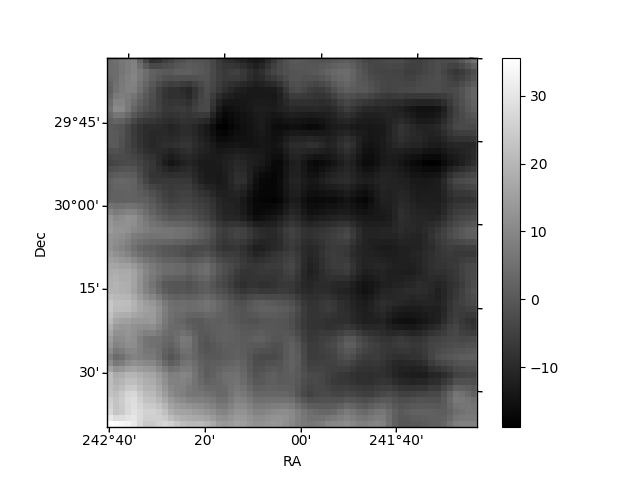
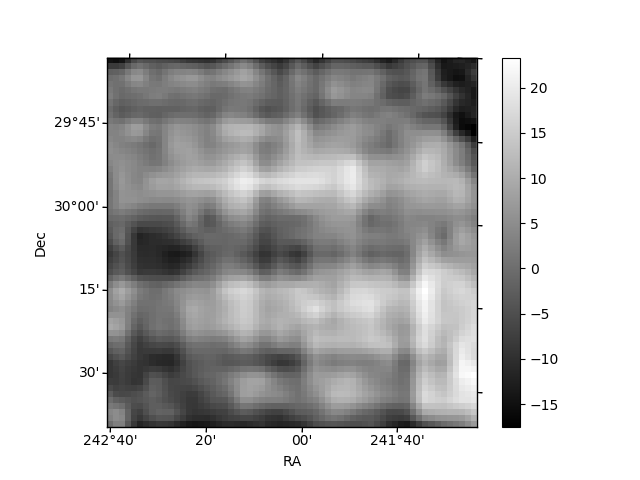
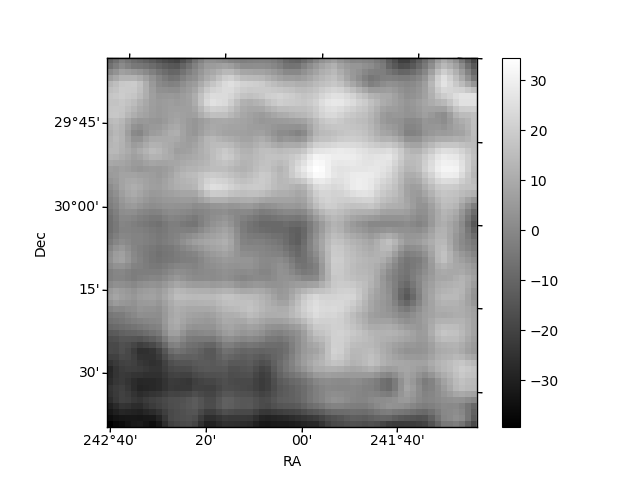
Histogram calculated using DETX and DETY for each event in the final _common_clean file
| Quadrant A | 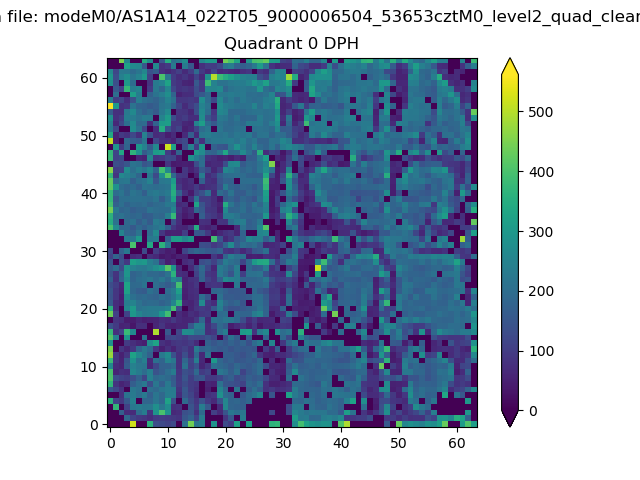 |
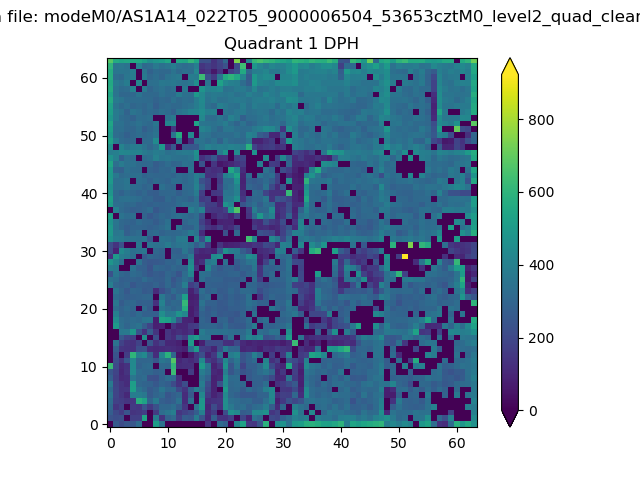 |
Quadrant B |
|---|---|---|---|
| Quadrant D | 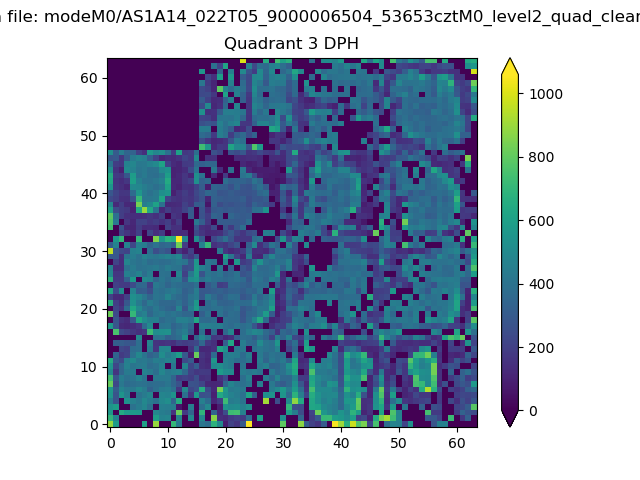 |
 |
Quadrant C |
| Plot type | Count rate plots | Images |
|---|---|---|
| Comparison with Poisson distribution Blue bars denote a histogram of data divided into 1 sec bins. Red curve is a Poisson curve with rate = median count rate of data. |
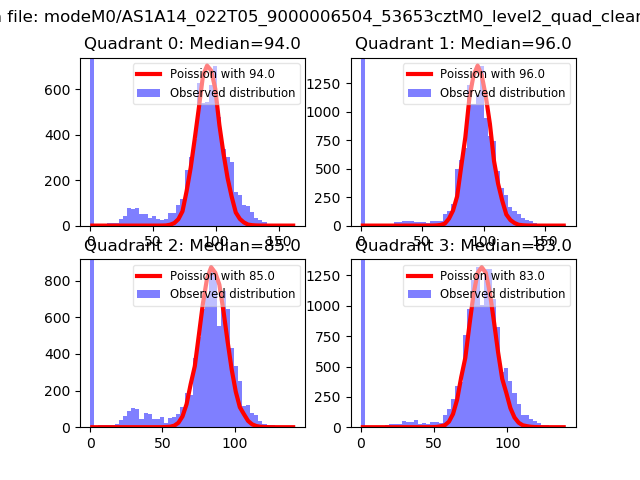 |
 |
| Quadrant-wise count rates Data is divided into 100 sec bins |
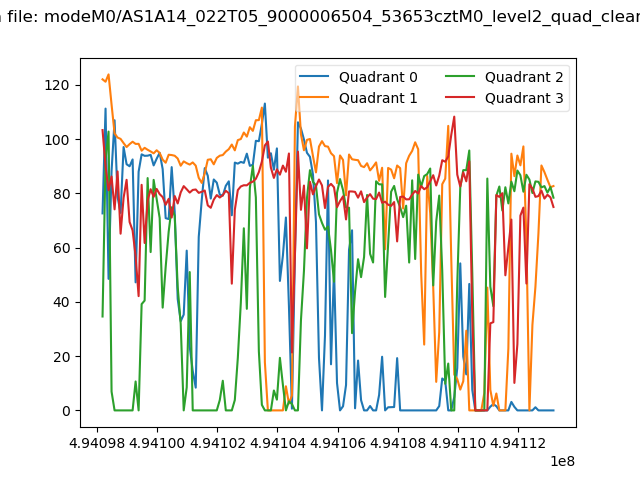 |
|
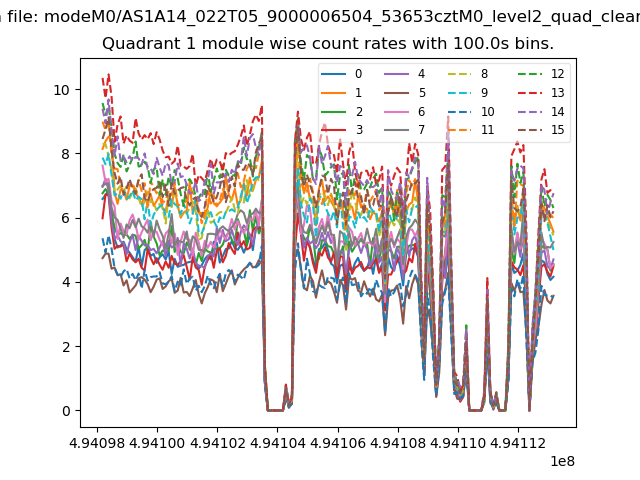
| Module-wise count rates for Quadrant A Data is divided into 100 sec bins |
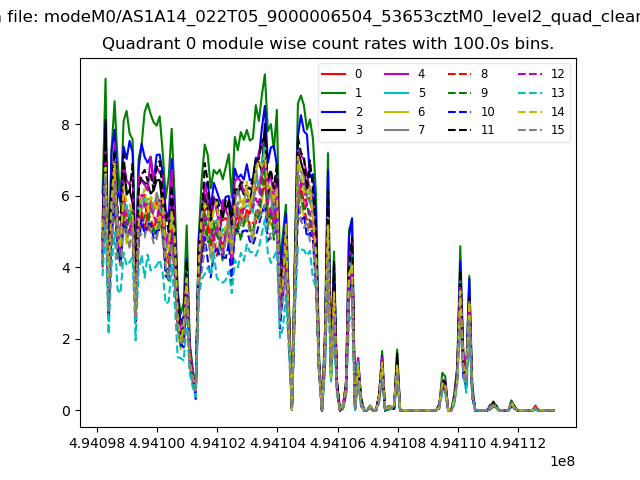 |
 |
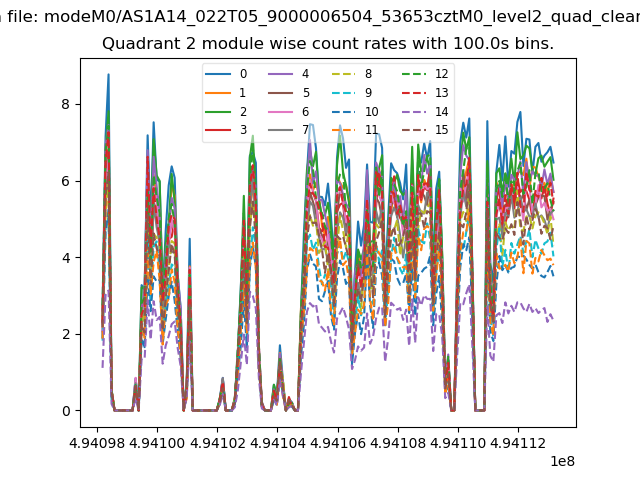
| Module-wise count rates for Quadrant B Data is divided into 100 sec bins |
 |
 |
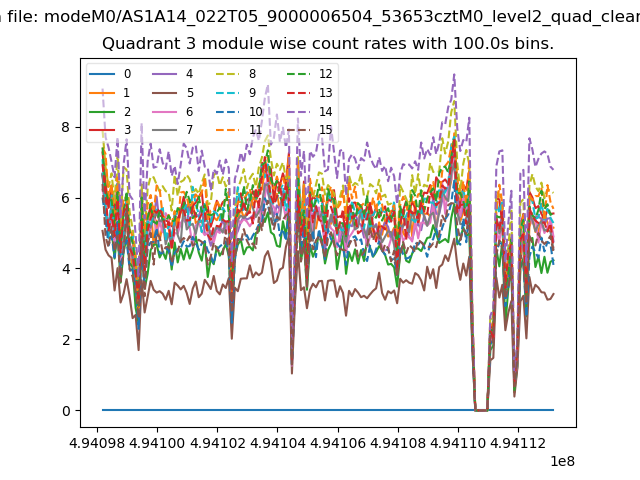
| Module-wise count rates for Quadrant C Data is divided into 100 sec bins |
 |
 |
| Module-wise count rates for Quadrant D Data is divided into 100 sec bins |
 |
 |
| Parameter | Plot |
|---|---|
| CZT HV Monitor | 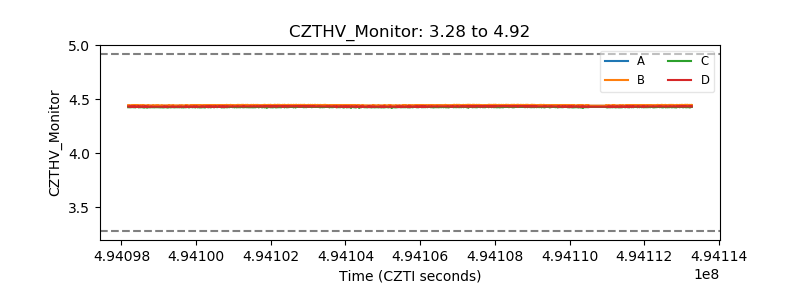 |
| D_VDD | 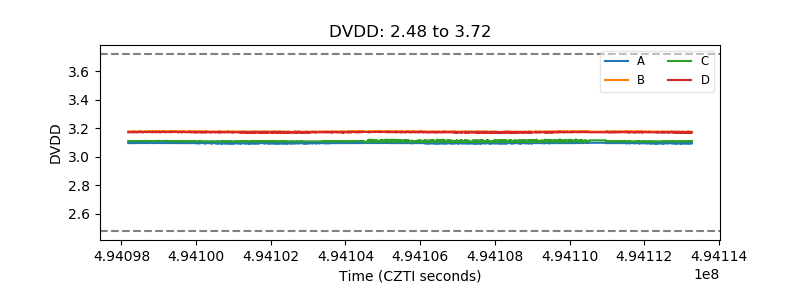 |
| Temperature 1 | 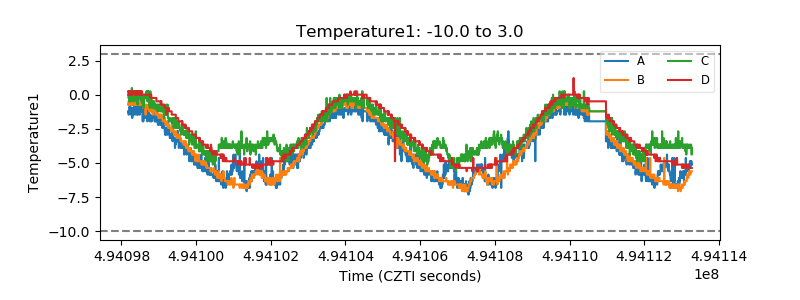 |
| Veto HV Monitor | 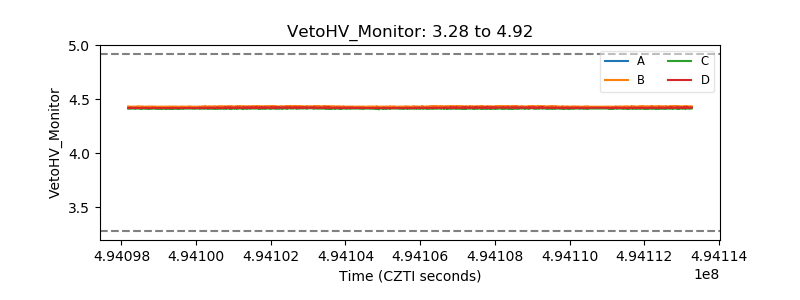 |
| Veto LLD | 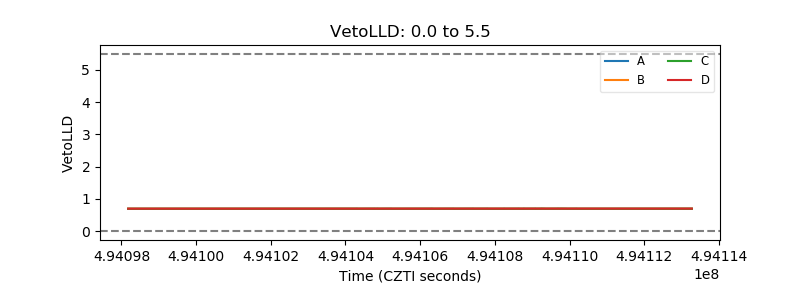 |
| Alpha Counter | 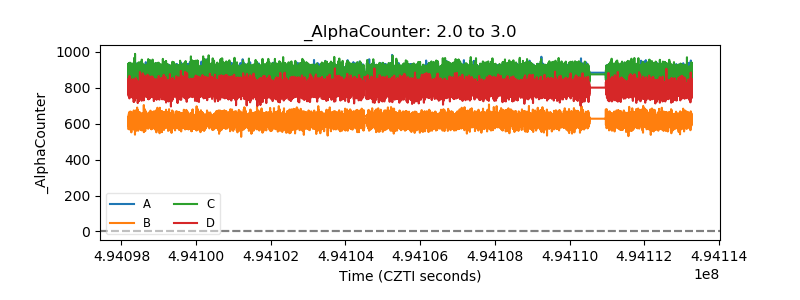 |
| _CPM_Rate | 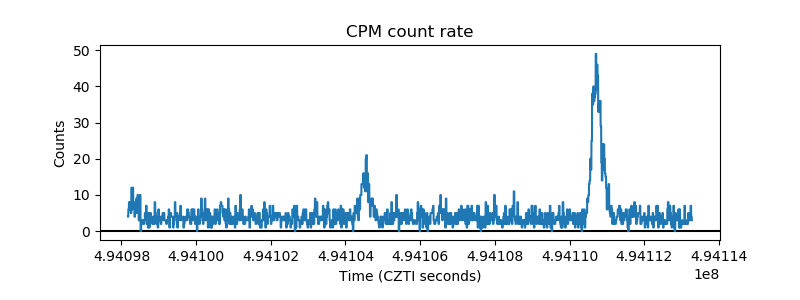 |
| CZT Counter | 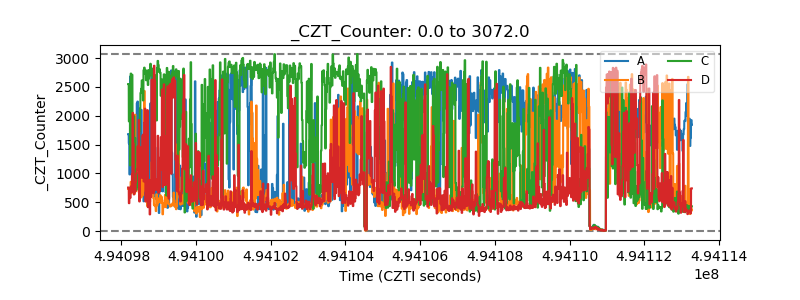 |
| +2.5 Volts monitor | 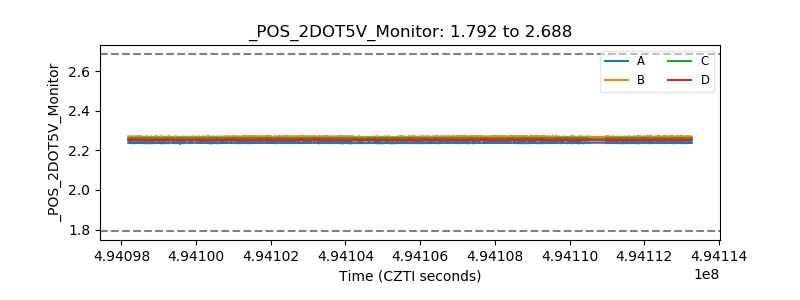 |
| +5 Volts monitor | 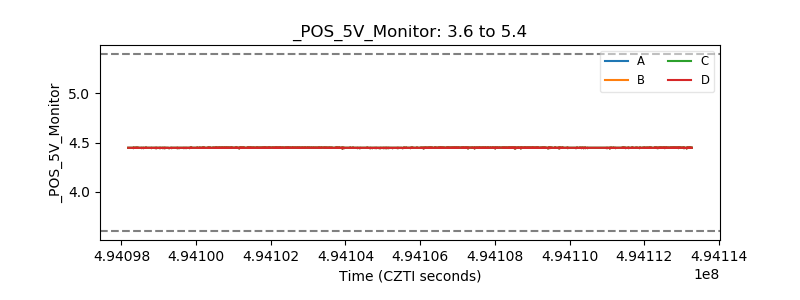 |
| _ROLL_ROT | 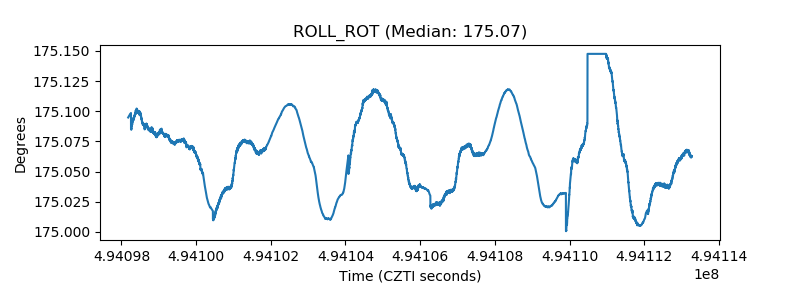 |
| _Roll_DEC | 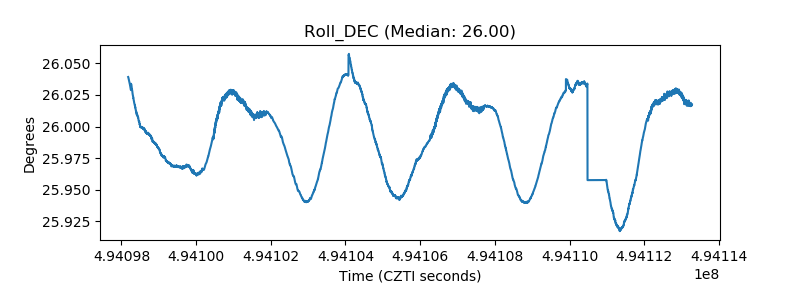 |
| _Roll_RA | 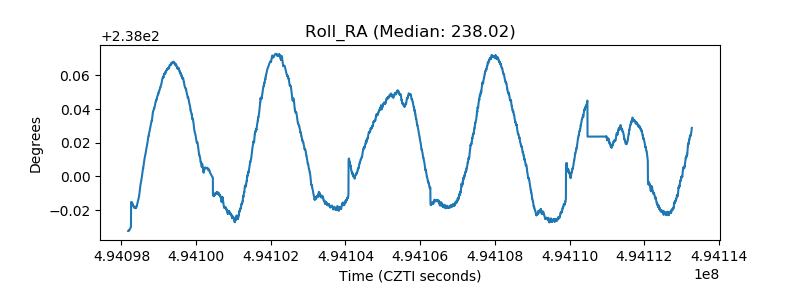 |
| Veto Counter | 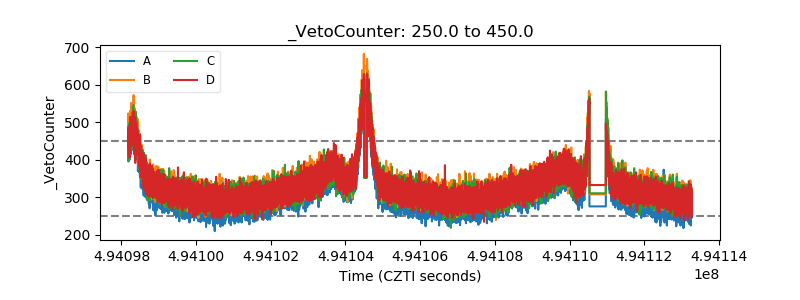 |