| Param | Original file | Final file |
|---|---|---|
| Filename | modeM0/AS1A14_022T05_9000006504_53656cztM0_level2.fits | modeM0/AS1A14_022T05_9000006504_53656cztM0_level2_quad_clean.evt |
| Size (bytes) | 2,232,812,160 | 170,720,640 |
| Size | 2.1 GB | 162.8 MB |
| Events in quadrant A | 37,701,692 | 129,485 |
| Events in quadrant B | 9,048,848 | 1,611,248 |
| Events in quadrant C | 22,551,361 | 995,911 |
| Events in quadrant D | 12,091,216 | 1,307,607 |
| Mode SS | |||
|---|---|---|---|
| Quadrant | BADHDUFLAG | Total packets | Discarded packets |
| A | 0 | 332 | 0 |
| B | 0 | 332 | 0 |
| C | 0 | 332 | 0 |
| D | 0 | 332 | 0 |
| Mode M9 | |||
|---|---|---|---|
| Quadrant | BADHDUFLAG | Total packets | Discarded packets |
| A | 0 | 24 | 0 |
| B | 0 | 24 | 0 |
| C | 0 | 24 | 0 |
| D | 0 | 24 | 0 |
| Mode M0 | |||
|---|---|---|---|
| Quadrant | BADHDUFLAG | Total packets | Discarded packets |
| A | 0 | 123083 | 3 |
| B | 0 | 38267 | 3 |
| C | 0 | 78292 | 3 |
| D | 0 | 47638 | 3 |
| Quadrant | Total seconds | Saturated seconds | Saturation percentage |
|---|---|---|---|
| A | 16297 | 15259 | 93.630730% |
| B | 16297 | 394 | 2.417623% |
| C | 16297 | 5392 | 33.085844% |
| D | 16297 | 1012 | 6.209732% |
Noise dominated data is calculated using 1-second bins in cleaned event files. If a bin has >2000 counts, and if more than 50% of those come from <1% of pixels, then it is considered to be noise-dominated and hence unusable.
| Quadrant | # 1 sec bins | Bins with >0 counts | Bins with >2000 counts | High rate bins dominated by noise | Noise dominated (total time) | Noise dominated (detector-on time) | Marked lightcurve |
|---|---|---|---|---|---|---|---|
| A | 18736 | 16300 | 12519 | 12519 | 66.82% | 76.80% | 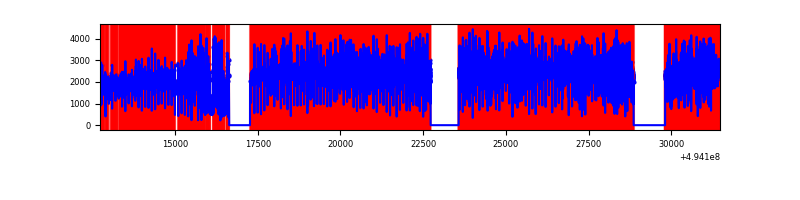 |
| B | 18737 | 16302 | 191 | 191 | 1.02% | 1.17% | 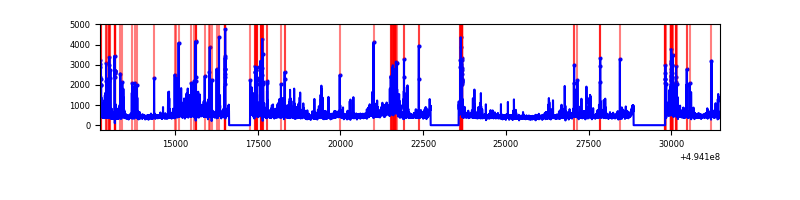 |
| C | 18737 | 16301 | 4716 | 4716 | 25.17% | 28.93% | 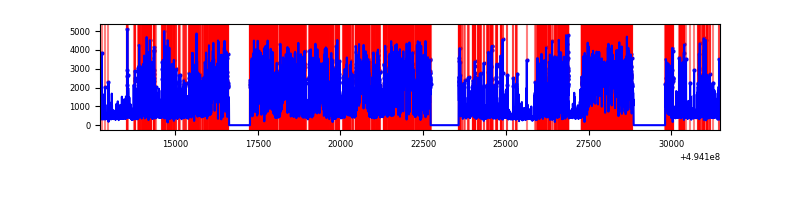 |
| D | 18737 | 16303 | 903 | 903 | 4.82% | 5.54% | 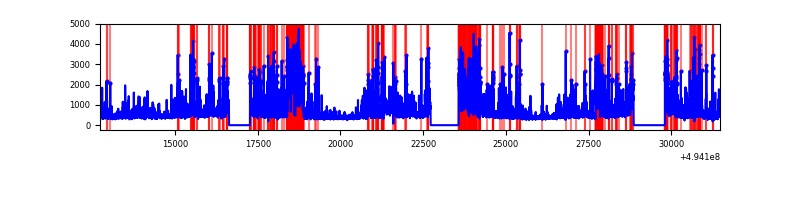 |
Top three noisy pixels from each quadrant. If the there are fewer than three noisy pixels in the level2.evt file, extra rows are filled as -1
| Pixel properties | Quadrant properties | ||||||
|---|---|---|---|---|---|---|---|
| Quadrant | DetID | PixID | Counts | Sigma | Mean | Median | Sigma |
| A | 3 | 63 | 27704445 | 170974.14 | 648 | 632 | 162.0 |
| A | 3 | 78 | 3040384 | 18759.84 | 648 | 632 | 162.0 |
| A | 14 | 254 | 2917063 | 17998.76 | 648 | 632 | 162.0 |
| B | 5 | 185 | 639794 | 1747.71 | 1723 | 1662 | 365.1 |
| B | 5 | 172 | 593548 | 1621.05 | 1723 | 1662 | 365.1 |
| B | 7 | 0 | 265953 | 723.84 | 1723 | 1662 | 365.1 |
| C | 1 | 241 | 9419256 | 23930.75 | 1414 | 1399 | 393.5 |
| C | 15 | 224 | 4740471 | 12041.97 | 1414 | 1399 | 393.5 |
| C | 2 | 12 | 479573 | 1215.04 | 1414 | 1399 | 393.5 |
| D | 8 | 176 | 2567940 | 5421.47 | 1657 | 1581 | 473.4 |
| D | 10 | 172 | 714509 | 1506.07 | 1657 | 1581 | 473.4 |
| D | 13 | 153 | 395515 | 832.19 | 1657 | 1581 | 473.4 |
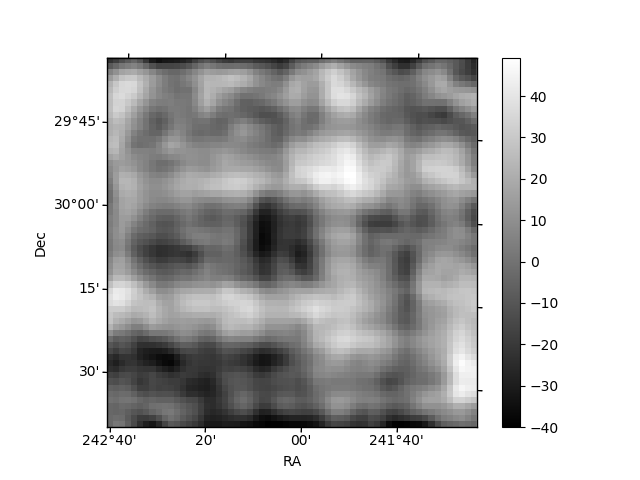
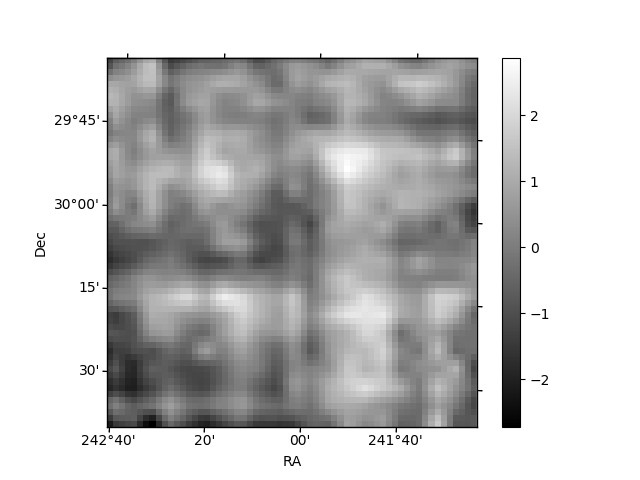
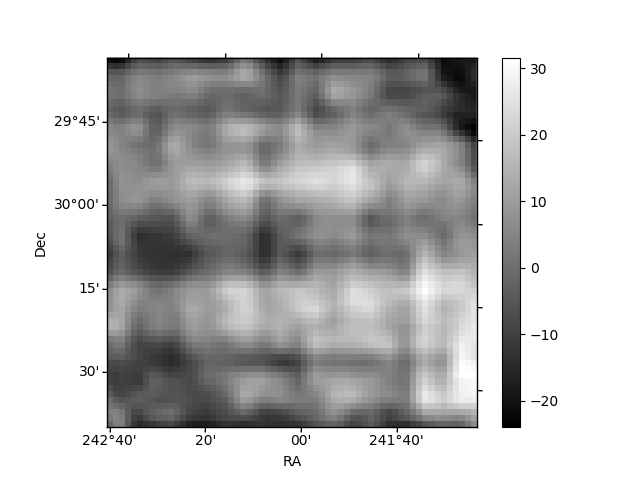
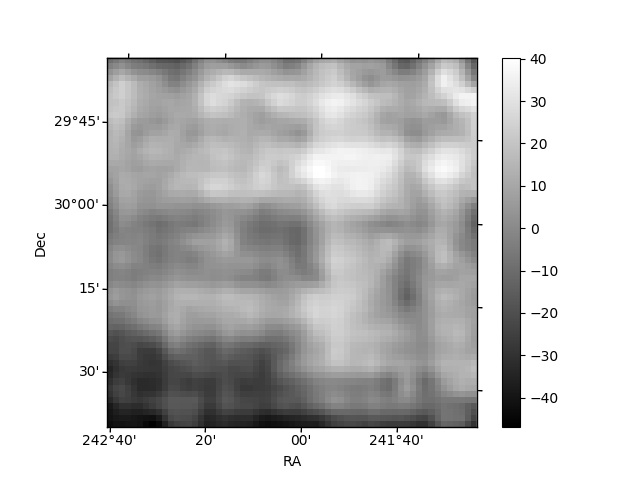
Histogram calculated using DETX and DETY for each event in the final _common_clean file
| Quadrant A | 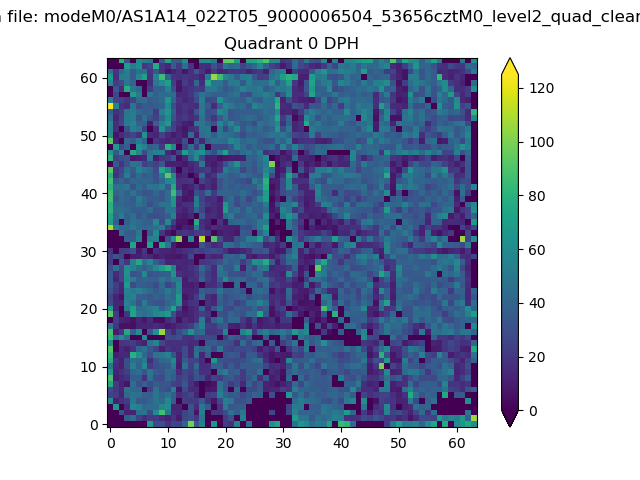 |
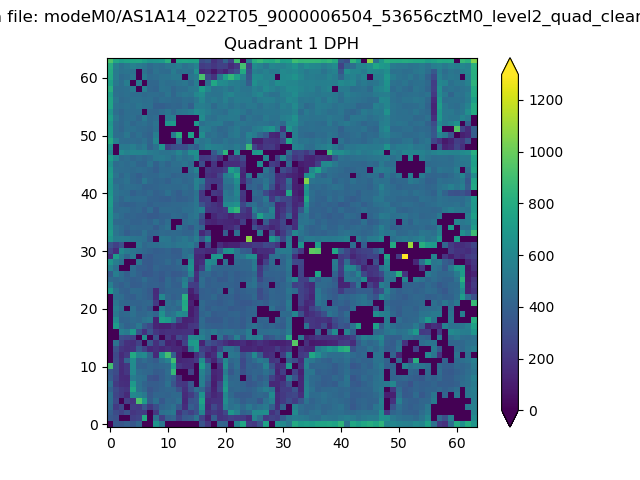 |
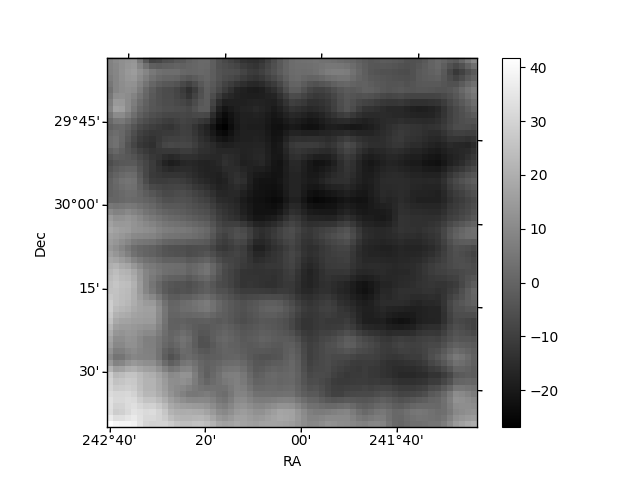
Quadrant B |
|---|---|---|---|
| Quadrant D | 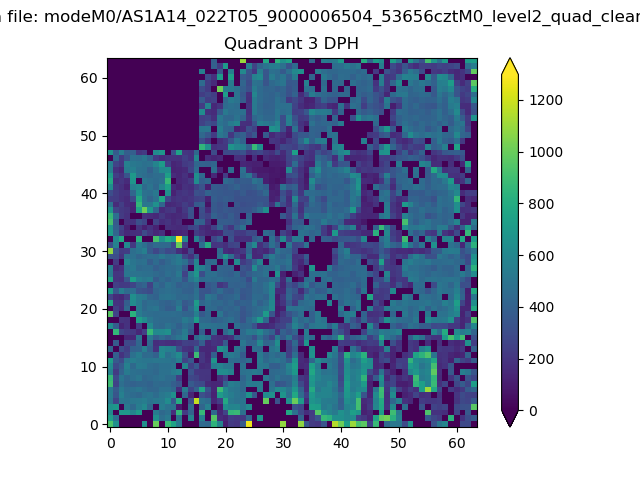 |
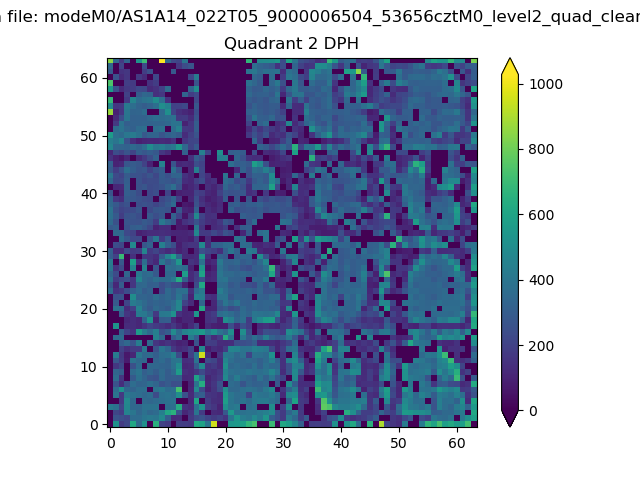 |
Quadrant C |
| Plot type | Count rate plots | Images |
|---|---|---|
| Comparison with Poisson distribution Blue bars denote a histogram of data divided into 1 sec bins. Red curve is a Poisson curve with rate = median count rate of data. |
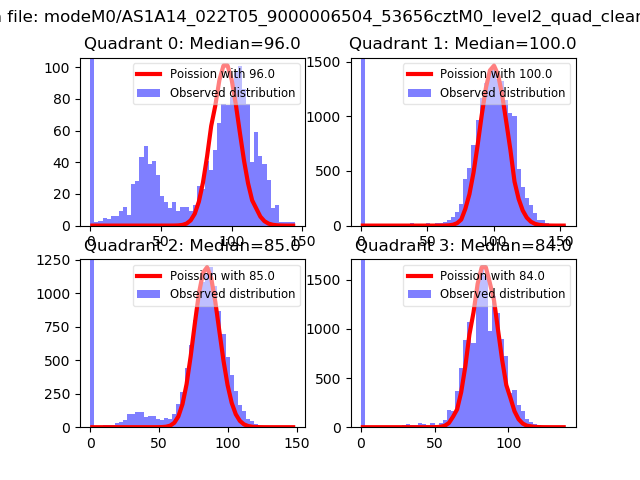 |
 |
| Quadrant-wise count rates Data is divided into 100 sec bins |
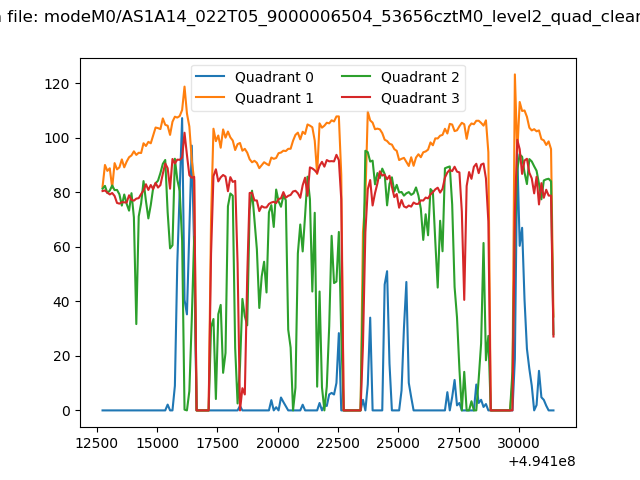 |
|
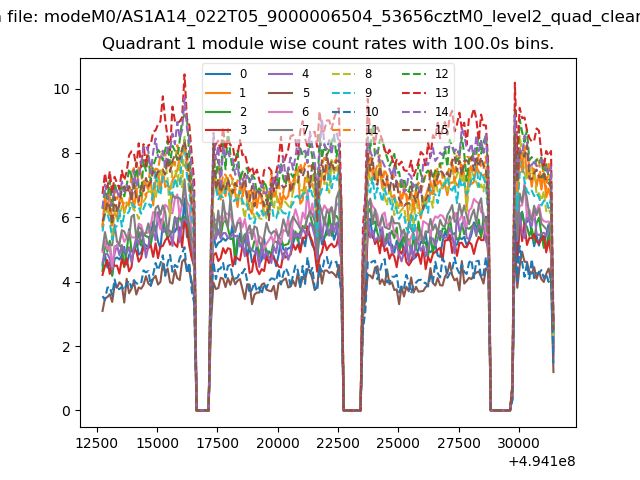
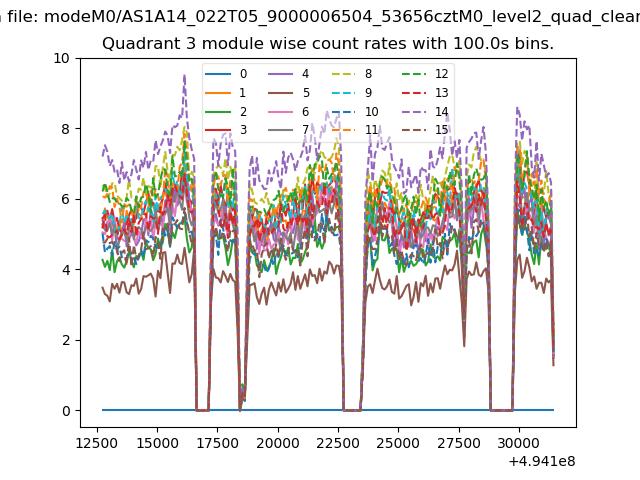
| Module-wise count rates for Quadrant A Data is divided into 100 sec bins |
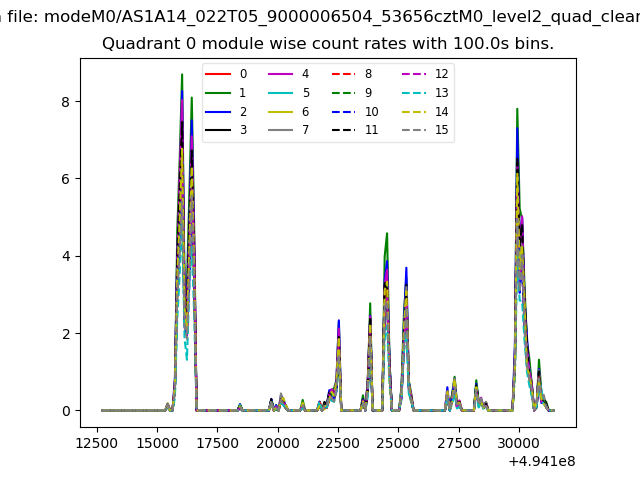 |
 |
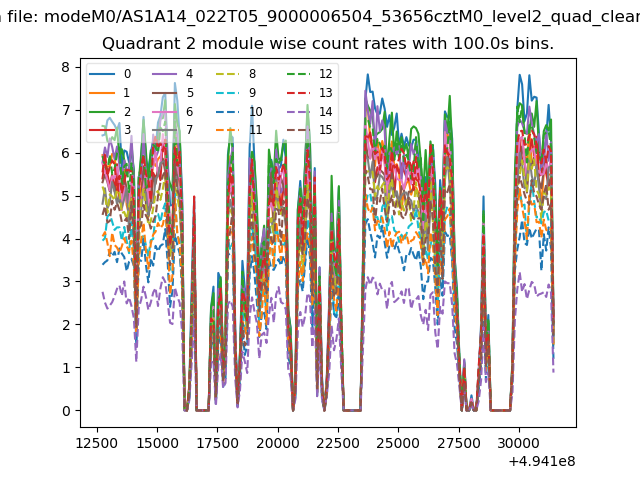
| Module-wise count rates for Quadrant B Data is divided into 100 sec bins |
 |
 |
| Module-wise count rates for Quadrant C Data is divided into 100 sec bins |
 |
 |
| Module-wise count rates for Quadrant D Data is divided into 100 sec bins |
 |
 |
| Parameter | Plot |
|---|---|
| CZT HV Monitor | 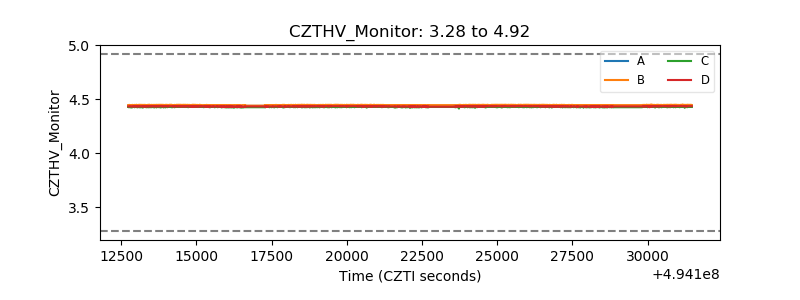 |
| D_VDD | 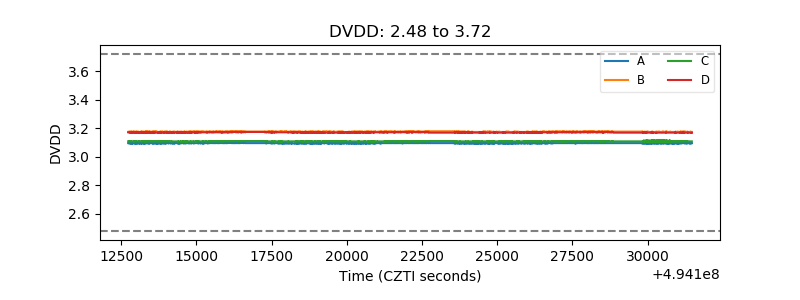 |
| Temperature 1 | 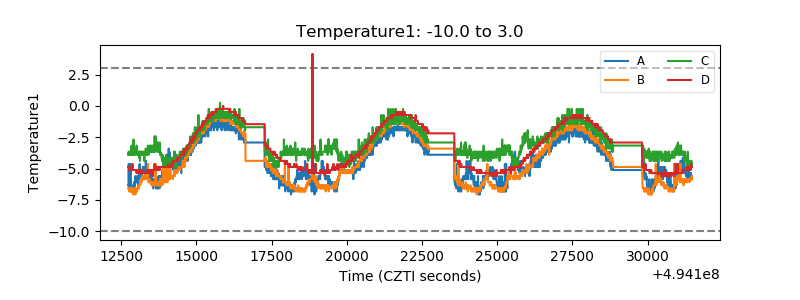 |
| Veto HV Monitor |  |
| Veto LLD | 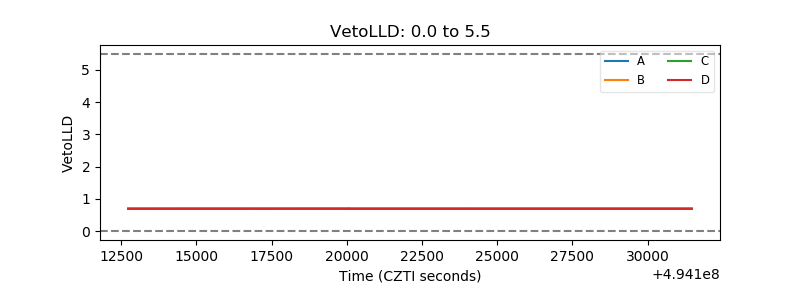 |
| Alpha Counter | 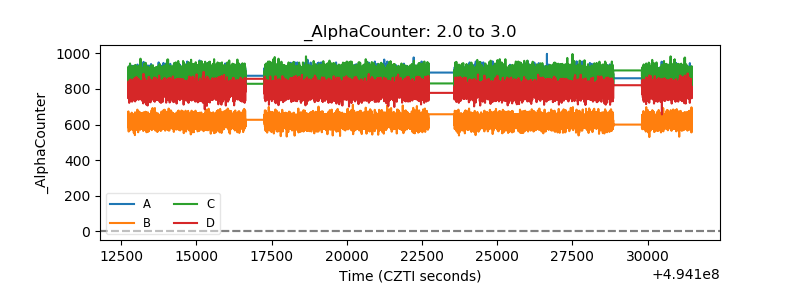 |
| _CPM_Rate | 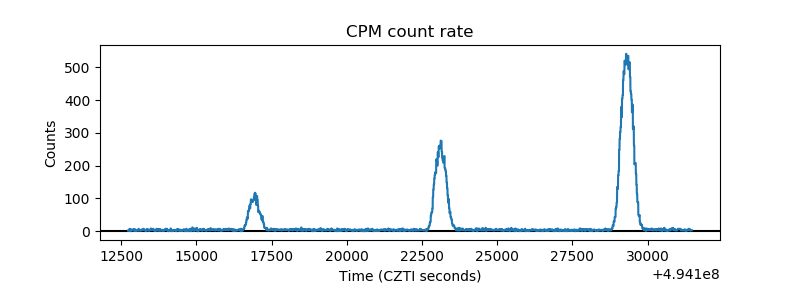 |
| CZT Counter | 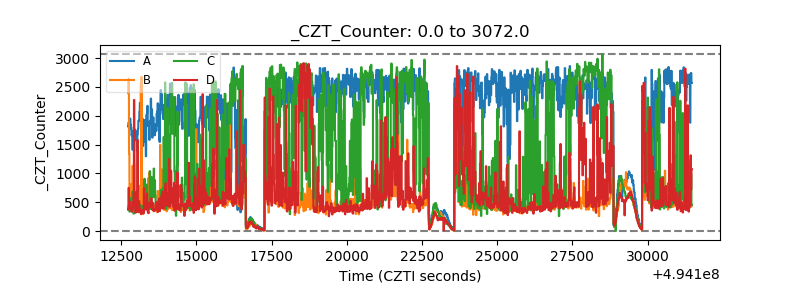 |
| +2.5 Volts monitor | 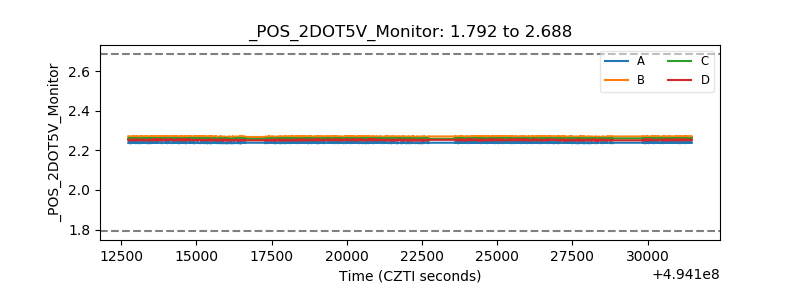 |
| +5 Volts monitor | 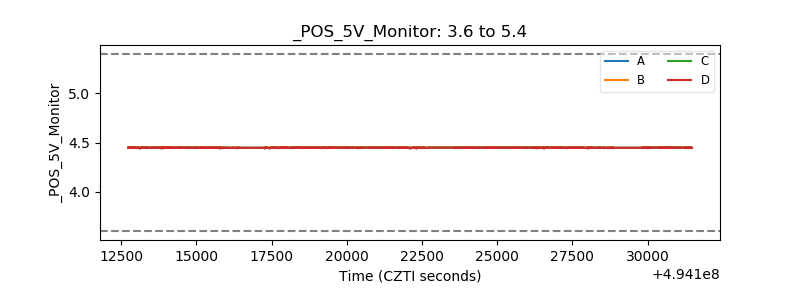 |
| _ROLL_ROT | 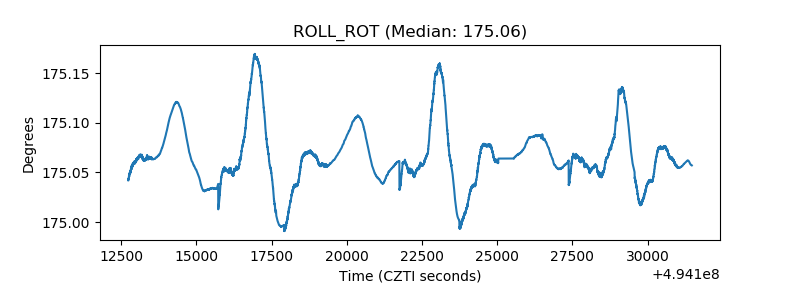 |
| _Roll_DEC | 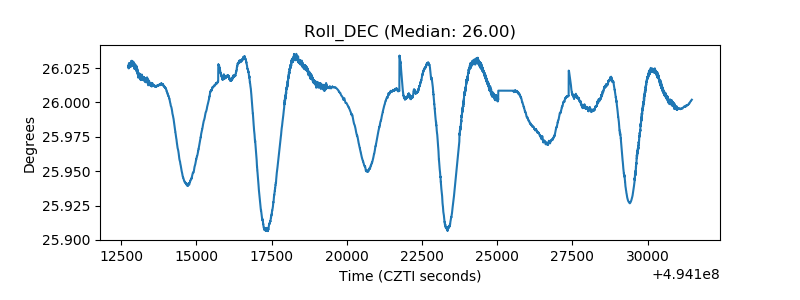 |
| _Roll_RA | 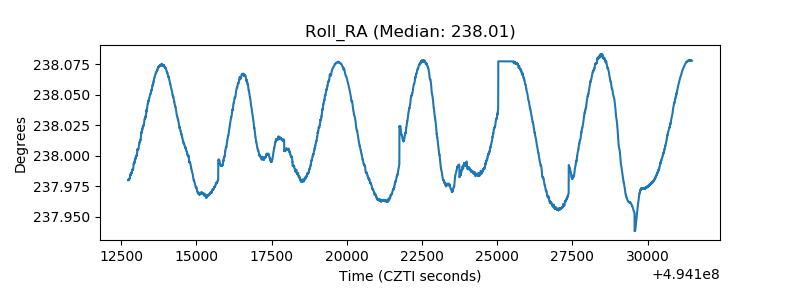 |
| Veto Counter | 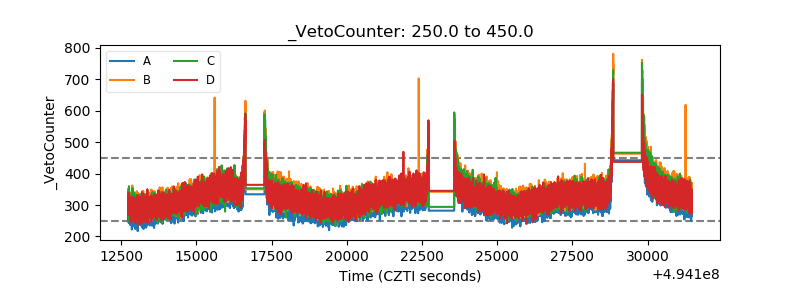 |