| Param | Original file | Final file |
|---|---|---|
| Filename | modeM0/AS1A14_022T05_9000006504_53657cztM0_level2.fits | modeM0/AS1A14_022T05_9000006504_53657cztM0_level2_quad_clean.evt |
| Size (bytes) | 846,129,600 | 74,891,520 |
| Size | 806.9 MB | 71.4 MB |
| Events in quadrant A | 16,061,850 | 39,410 |
| Events in quadrant B | 3,959,169 | 671,461 |
| Events in quadrant C | 5,393,059 | 585,763 |
| Events in quadrant D | 5,403,652 | 518,436 |
| Mode SS | |||
|---|---|---|---|
| Quadrant | BADHDUFLAG | Total packets | Discarded packets |
| A | 0 | 132 | 0 |
| B | 0 | 132 | 0 |
| C | 0 | 132 | 0 |
| D | 0 | 132 | 0 |
| Mode M9 | |||
|---|---|---|---|
| Quadrant | BADHDUFLAG | Total packets | Discarded packets |
| A | 0 | 11 | 0 |
| B | 0 | 11 | 0 |
| C | 0 | 11 | 0 |
| D | 0 | 11 | 0 |
| Mode M0 | |||
|---|---|---|---|
| Quadrant | BADHDUFLAG | Total packets | Discarded packets |
| A | 0 | 52194 | 9 |
| B | 0 | 16062 | 2 |
| C | 0 | 20457 | 2 |
| D | 0 | 20701 | 2 |
| Quadrant | Total seconds | Saturated seconds | Saturation percentage |
|---|---|---|---|
| A | 6487 | 6201 | 95.591182% |
| B | 6487 | 231 | 3.560968% |
| C | 6487 | 450 | 6.936951% |
| D | 6487 | 697 | 10.744566% |
Noise dominated data is calculated using 1-second bins in cleaned event files. If a bin has >2000 counts, and if more than 50% of those come from <1% of pixels, then it is considered to be noise-dominated and hence unusable.
| Quadrant | # 1 sec bins | Bins with >0 counts | Bins with >2000 counts | High rate bins dominated by noise | Noise dominated (total time) | Noise dominated (detector-on time) | Marked lightcurve |
|---|---|---|---|---|---|---|---|
| A | 7606 | 6486 | 5737 | 5737 | 75.43% | 88.45% | 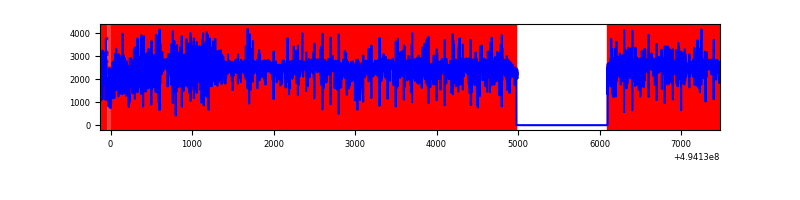 |
| B | 7607 | 6488 | 121 | 121 | 1.59% | 1.86% | 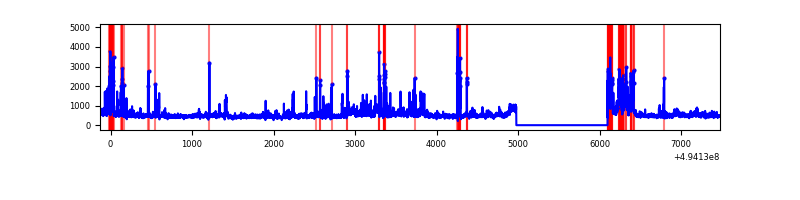 |
| C | 7607 | 6488 | 379 | 379 | 4.98% | 5.84% | 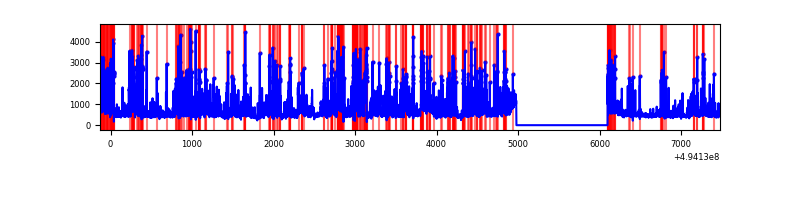 |
| D | 7607 | 6488 | 602 | 602 | 7.91% | 9.28% | 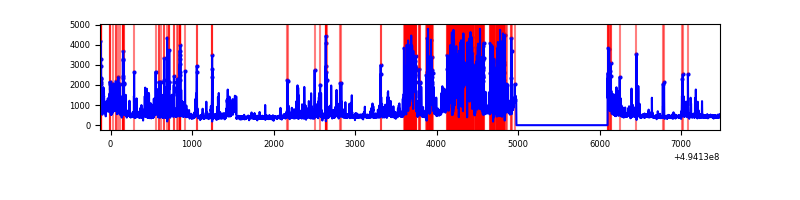 |
Top three noisy pixels from each quadrant. If the there are fewer than three noisy pixels in the level2.evt file, extra rows are filled as -1
| Pixel properties | Quadrant properties | ||||||
|---|---|---|---|---|---|---|---|
| Quadrant | DetID | PixID | Counts | Sigma | Mean | Median | Sigma |
| A | 3 | 63 | 8957910 | 143992.22 | 244 | 238 | 62.2 |
| A | 14 | 254 | 5402573 | 86841.11 | 244 | 238 | 62.2 |
| A | 10 | 253 | 315686 | 5070.74 | 244 | 238 | 62.2 |
| B | 5 | 172 | 913085 | 6024.78 | 704 | 680 | 151.4 |
| B | 10 | 254 | 47064 | 306.28 | 704 | 680 | 151.4 |
| B | 7 | 252 | 46579 | 303.08 | 704 | 680 | 151.4 |
| C | 15 | 224 | 1766345 | 9305.07 | 678 | 674 | 189.8 |
| C | 1 | 241 | 374014 | 1967.5 | 678 | 674 | 189.8 |
| C | 14 | 80 | 69904 | 364.84 | 678 | 674 | 189.8 |
| D | 8 | 176 | 1818496 | 9718.23 | 655 | 626 | 187.1 |
| D | 10 | 118 | 221966 | 1183.27 | 655 | 626 | 187.1 |
| D | 13 | 153 | 209438 | 1116.3 | 655 | 626 | 187.1 |
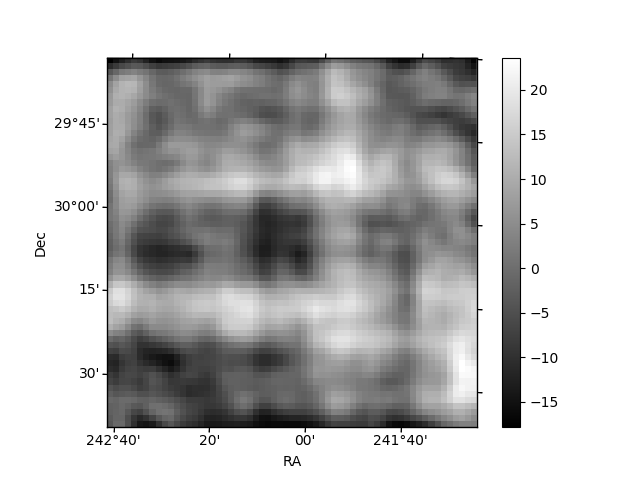
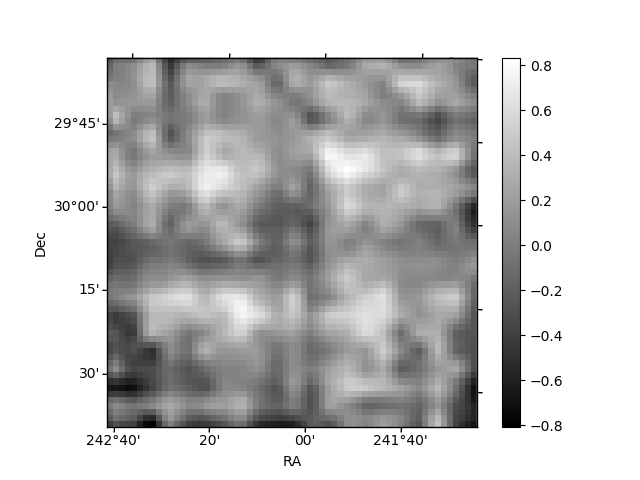
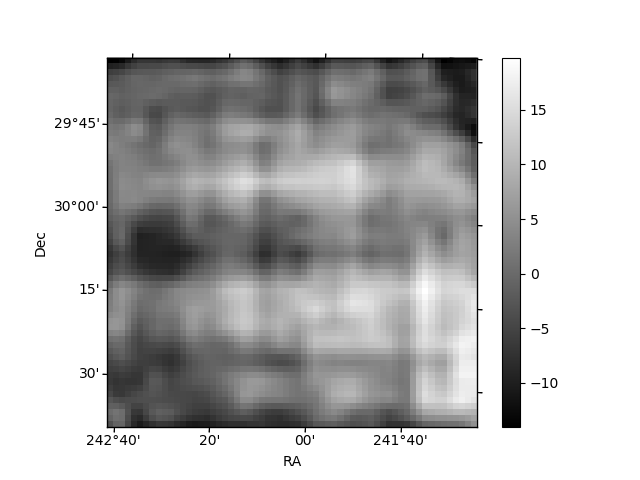
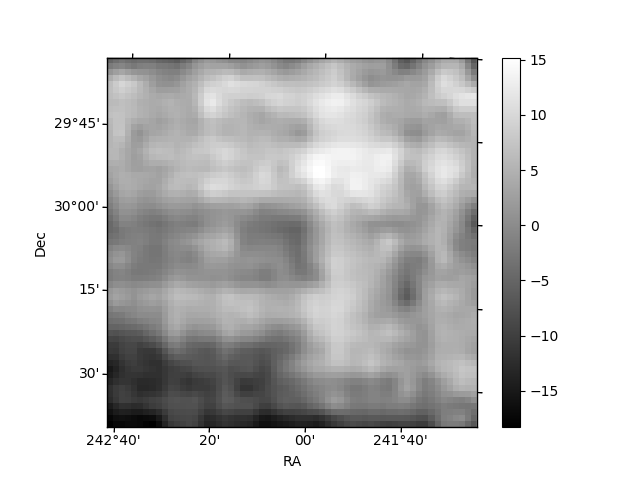
Histogram calculated using DETX and DETY for each event in the final _common_clean file
| Quadrant A | 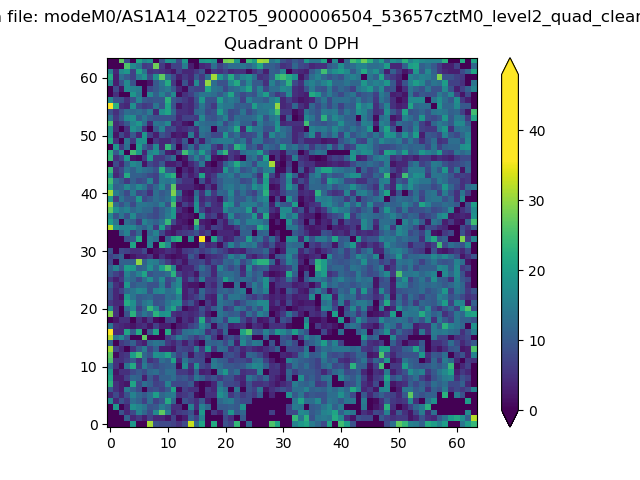 |
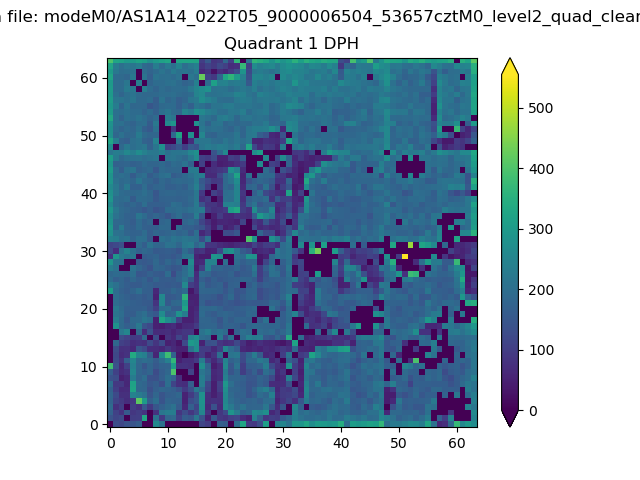 |
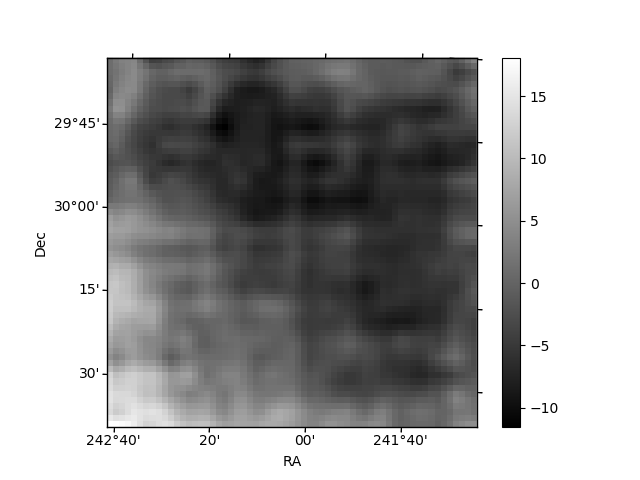
Quadrant B |
|---|---|---|---|
| Quadrant D | 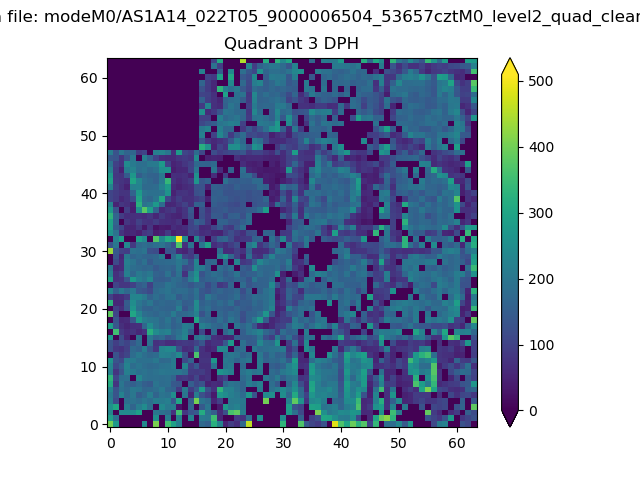 |
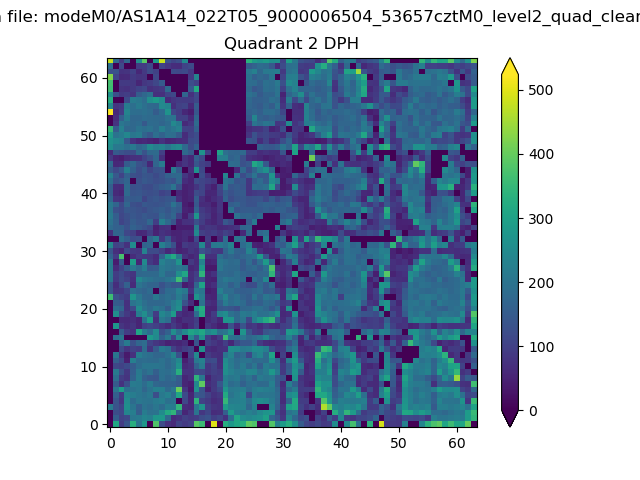 |
Quadrant C |
| Plot type | Count rate plots | Images |
|---|---|---|
| Comparison with Poisson distribution Blue bars denote a histogram of data divided into 1 sec bins. Red curve is a Poisson curve with rate = median count rate of data. |
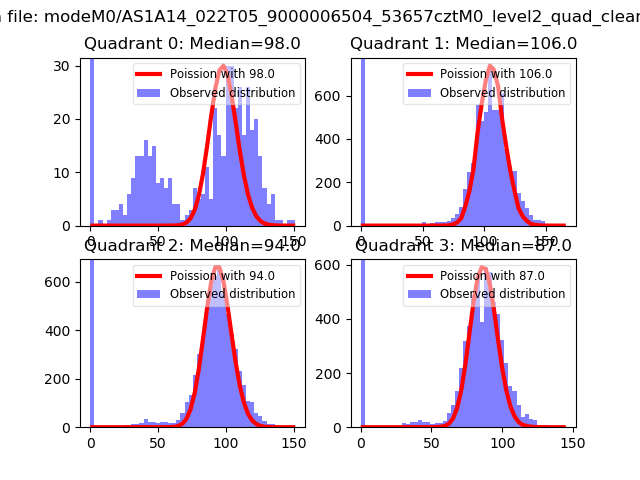 |
 |
| Quadrant-wise count rates Data is divided into 100 sec bins |
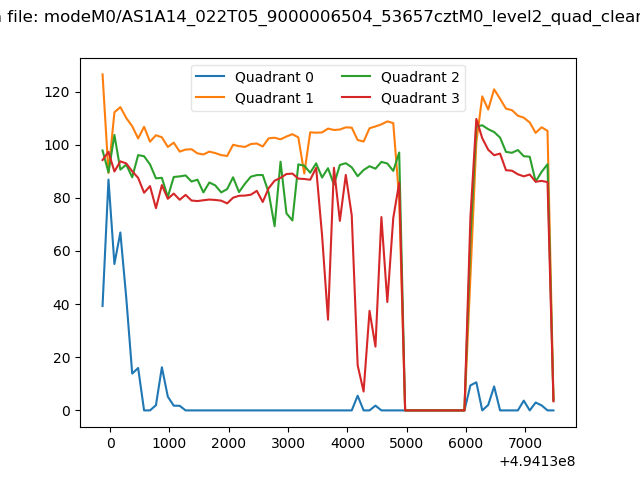 |
|
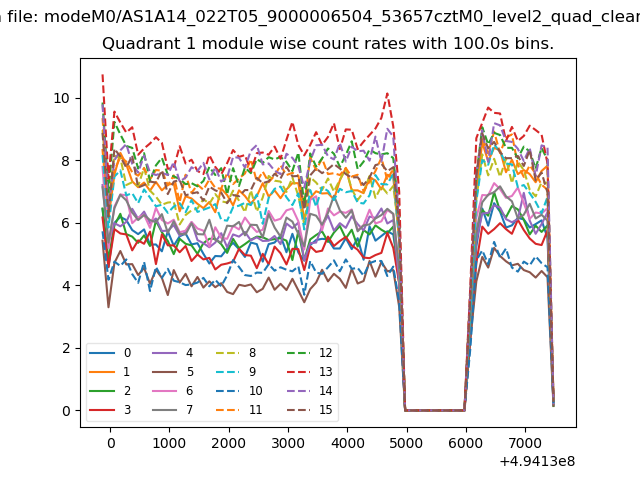
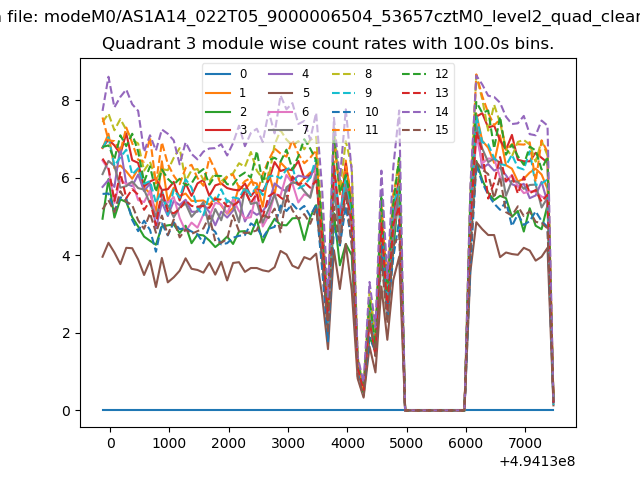
| Module-wise count rates for Quadrant A Data is divided into 100 sec bins |
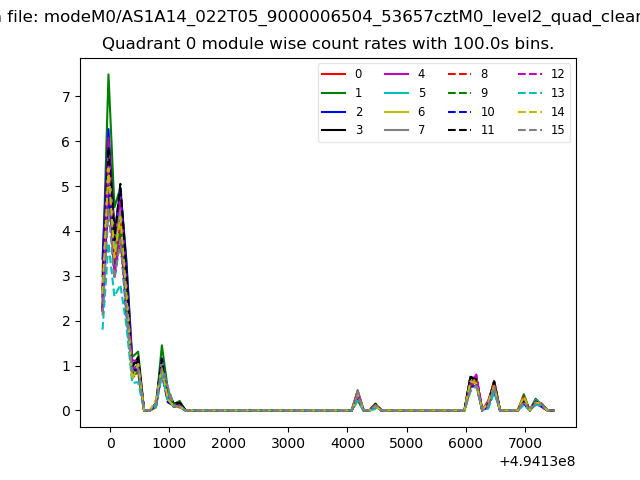 |
 |
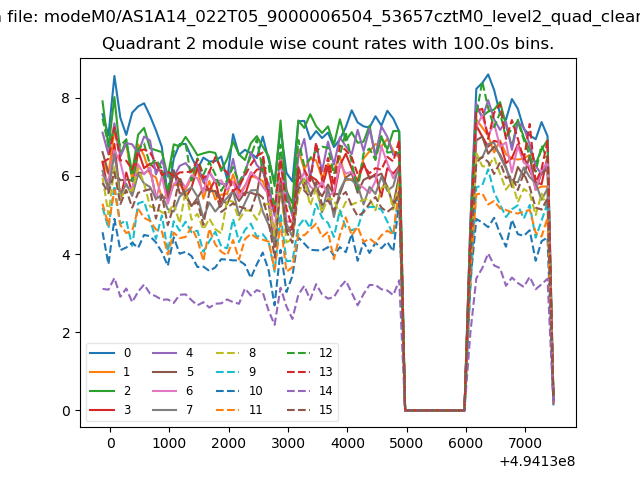
| Module-wise count rates for Quadrant B Data is divided into 100 sec bins |
 |
 |
| Module-wise count rates for Quadrant C Data is divided into 100 sec bins |
 |
 |
| Module-wise count rates for Quadrant D Data is divided into 100 sec bins |
 |
 |
| Parameter | Plot |
|---|---|
| CZT HV Monitor | 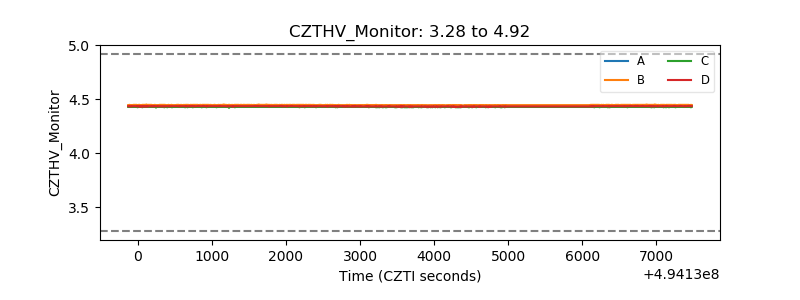 |
| D_VDD | 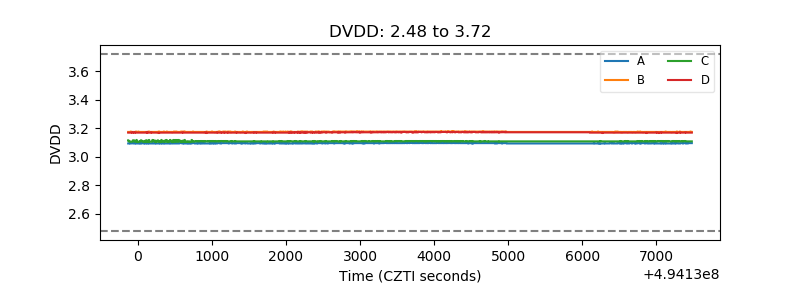 |
| Temperature 1 | 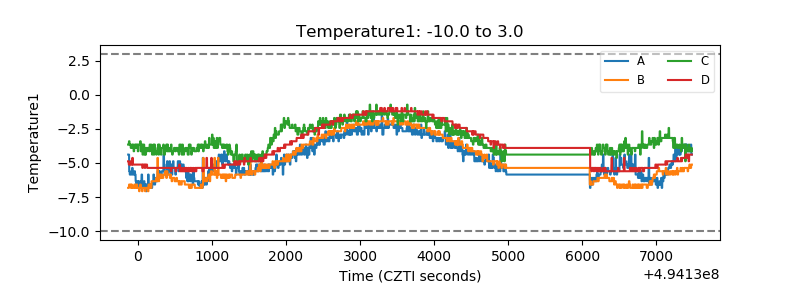 |
| Veto HV Monitor | 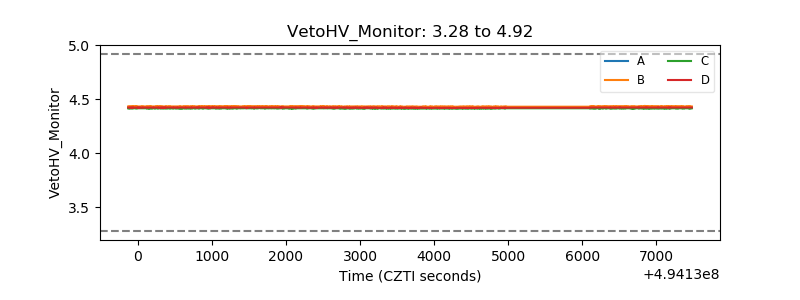 |
| Veto LLD | 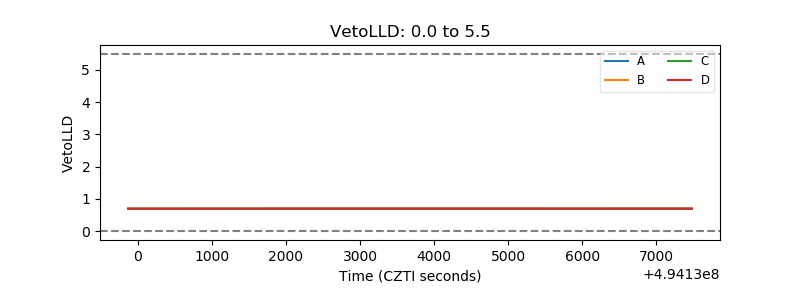 |
| Alpha Counter | 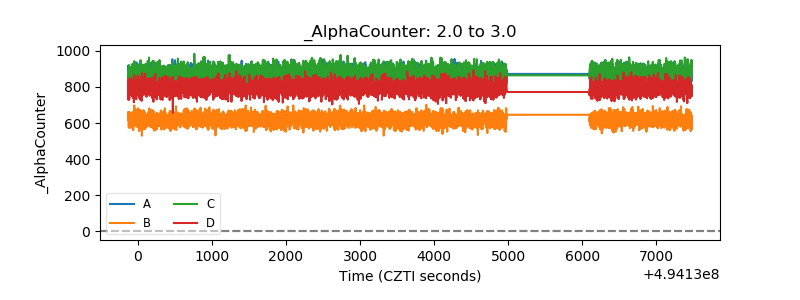 |
| _CPM_Rate | 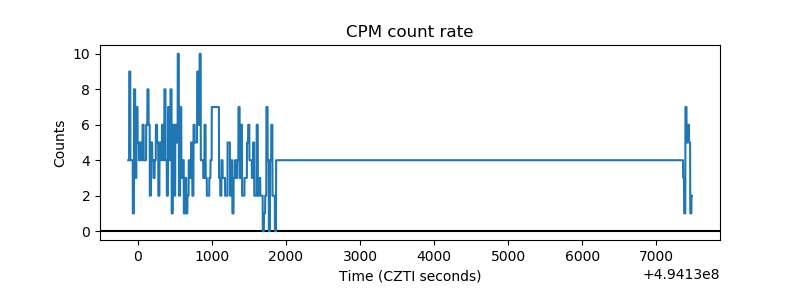 |
| CZT Counter | 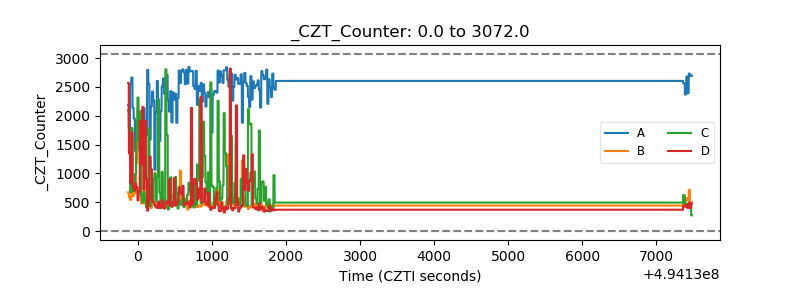 |
| +2.5 Volts monitor | 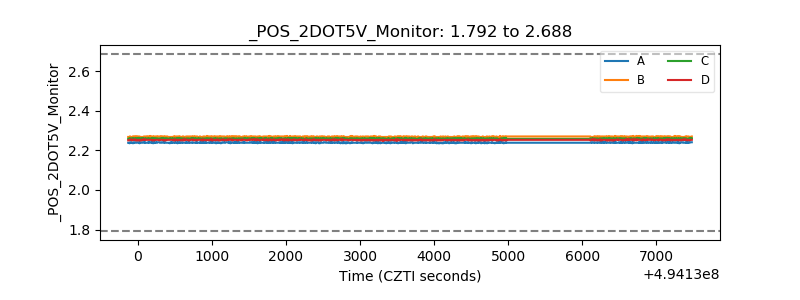 |
| +5 Volts monitor | 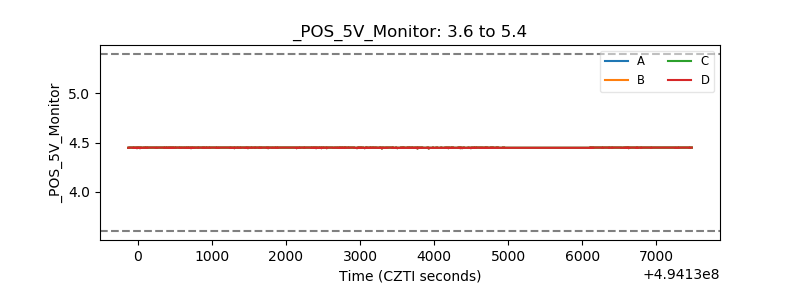 |
| _ROLL_ROT | 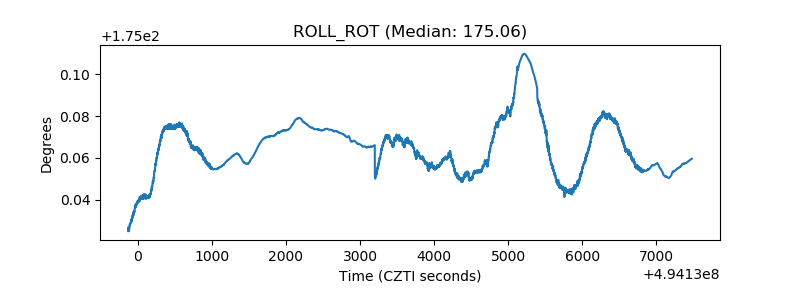 |
| _Roll_DEC | 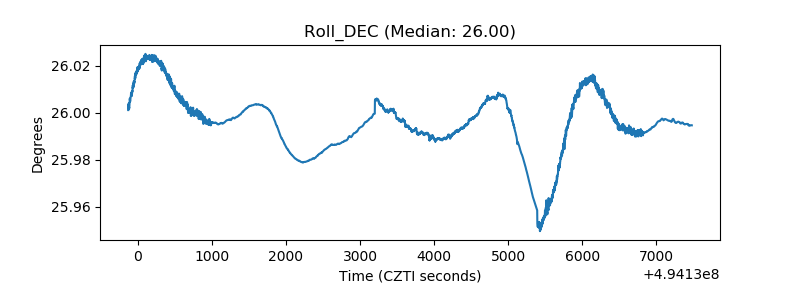 |
| _Roll_RA | 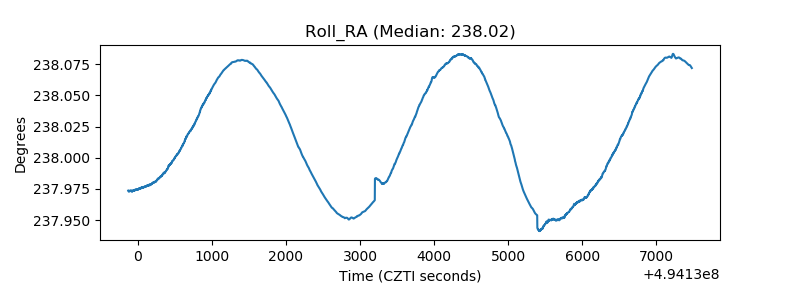 |
| Veto Counter | 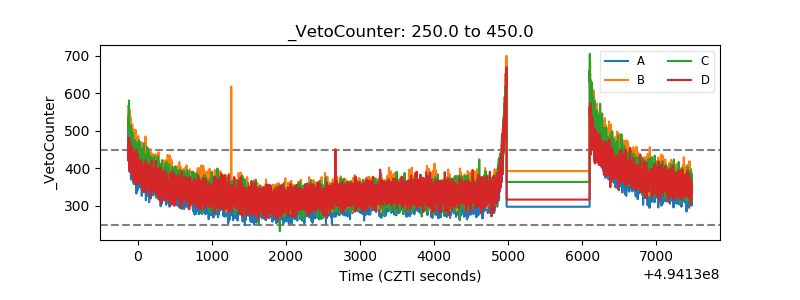 |