| Param | Original file | Final file |
|---|---|---|
| Filename | modeM0/AS1A14_022T05_9000006504_53658cztM0_level2.fits | modeM0/AS1A14_022T05_9000006504_53658cztM0_level2_quad_clean.evt |
| Size (bytes) | 934,081,920 | 72,118,080 |
| Size | 890.8 MB | 68.8 MB |
| Events in quadrant A | 15,532,930 | 76,645 |
| Events in quadrant B | 4,902,511 | 687,093 |
| Events in quadrant C | 9,067,626 | 401,895 |
| Events in quadrant D | 4,574,054 | 567,553 |
| Mode SS | |||
|---|---|---|---|
| Quadrant | BADHDUFLAG | Total packets | Discarded packets |
| A | 0 | 132 | 0 |
| B | 0 | 132 | 0 |
| C | 0 | 132 | 0 |
| D | 0 | 132 | 0 |
| Mode M9 | |||
|---|---|---|---|
| Quadrant | BADHDUFLAG | Total packets | Discarded packets |
| A | 0 | 11 | 0 |
| B | 0 | 11 | 0 |
| C | 0 | 11 | 0 |
| D | 0 | 11 | 0 |
| Mode M0 | |||
|---|---|---|---|
| Quadrant | BADHDUFLAG | Total packets | Discarded packets |
| A | 0 | 50544 | 1 |
| B | 0 | 18959 | 1 |
| C | 0 | 31400 | 1 |
| D | 0 | 17987 | 1 |
| Quadrant | Total seconds | Saturated seconds | Saturation percentage |
|---|---|---|---|
| A | 6451 | 5899 | 91.443187% |
| B | 6452 | 357 | 5.533168% |
| C | 6452 | 2428 | 37.631742% |
| D | 6452 | 360 | 5.579665% |
Noise dominated data is calculated using 1-second bins in cleaned event files. If a bin has >2000 counts, and if more than 50% of those come from <1% of pixels, then it is considered to be noise-dominated and hence unusable.
| Quadrant | # 1 sec bins | Bins with >0 counts | Bins with >2000 counts | High rate bins dominated by noise | Noise dominated (total time) | Noise dominated (detector-on time) | Marked lightcurve |
|---|---|---|---|---|---|---|---|
| A | 7580 | 6450 | 5280 | 5280 | 69.66% | 81.86% | 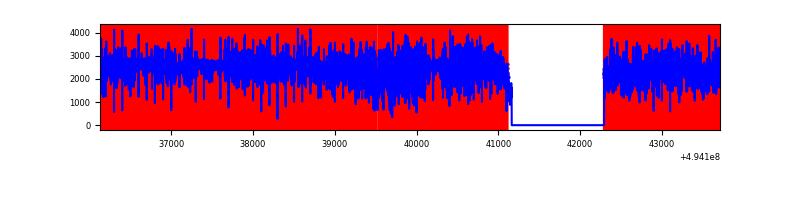 |
| B | 7581 | 6451 | 147 | 147 | 1.94% | 2.28% | 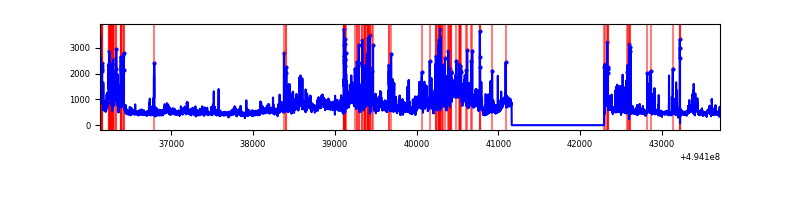 |
| C | 7581 | 6451 | 2311 | 2311 | 30.48% | 35.82% | 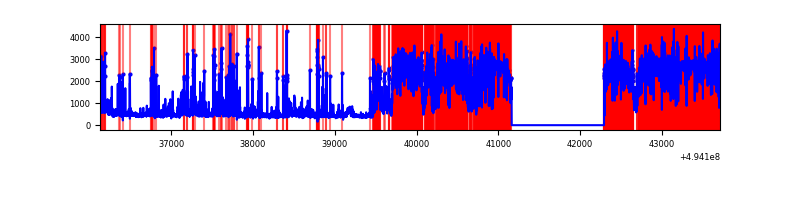 |
| D | 7581 | 6452 | 278 | 278 | 3.67% | 4.31% | 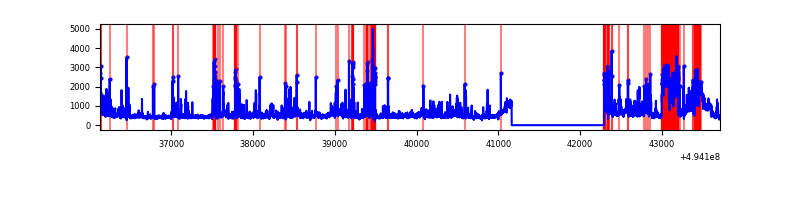 |
Top three noisy pixels from each quadrant. If the there are fewer than three noisy pixels in the level2.evt file, extra rows are filled as -1
| Pixel properties | Quadrant properties | ||||||
|---|---|---|---|---|---|---|---|
| Quadrant | DetID | PixID | Counts | Sigma | Mean | Median | Sigma |
| A | 3 | 63 | 12505136 | 126729.22 | 394 | 383 | 98.7 |
| A | 3 | 78 | 543693 | 5506.17 | 394 | 383 | 98.7 |
| A | 14 | 254 | 222166 | 2247.66 | 394 | 383 | 98.7 |
| B | 5 | 172 | 886863 | 5693.06 | 722 | 694 | 155.7 |
| B | 7 | 0 | 737347 | 4732.51 | 722 | 694 | 155.7 |
| B | 5 | 185 | 215340 | 1378.96 | 722 | 694 | 155.7 |
| C | 1 | 241 | 5165524 | 31851.82 | 582 | 577 | 162.2 |
| C | 15 | 224 | 820253 | 5054.88 | 582 | 577 | 162.2 |
| C | 5 | 10 | 174573 | 1073.02 | 582 | 577 | 162.2 |
| D | 10 | 172 | 992851 | 4983.93 | 699 | 669 | 199.1 |
| D | 13 | 153 | 180451 | 903.08 | 699 | 669 | 199.1 |
| D | 10 | 118 | 166768 | 834.35 | 699 | 669 | 199.1 |
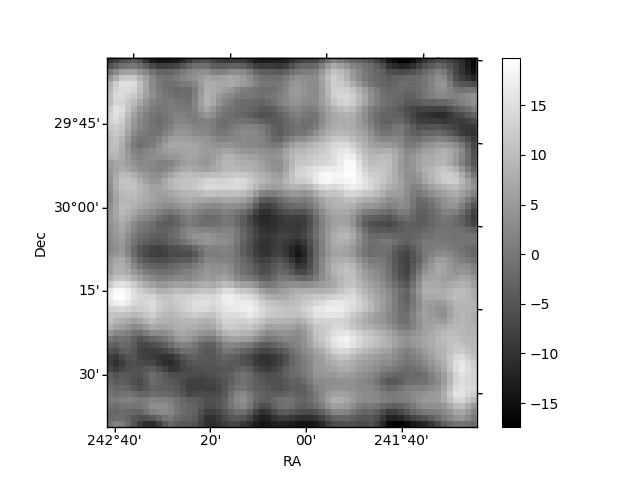
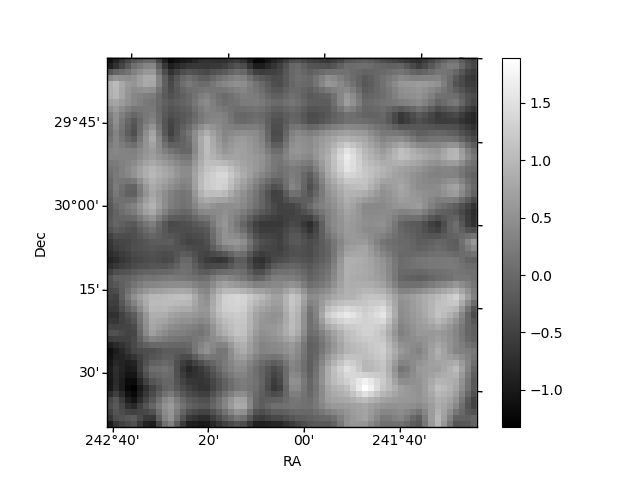
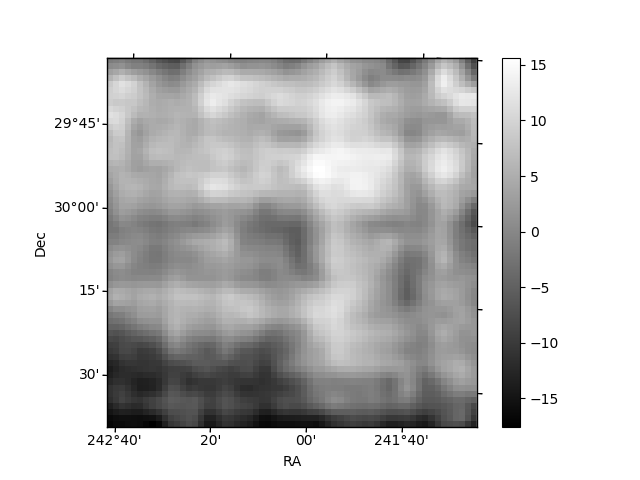
Histogram calculated using DETX and DETY for each event in the final _common_clean file
| Quadrant A | 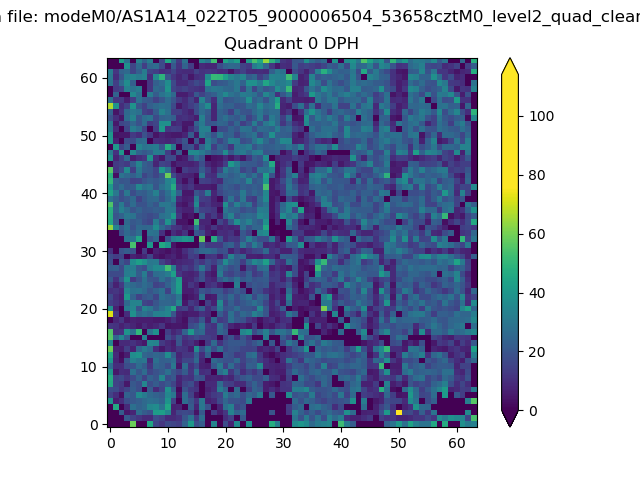 |
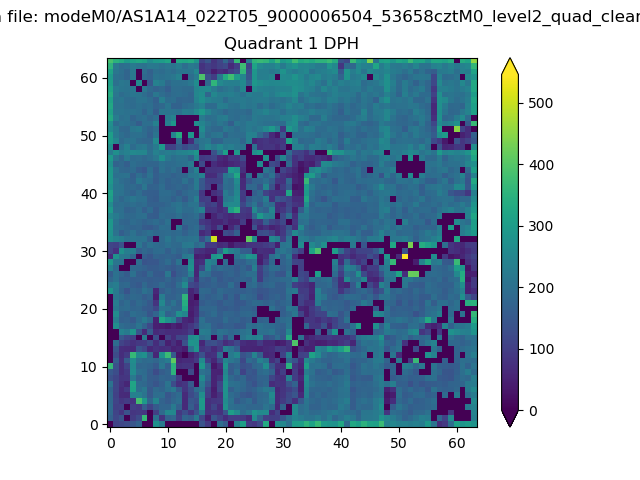 |
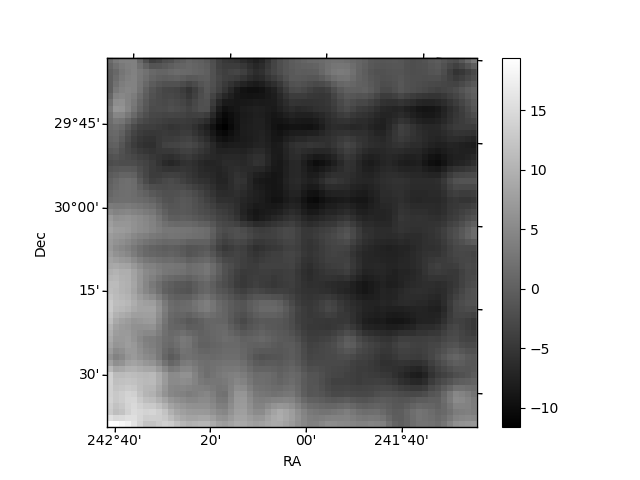
Quadrant B |
|---|---|---|---|
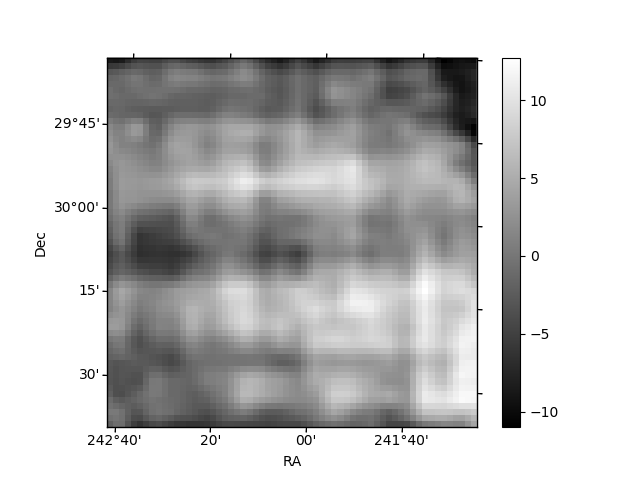
| Quadrant D | 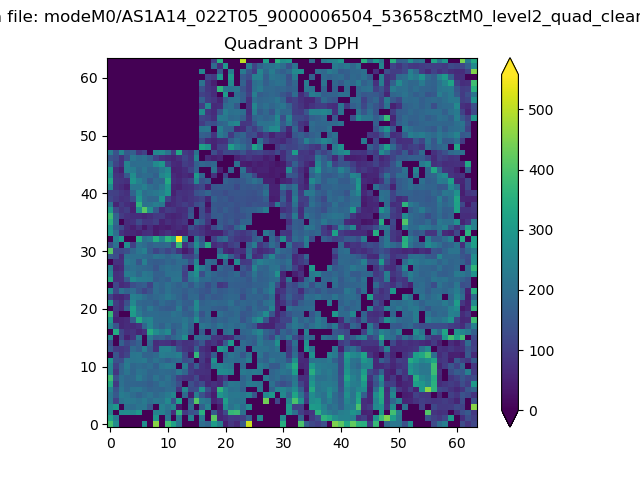 |
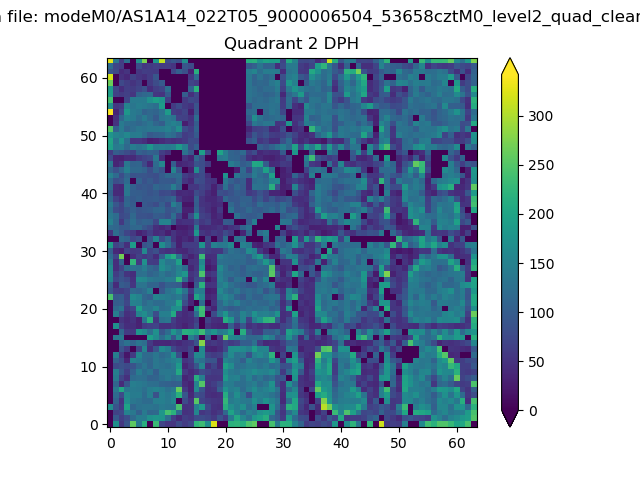 |
Quadrant C |
| Plot type | Count rate plots | Images |
|---|---|---|
| Comparison with Poisson distribution Blue bars denote a histogram of data divided into 1 sec bins. Red curve is a Poisson curve with rate = median count rate of data. |
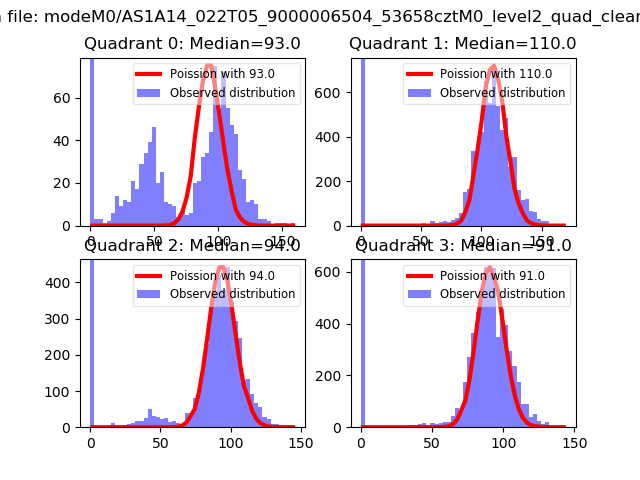 |
 |
| Quadrant-wise count rates Data is divided into 100 sec bins |
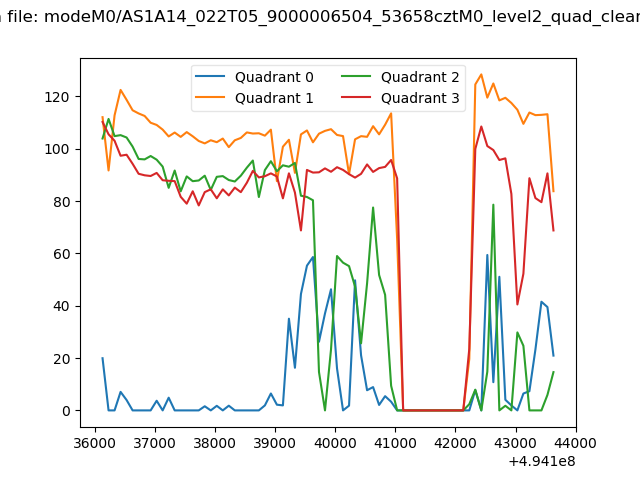 |
|
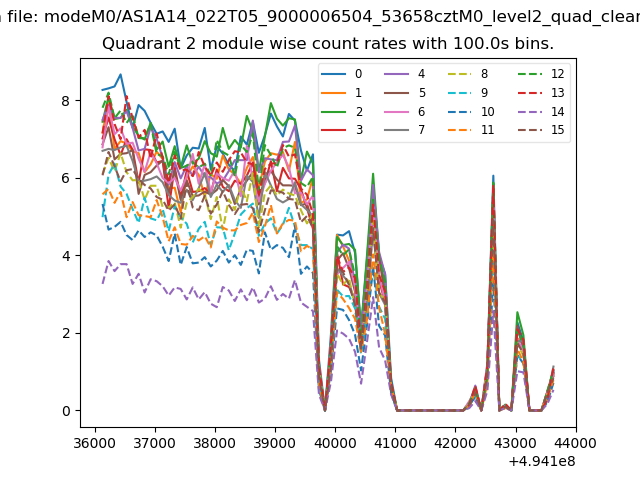
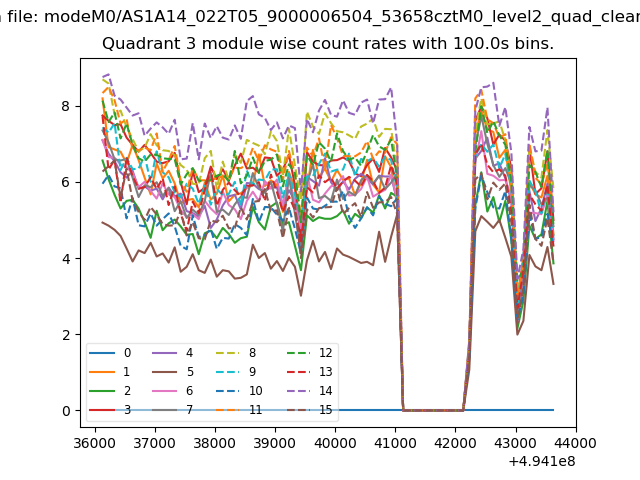
| Module-wise count rates for Quadrant A Data is divided into 100 sec bins |
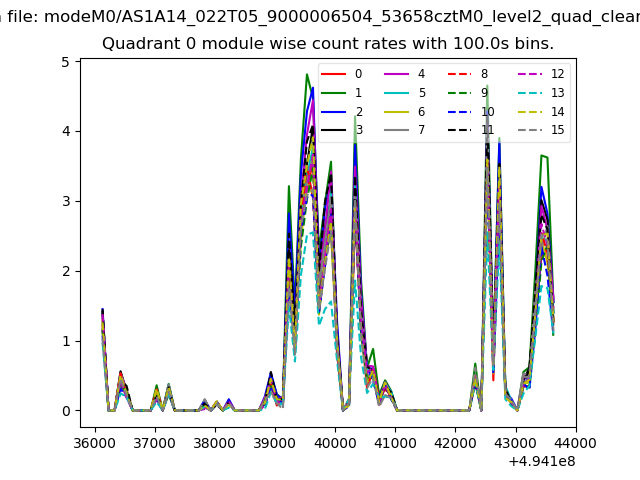 |
 |
| Module-wise count rates for Quadrant B Data is divided into 100 sec bins |
 |
 |
| Module-wise count rates for Quadrant C Data is divided into 100 sec bins |
 |
 |
| Module-wise count rates for Quadrant D Data is divided into 100 sec bins |
 |
 |
| Parameter | Plot |
|---|---|
| CZT HV Monitor | 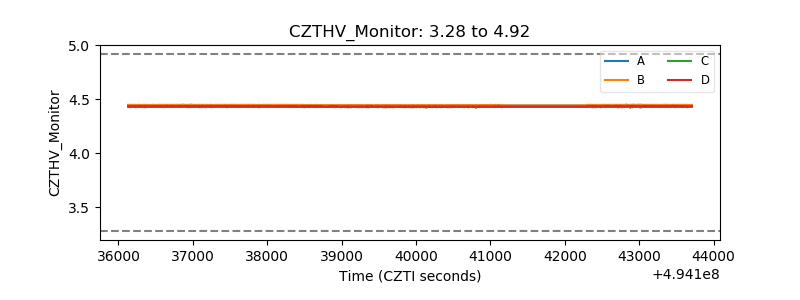 |
| D_VDD | 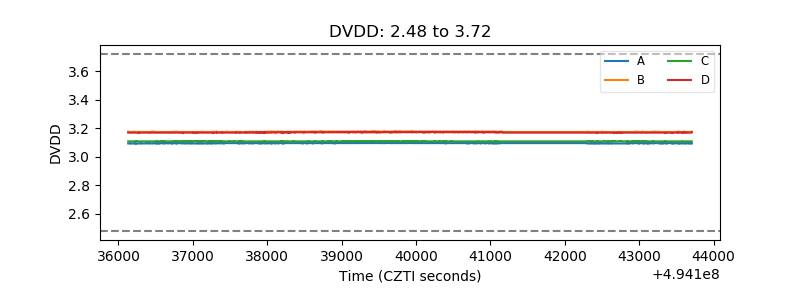 |
| Temperature 1 | 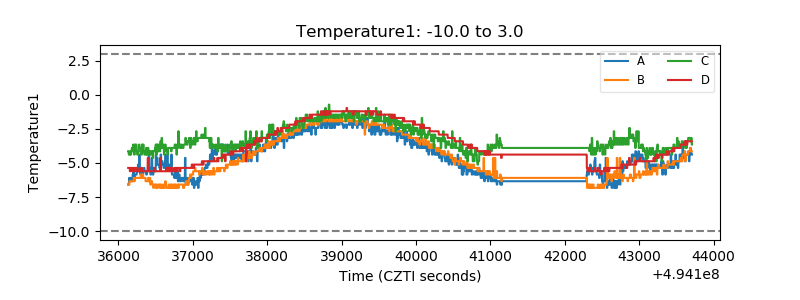 |
| Veto HV Monitor | 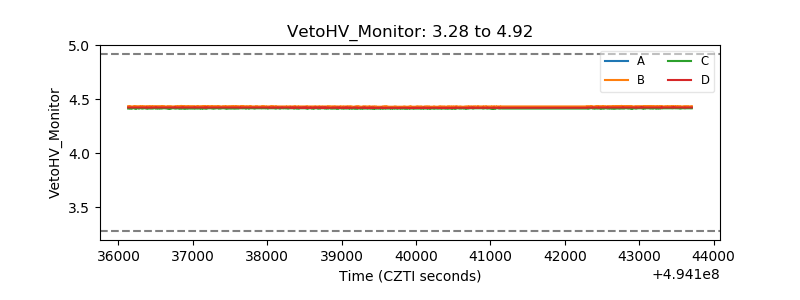 |
| Veto LLD | 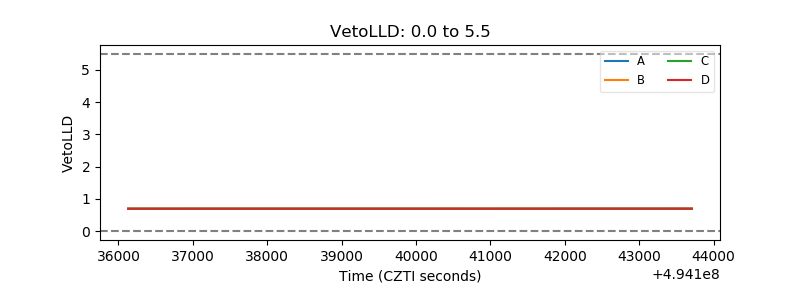 |
| Alpha Counter | 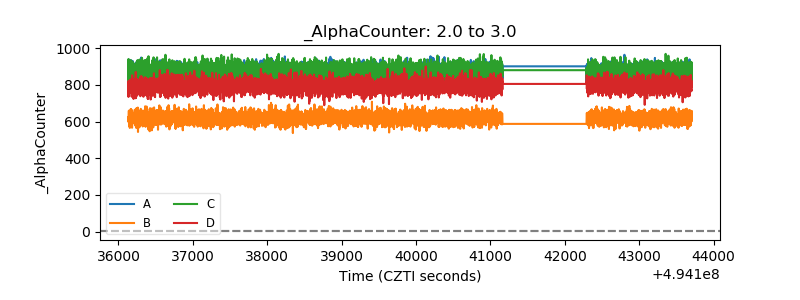 |
| _CPM_Rate | 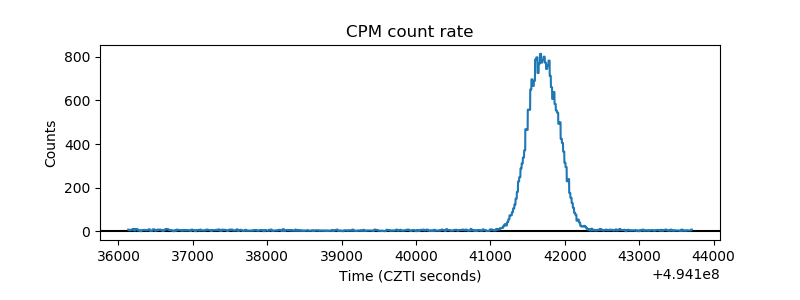 |
| CZT Counter | 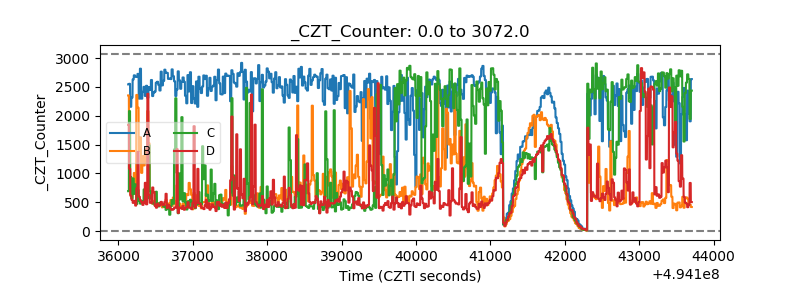 |
| +2.5 Volts monitor |  |
| +5 Volts monitor |  |
| _ROLL_ROT | 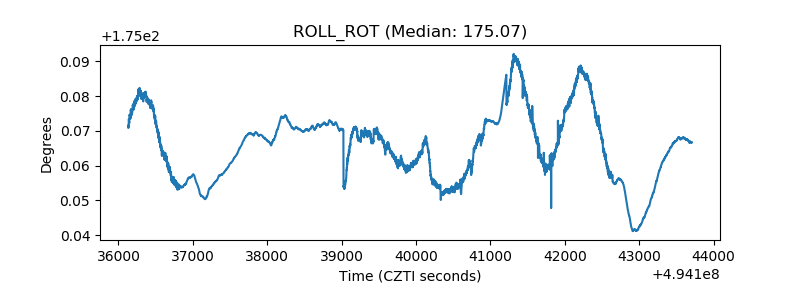 |
| _Roll_DEC | 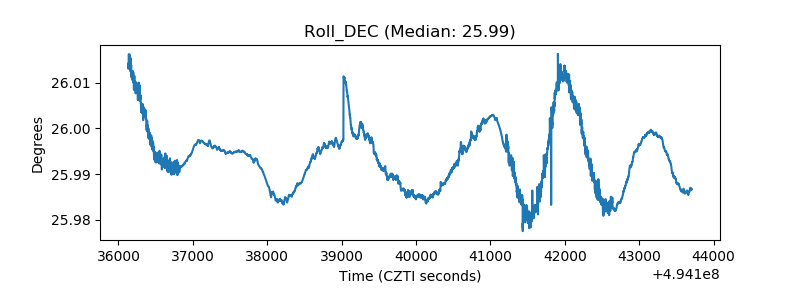 |
| _Roll_RA | 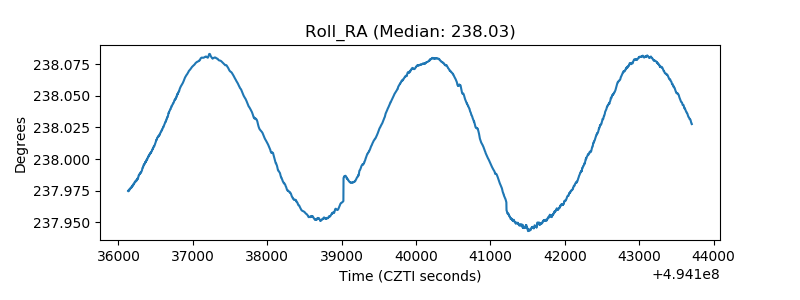 |
| Veto Counter | 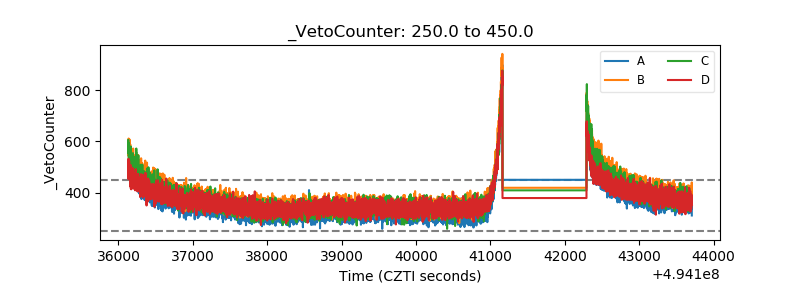 |