| Param | Original file | Final file |
|---|---|---|
| Filename | modeM0/AS1A14_022T05_9000006504_53659cztM0_level2.fits | modeM0/AS1A14_022T05_9000006504_53659cztM0_level2_quad_clean.evt |
| Size (bytes) | 2,297,655,360 | 155,931,840 |
| Size | 2.1 GB | 148.7 MB |
| Events in quadrant A | 35,939,133 | 153,570 |
| Events in quadrant B | 9,992,314 | 1,563,143 |
| Events in quadrant C | 23,489,852 | 814,095 |
| Events in quadrant D | 14,473,972 | 1,152,720 |
| Mode SS | |||
|---|---|---|---|
| Quadrant | BADHDUFLAG | Total packets | Discarded packets |
| A | 0 | 318 | 8 |
| B | 0 | 318 | 6 |
| C | 0 | 318 | 12 |
| D | 0 | 318 | 8 |
| Mode M9 | |||
|---|---|---|---|
| Quadrant | BADHDUFLAG | Total packets | Discarded packets |
| A | 0 | 33 | 0 |
| B | 0 | 33 | 0 |
| C | 0 | 33 | 1 |
| D | 0 | 33 | 1 |
| Mode M0 | |||
|---|---|---|---|
| Quadrant | BADHDUFLAG | Total packets | Discarded packets |
| A | 0 | 121850 | 4885 |
| B | 0 | 41098 | 1256 |
| C | 0 | 85105 | 5101 |
| D | 0 | 55508 | 1953 |
| Quadrant | Total seconds | Saturated seconds | Saturation percentage |
|---|---|---|---|
| A | 14926 | 13757 | 92.168029% |
| B | 15146 | 635 | 4.192526% |
| C | 14919 | 6539 | 43.830015% |
| D | 15076 | 2147 | 14.241178% |
Noise dominated data is calculated using 1-second bins in cleaned event files. If a bin has >2000 counts, and if more than 50% of those come from <1% of pixels, then it is considered to be noise-dominated and hence unusable.
| Quadrant | # 1 sec bins | Bins with >0 counts | Bins with >2000 counts | High rate bins dominated by noise | Noise dominated (total time) | Noise dominated (detector-on time) | Marked lightcurve |
|---|---|---|---|---|---|---|---|
| A | 18968 | 15069 | 12351 | 12351 | 65.11% | 81.96% | 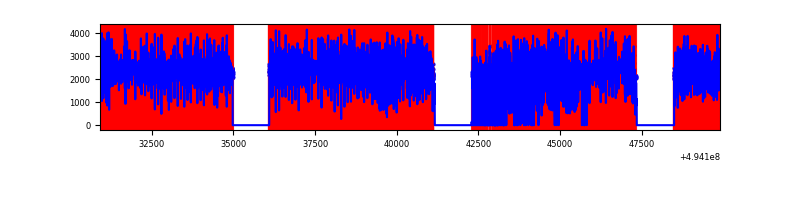 |
| B | 18969 | 15265 | 242 | 242 | 1.28% | 1.59% | 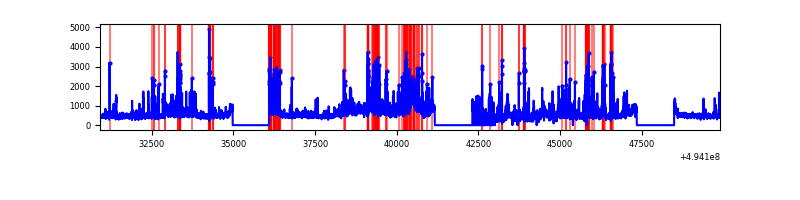 |
| C | 18970 | 15060 | 6062 | 6062 | 31.96% | 40.25% | 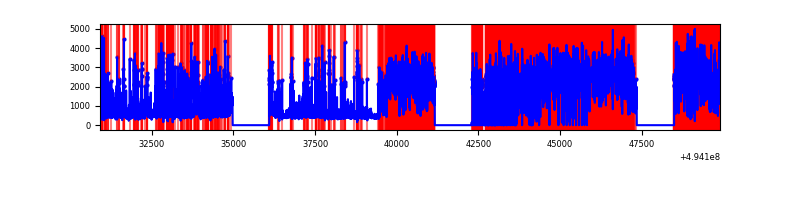 |
| D | 18970 | 15213 | 1857 | 1857 | 9.79% | 12.21% | 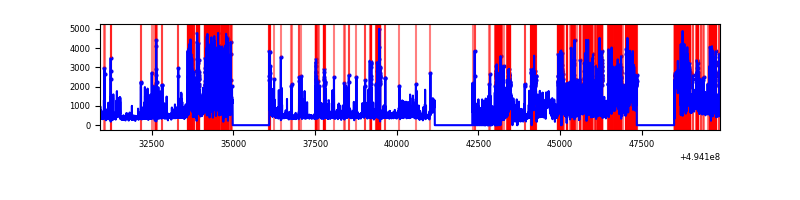 |
Top three noisy pixels from each quadrant. If the there are fewer than three noisy pixels in the level2.evt file, extra rows are filled as -1
| Pixel properties | Quadrant properties | ||||||
|---|---|---|---|---|---|---|---|
| Quadrant | DetID | PixID | Counts | Sigma | Mean | Median | Sigma |
| A | 3 | 63 | 21170505 | 113945.27 | 754 | 737 | 185.8 |
| A | 14 | 254 | 5513412 | 29671.71 | 754 | 737 | 185.8 |
| A | 3 | 78 | 4427791 | 23828.41 | 754 | 737 | 185.8 |
| B | 5 | 172 | 1692664 | 4757.03 | 1667 | 1610 | 355.5 |
| B | 7 | 0 | 762643 | 2140.83 | 1667 | 1610 | 355.5 |
| B | 5 | 185 | 382007 | 1070.08 | 1667 | 1610 | 355.5 |
| C | 1 | 241 | 13775470 | 40122.42 | 1250 | 1240 | 343.3 |
| C | 15 | 224 | 2760525 | 8037.41 | 1250 | 1240 | 343.3 |
| C | 7 | 80 | 567670 | 1649.93 | 1250 | 1240 | 343.3 |
| D | 8 | 176 | 4384992 | 10198.74 | 1506 | 1440 | 429.8 |
| D | 10 | 172 | 2648066 | 6157.62 | 1506 | 1440 | 429.8 |
| D | 10 | 118 | 345583 | 800.68 | 1506 | 1440 | 429.8 |
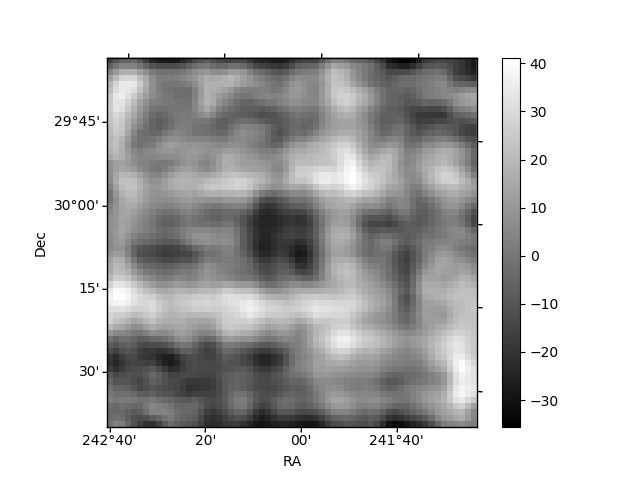
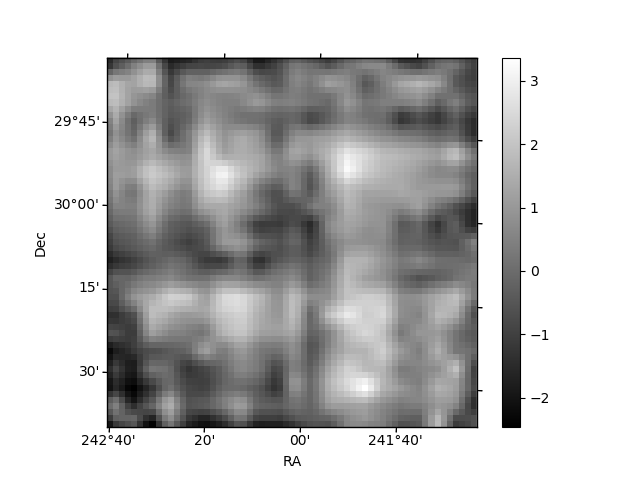
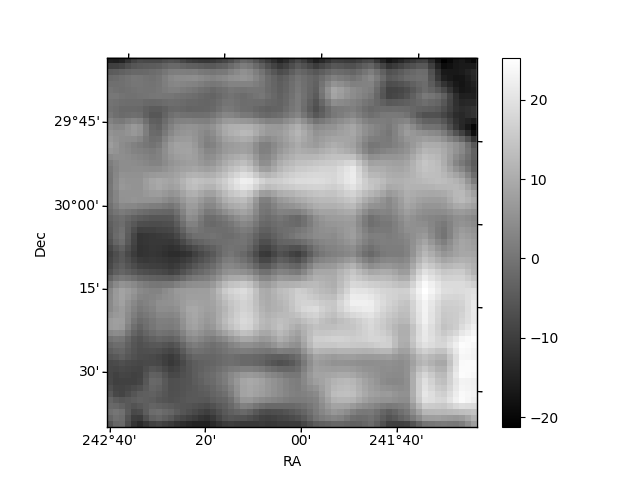
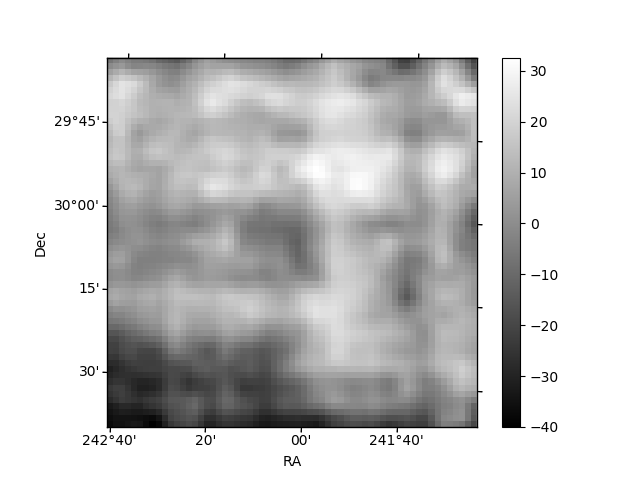
Histogram calculated using DETX and DETY for each event in the final _common_clean file
| Quadrant A | 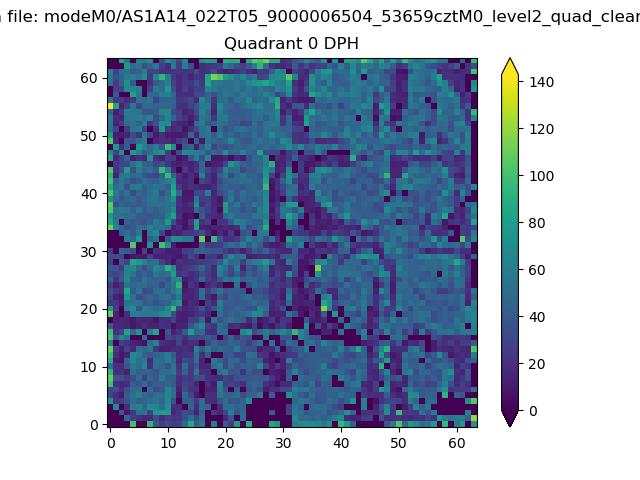 |
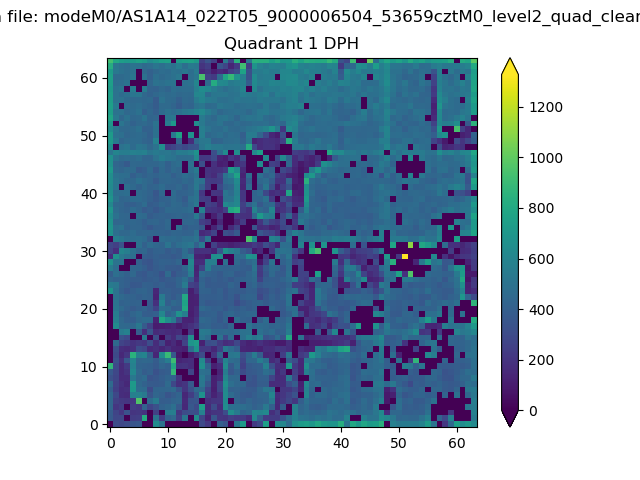 |
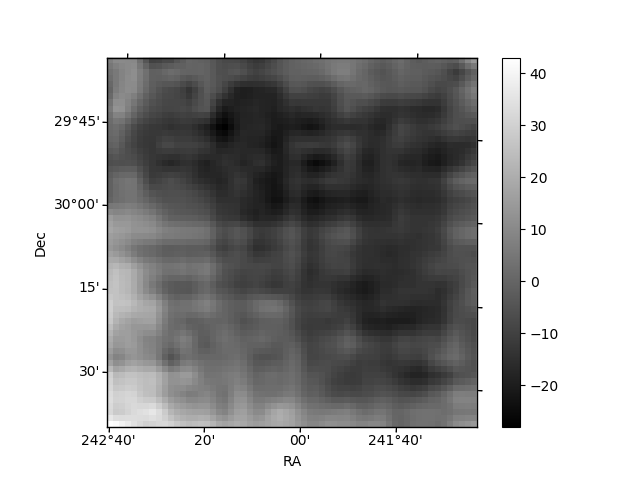
Quadrant B |
|---|---|---|---|
| Quadrant D | 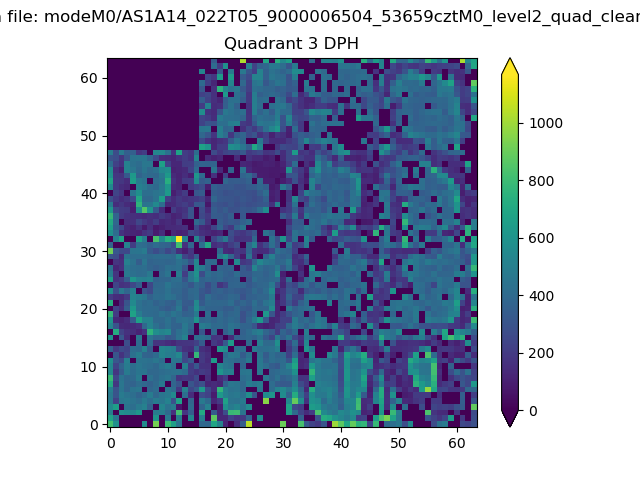 |
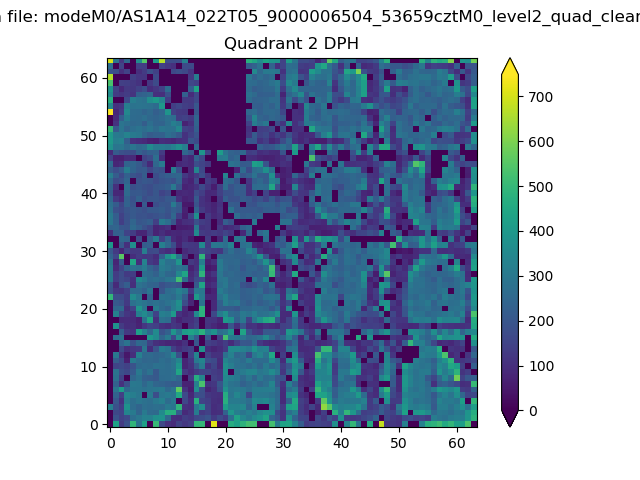 |
Quadrant C |
| Plot type | Count rate plots | Images |
|---|---|---|
| Comparison with Poisson distribution Blue bars denote a histogram of data divided into 1 sec bins. Red curve is a Poisson curve with rate = median count rate of data. |
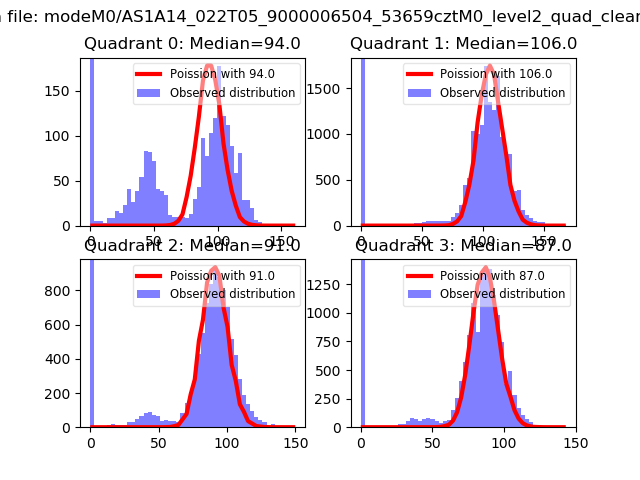 |
 |
| Quadrant-wise count rates Data is divided into 100 sec bins |
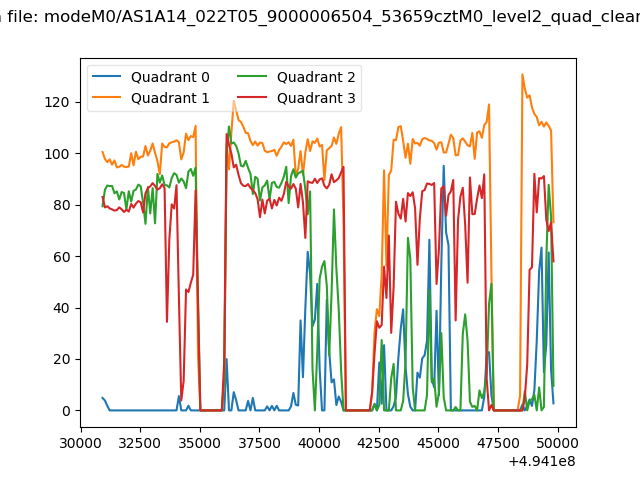 |
|
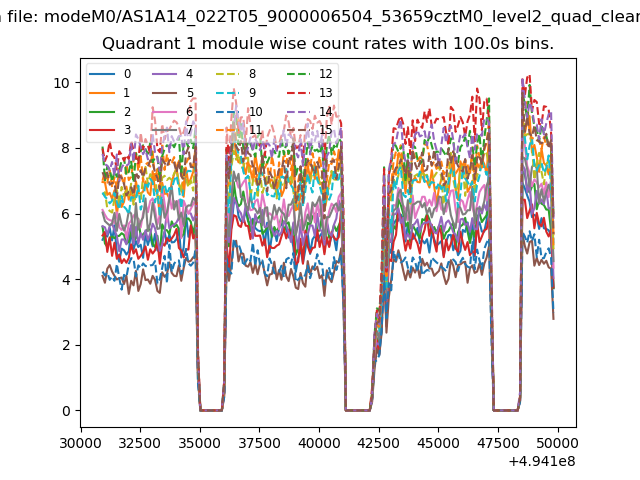
| Module-wise count rates for Quadrant A Data is divided into 100 sec bins |
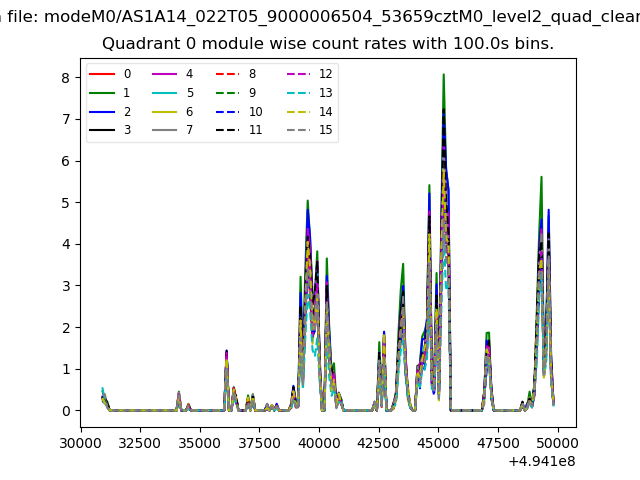 |
 |
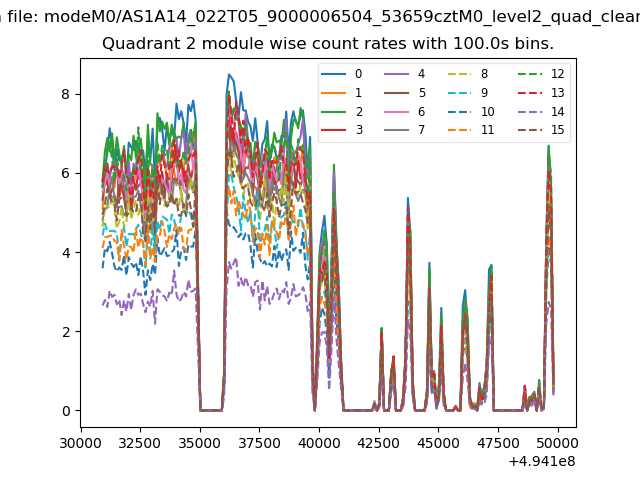
| Module-wise count rates for Quadrant B Data is divided into 100 sec bins |
 |
 |
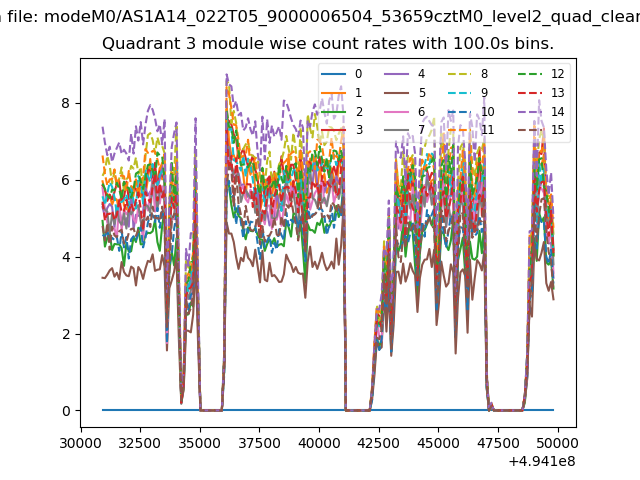
| Module-wise count rates for Quadrant C Data is divided into 100 sec bins |
 |
 |
| Module-wise count rates for Quadrant D Data is divided into 100 sec bins |
 |
 |
| Parameter | Plot |
|---|---|
| CZT HV Monitor | 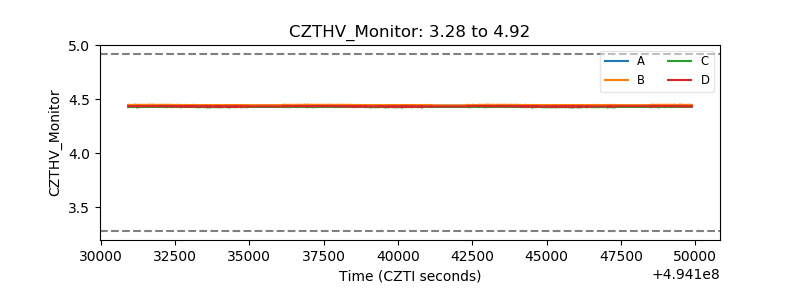 |
| D_VDD | 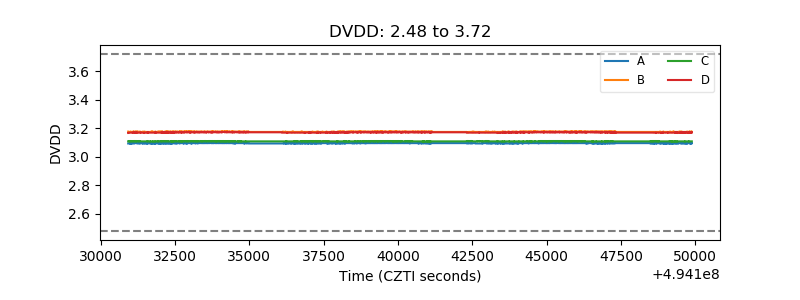 |
| Temperature 1 | 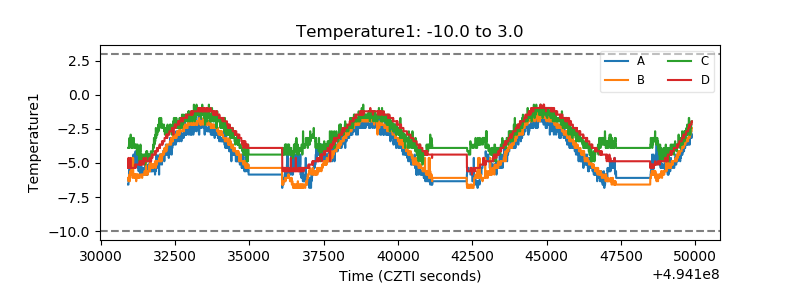 |
| Veto HV Monitor | 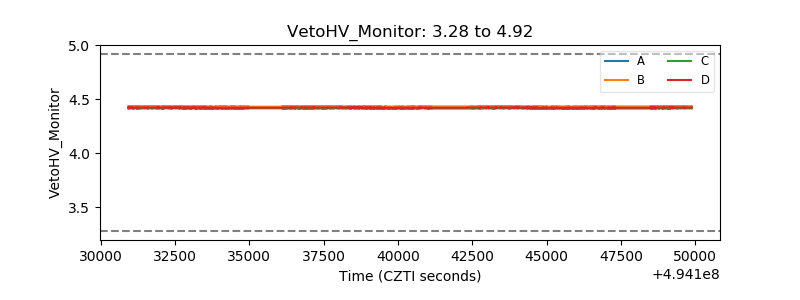 |
| Veto LLD | 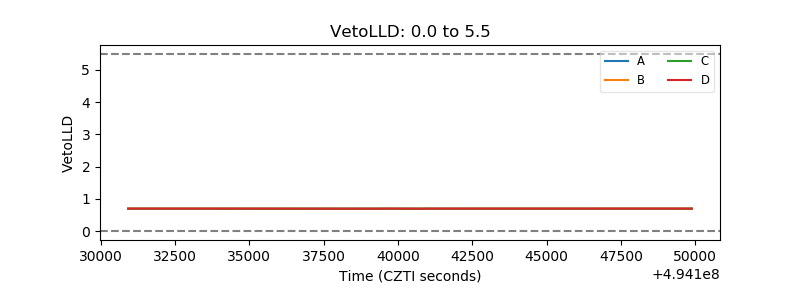 |
| Alpha Counter | 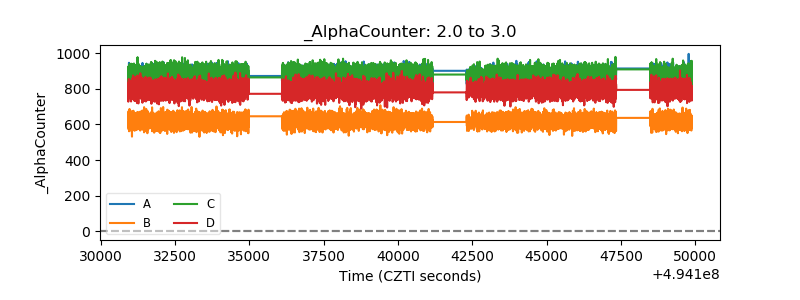 |
| _CPM_Rate | 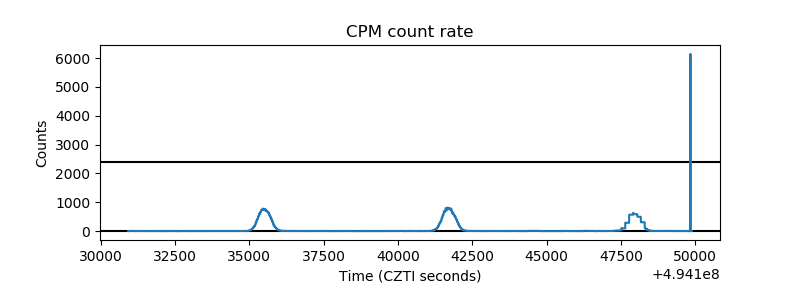 |
| CZT Counter | 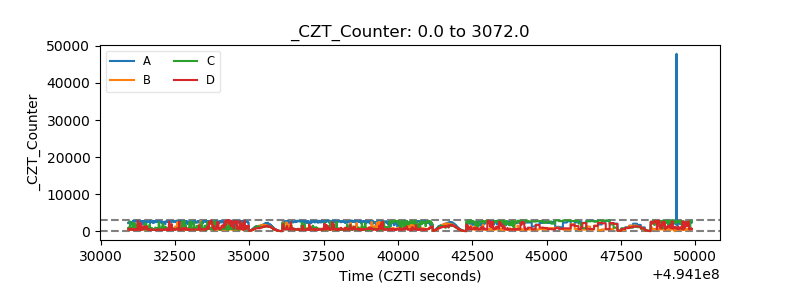 |
| +2.5 Volts monitor |  |
| +5 Volts monitor |  |
| _ROLL_ROT | 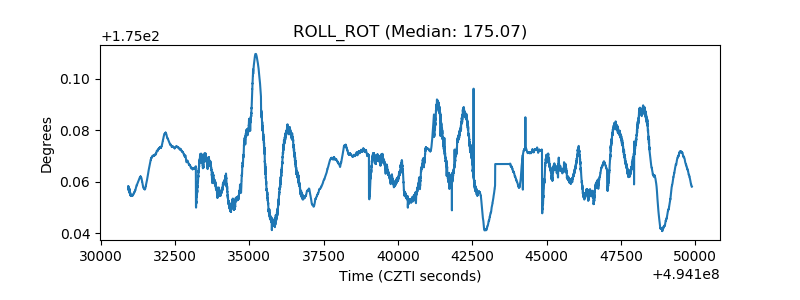 |
| _Roll_DEC | 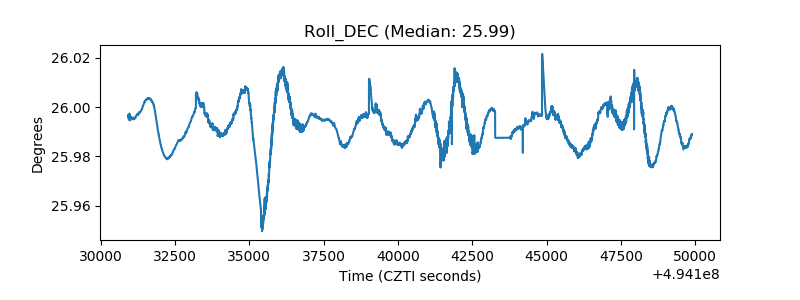 |
| _Roll_RA | 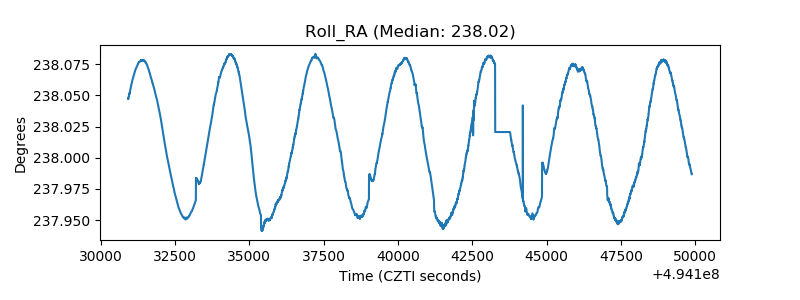 |
| Veto Counter | 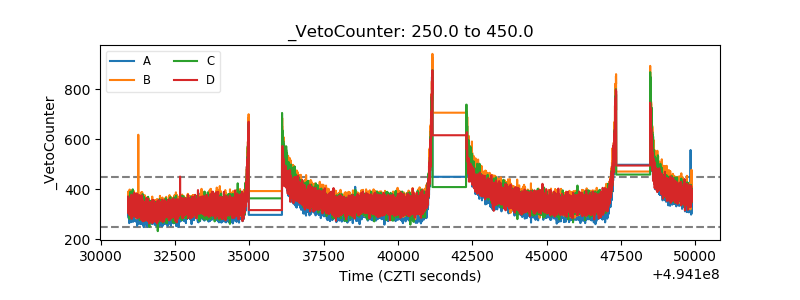 |