| Param | Original file | Final file |
|---|---|---|
| Filename | modeM0/AS1A14_022T05_9000006504_53663cztM0_level2.fits | modeM0/AS1A14_022T05_9000006504_53663cztM0_level2_quad_clean.evt |
| Size (bytes) | 1,058,149,440 | 74,047,680 |
| Size | 1009.1 MB | 70.6 MB |
| Events in quadrant A | 12,896,552 | 344,399 |
| Events in quadrant B | 3,863,733 | 711,766 |
| Events in quadrant C | 16,215,697 | 134,132 |
| Events in quadrant D | 5,656,367 | 567,088 |
| Mode SS | |||
|---|---|---|---|
| Quadrant | BADHDUFLAG | Total packets | Discarded packets |
| A | 0 | 140 | 0 |
| B | 0 | 140 | 0 |
| C | 0 | 140 | 0 |
| D | 0 | 140 | 0 |
| Mode M0 | |||
|---|---|---|---|
| Quadrant | BADHDUFLAG | Total packets | Discarded packets |
| A | 0 | 43111 | 8 |
| B | 0 | 16247 | 0 |
| C | 0 | 52897 | 0 |
| D | 0 | 21518 | 0 |
| Quadrant | Total seconds | Saturated seconds | Saturation percentage |
|---|---|---|---|
| A | 6948 | 3698 | 53.223949% |
| B | 6948 | 167 | 2.403569% |
| C | 6949 | 5643 | 81.205929% |
| D | 6949 | 539 | 7.756512% |
Noise dominated data is calculated using 1-second bins in cleaned event files. If a bin has >2000 counts, and if more than 50% of those come from <1% of pixels, then it is considered to be noise-dominated and hence unusable.
| Quadrant | # 1 sec bins | Bins with >0 counts | Bins with >2000 counts | High rate bins dominated by noise | Noise dominated (total time) | Noise dominated (detector-on time) | Marked lightcurve |
|---|---|---|---|---|---|---|---|
| A | 6948 | 6948 | 3213 | 3213 | 46.24% | 46.24% | 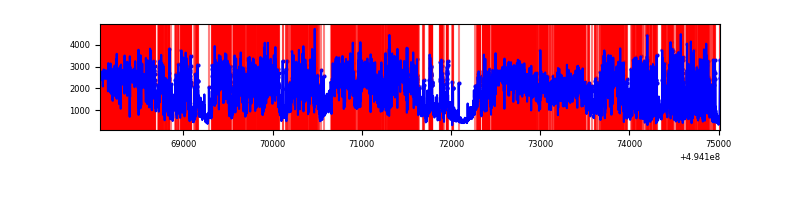 |
| B | 6948 | 6948 | 37 | 37 | 0.53% | 0.53% | 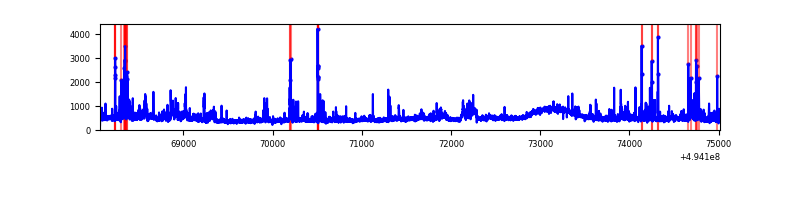 |
| C | 6949 | 6949 | 5366 | 5366 | 77.22% | 77.22% | 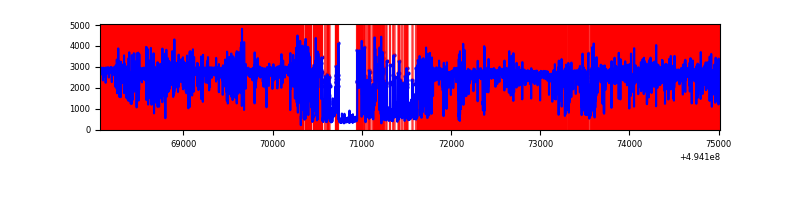 |
| D | 6949 | 6949 | 438 | 438 | 6.30% | 6.30% | 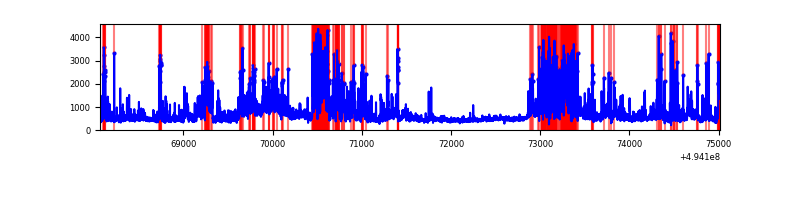 |
Top three noisy pixels from each quadrant. If the there are fewer than three noisy pixels in the level2.evt file, extra rows are filled as -1
| Pixel properties | Quadrant properties | ||||||
|---|---|---|---|---|---|---|---|
| Quadrant | DetID | PixID | Counts | Sigma | Mean | Median | Sigma |
| A | 3 | 63 | 8163209 | 54867.68 | 594 | 578 | 148.8 |
| A | 3 | 78 | 887439 | 5961.31 | 594 | 578 | 148.8 |
| A | 14 | 254 | 606449 | 4072.55 | 594 | 578 | 148.8 |
| B | 7 | 0 | 181191 | 1089.05 | 765 | 736 | 165.7 |
| B | 5 | 185 | 150891 | 906.19 | 765 | 736 | 165.7 |
| B | 5 | 172 | 90745 | 543.2 | 765 | 736 | 165.7 |
| C | 1 | 241 | 11093483 | 105386.05 | 376 | 373 | 105.3 |
| C | 15 | 224 | 2157115 | 20489.34 | 376 | 373 | 105.3 |
| C | 9 | 38 | 620967 | 5895.73 | 376 | 373 | 105.3 |
| D | 10 | 172 | 1160863 | 5661.21 | 719 | 687 | 204.9 |
| D | 12 | 16 | 590664 | 2878.86 | 719 | 687 | 204.9 |
| D | 2 | 153 | 167219 | 812.61 | 719 | 687 | 204.9 |
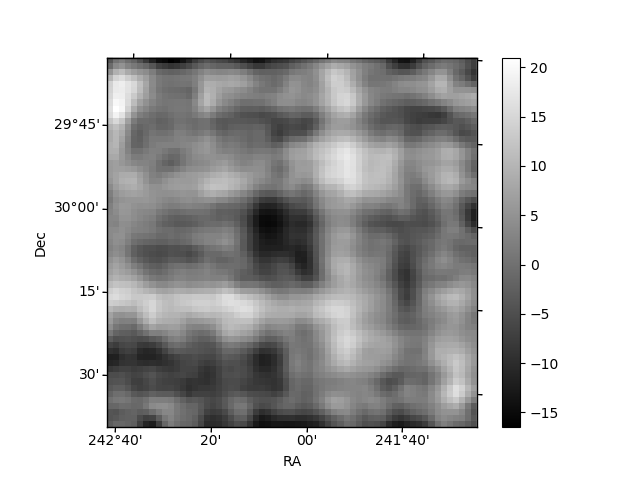
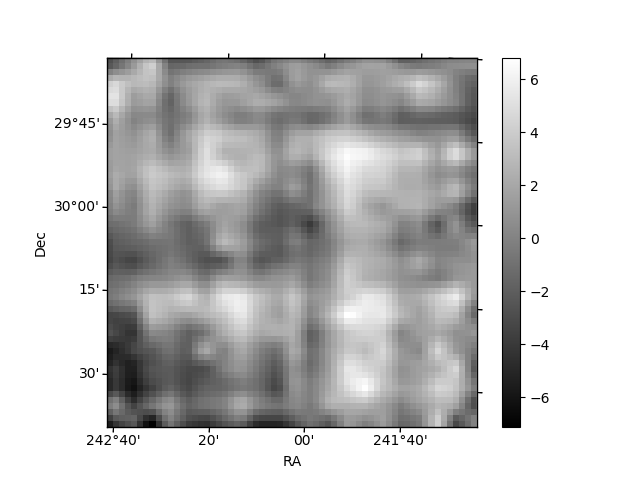
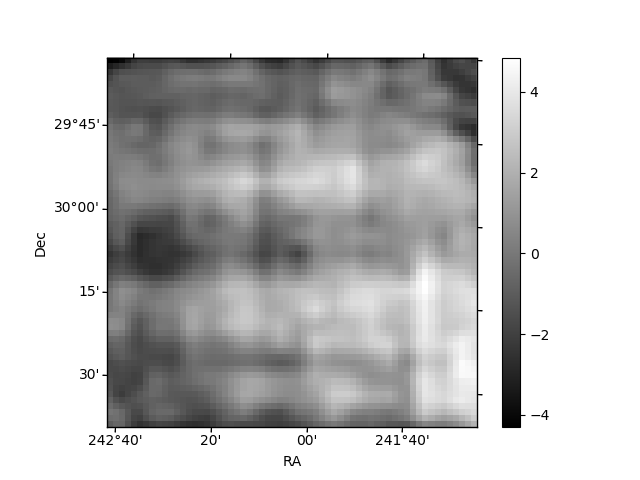
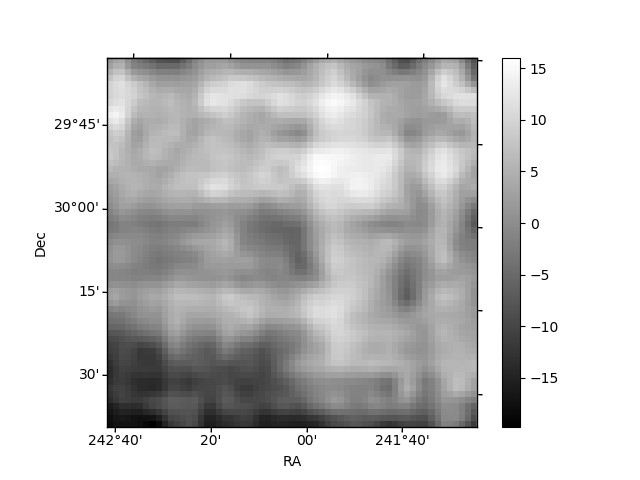
Histogram calculated using DETX and DETY for each event in the final _common_clean file
| Quadrant A | 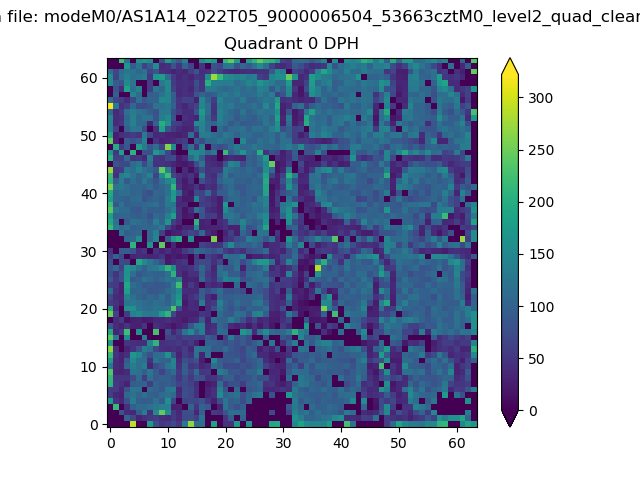 |
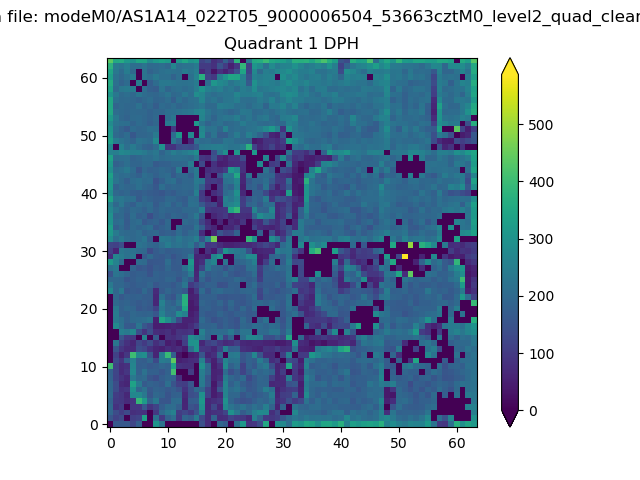 |
Quadrant B |
|---|---|---|---|
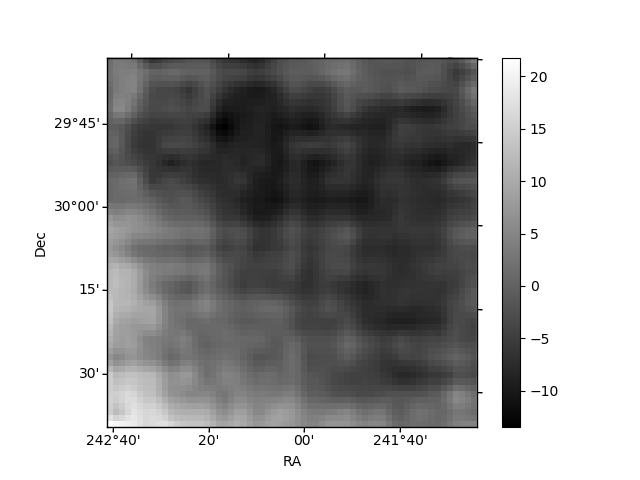
| Quadrant D | 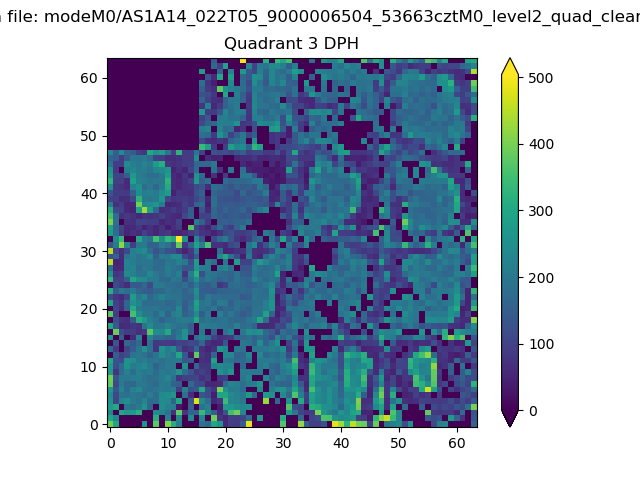 |
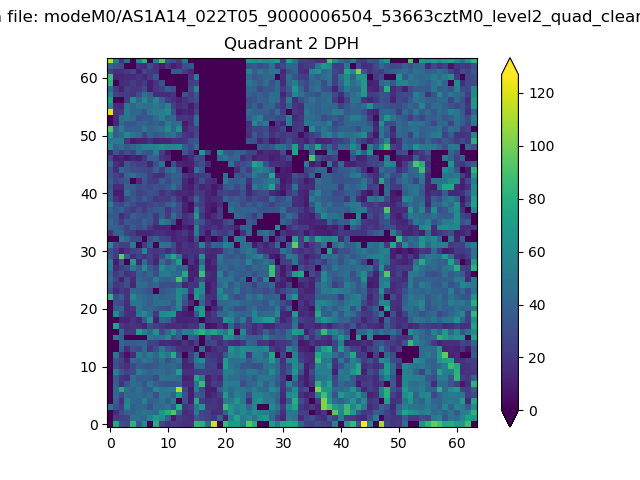 |
Quadrant C |
| Plot type | Count rate plots | Images |
|---|---|---|
| Comparison with Poisson distribution Blue bars denote a histogram of data divided into 1 sec bins. Red curve is a Poisson curve with rate = median count rate of data. |
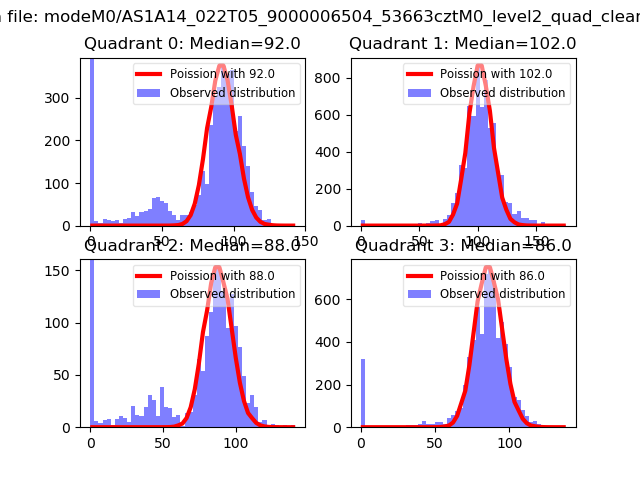 |
 |
| Quadrant-wise count rates Data is divided into 100 sec bins |
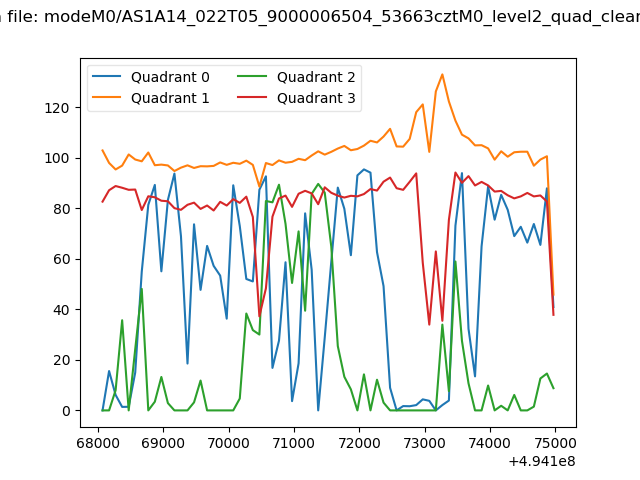 |
|
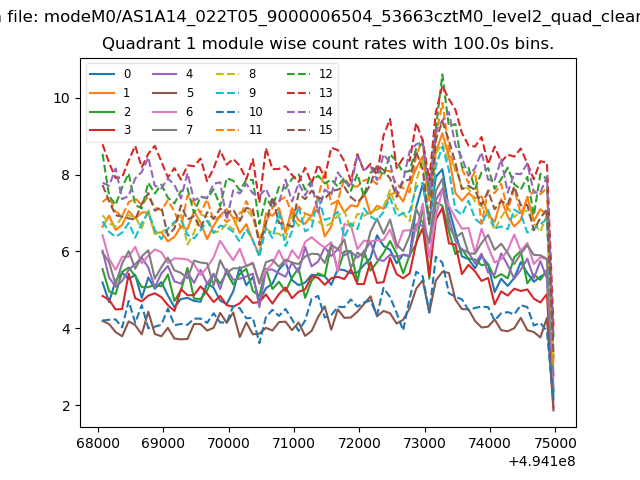
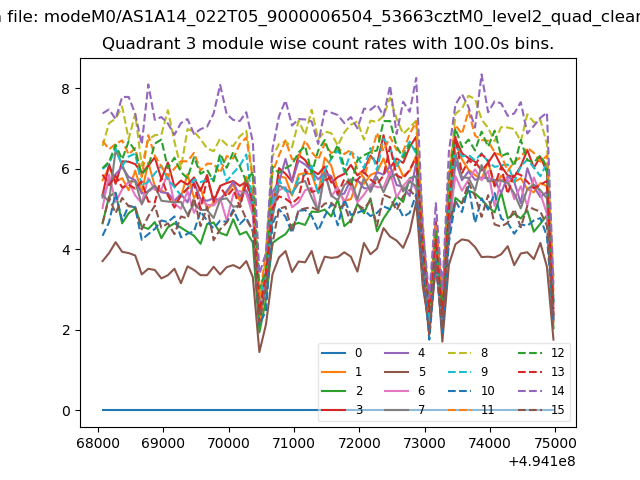
| Module-wise count rates for Quadrant A Data is divided into 100 sec bins |
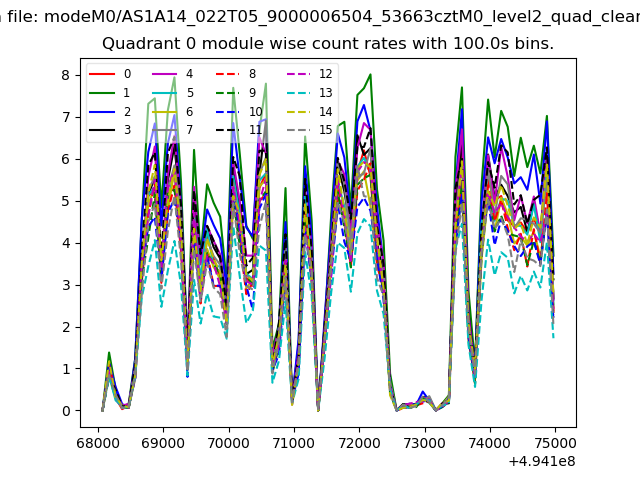 |
 |
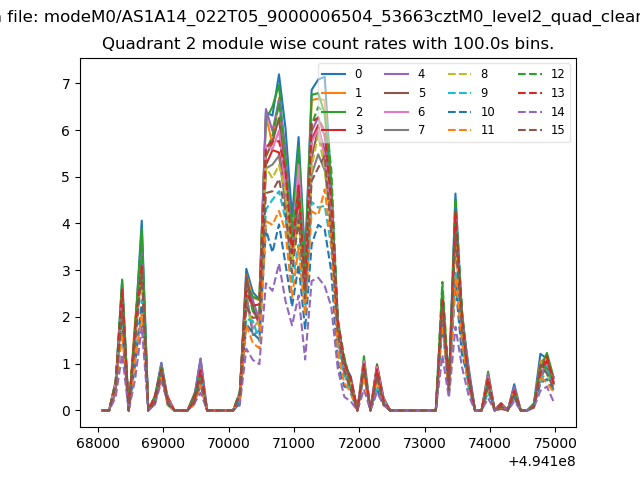
| Module-wise count rates for Quadrant B Data is divided into 100 sec bins |
 |
 |
| Module-wise count rates for Quadrant C Data is divided into 100 sec bins |
 |
 |
| Module-wise count rates for Quadrant D Data is divided into 100 sec bins |
 |
 |
| Parameter | Plot |
|---|---|
| CZT HV Monitor |  |
| D_VDD | 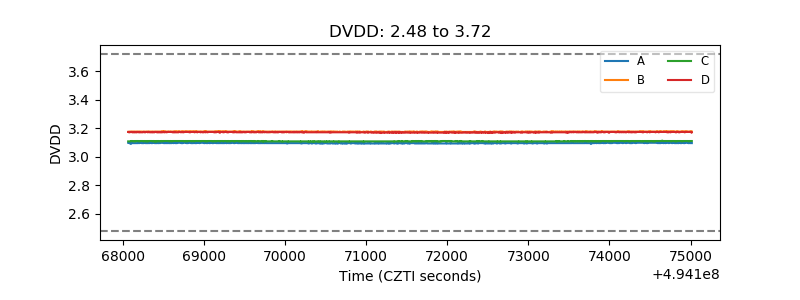 |
| Temperature 1 | 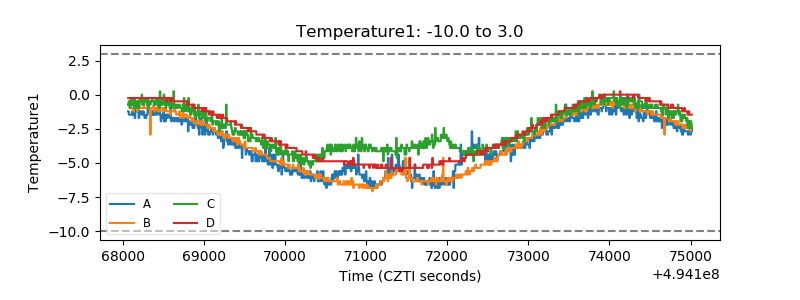 |
| Veto HV Monitor | 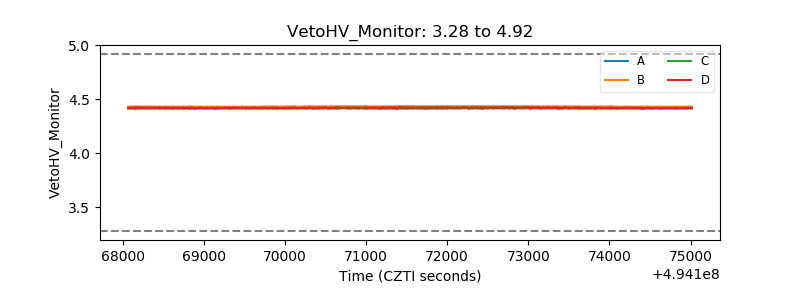 |
| Veto LLD | 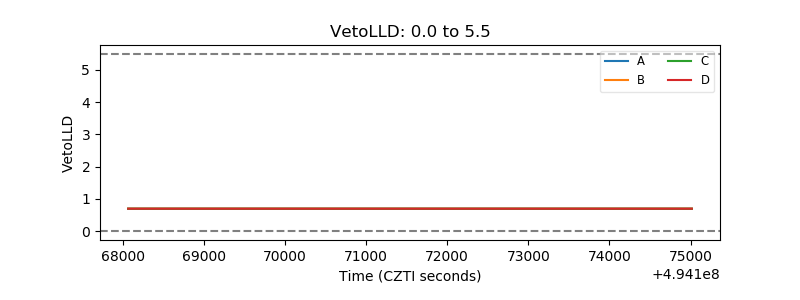 |
| Alpha Counter | 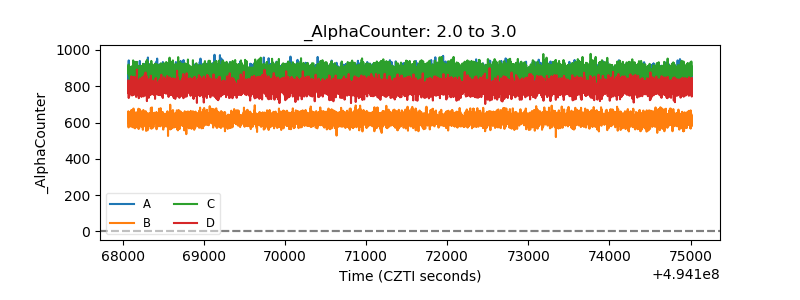 |
| _CPM_Rate | 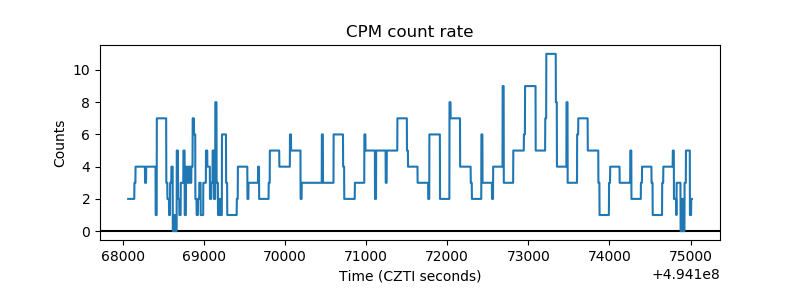 |
| CZT Counter | 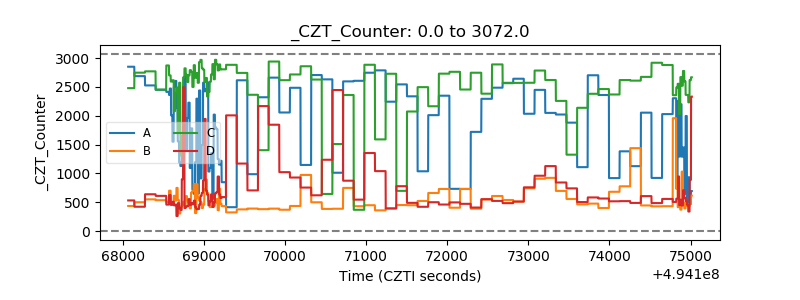 |
| +2.5 Volts monitor |  |
| +5 Volts monitor |  |
| _ROLL_ROT |  |
| _Roll_DEC | 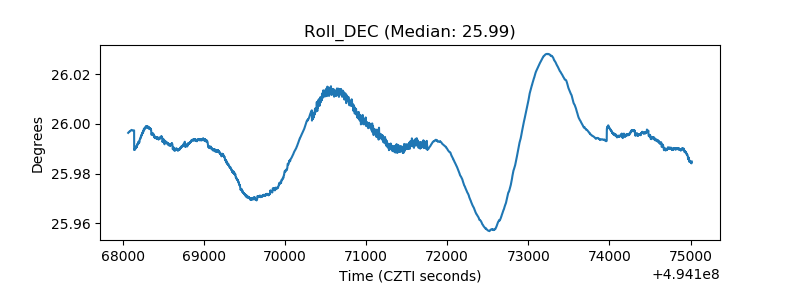 |
| _Roll_RA | 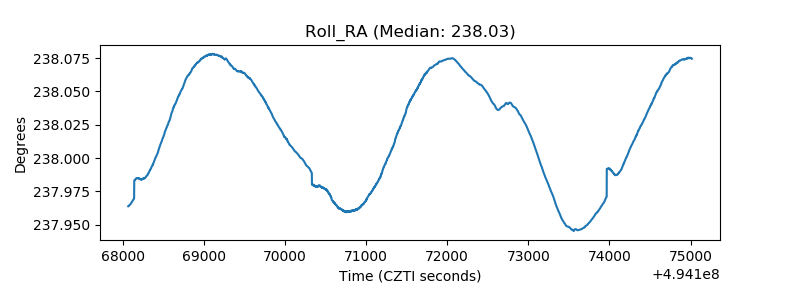 |
| Veto Counter | 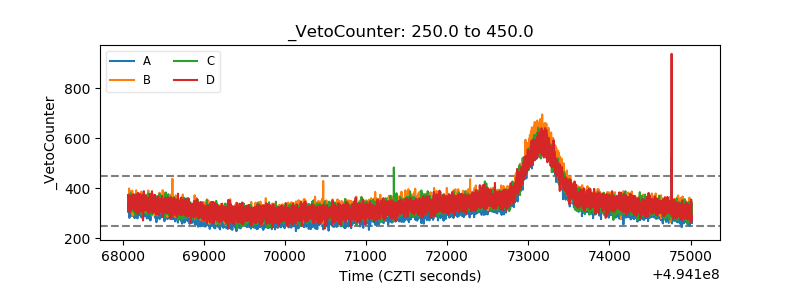 |