| Param | Original file | Final file |
|---|---|---|
| Filename | modeM0/AS1A14_022T05_9000006504_53664cztM0_level2.fits | modeM0/AS1A14_022T05_9000006504_53664cztM0_level2_quad_clean.evt |
| Size (bytes) | 1,098,446,400 | 87,073,920 |
| Size | 1.0 GB | 83.0 MB |
| Events in quadrant A | 12,108,233 | 494,600 |
| Events in quadrant B | 4,044,244 | 781,782 |
| Events in quadrant C | 17,059,642 | 196,659 |
| Events in quadrant D | 6,855,407 | 628,228 |
| Mode SS | |||
|---|---|---|---|
| Quadrant | BADHDUFLAG | Total packets | Discarded packets |
| A | 0 | 154 | 0 |
| B | 0 | 154 | 0 |
| C | 0 | 154 | 0 |
| D | 0 | 154 | 0 |
| Mode M0 | |||
|---|---|---|---|
| Quadrant | BADHDUFLAG | Total packets | Discarded packets |
| A | 0 | 41315 | 0 |
| B | 0 | 17381 | 0 |
| C | 0 | 55930 | 0 |
| D | 0 | 25619 | 0 |
| Quadrant | Total seconds | Saturated seconds | Saturation percentage |
|---|---|---|---|
| A | 7687 | 2910 | 37.856121% |
| B | 7687 | 92 | 1.196826% |
| C | 7687 | 5756 | 74.879667% |
| D | 7687 | 571 | 7.428125% |
Noise dominated data is calculated using 1-second bins in cleaned event files. If a bin has >2000 counts, and if more than 50% of those come from <1% of pixels, then it is considered to be noise-dominated and hence unusable.
| Quadrant | # 1 sec bins | Bins with >0 counts | Bins with >2000 counts | High rate bins dominated by noise | Noise dominated (total time) | Noise dominated (detector-on time) | Marked lightcurve |
|---|---|---|---|---|---|---|---|
| A | 7687 | 7687 | 2430 | 2430 | 31.61% | 31.61% | 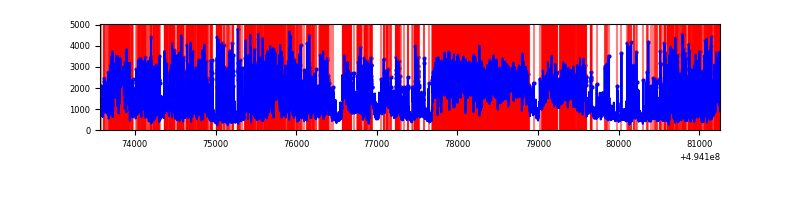 |
| B | 7687 | 7687 | 67 | 67 | 0.87% | 0.87% | 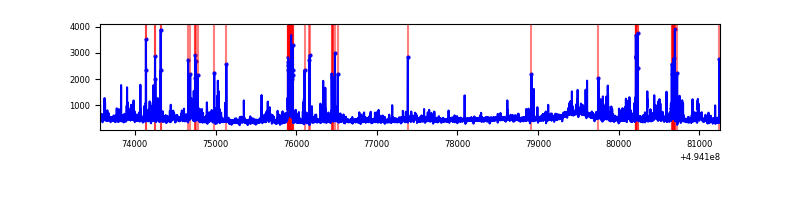 |
| C | 7687 | 7687 | 5337 | 5337 | 69.43% | 69.43% | 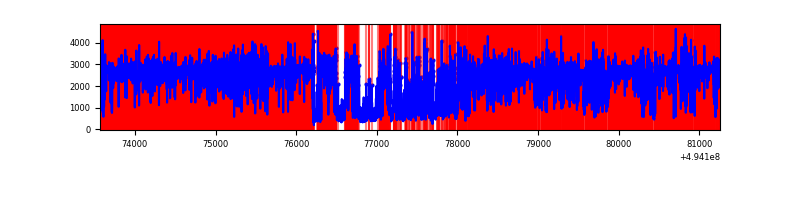 |
| D | 7687 | 7687 | 582 | 582 | 7.57% | 7.57% | 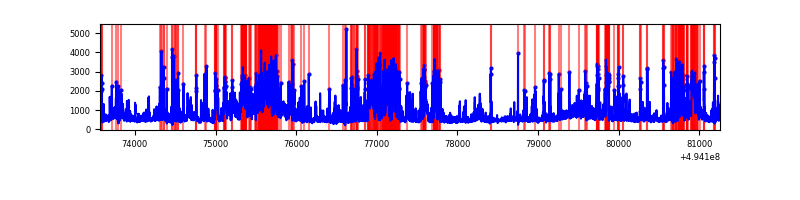 |
Top three noisy pixels from each quadrant. If the there are fewer than three noisy pixels in the level2.evt file, extra rows are filled as -1
| Pixel properties | Quadrant properties | ||||||
|---|---|---|---|---|---|---|---|
| Quadrant | DetID | PixID | Counts | Sigma | Mean | Median | Sigma |
| A | 3 | 63 | 4962963 | 28023.15 | 703 | 683 | 177.1 |
| A | 14 | 254 | 2414257 | 13630.01 | 703 | 683 | 177.1 |
| A | 3 | 78 | 850782 | 4800.7 | 703 | 683 | 177.1 |
| B | 5 | 172 | 243881 | 1371.38 | 822 | 792 | 177.3 |
| B | 5 | 185 | 234260 | 1317.1 | 822 | 792 | 177.3 |
| B | 0 | 182 | 44478 | 246.45 | 822 | 792 | 177.3 |
| C | 1 | 241 | 10153915 | 76254.71 | 479 | 476 | 133.2 |
| C | 15 | 224 | 3233682 | 24282.14 | 479 | 476 | 133.2 |
| C | 7 | 80 | 494243 | 3708.31 | 479 | 476 | 133.2 |
| D | 10 | 172 | 1845386 | 8096.66 | 786 | 750 | 227.8 |
| D | 2 | 37 | 387727 | 1698.56 | 786 | 750 | 227.8 |
| D | 13 | 153 | 327249 | 1433.1 | 786 | 750 | 227.8 |
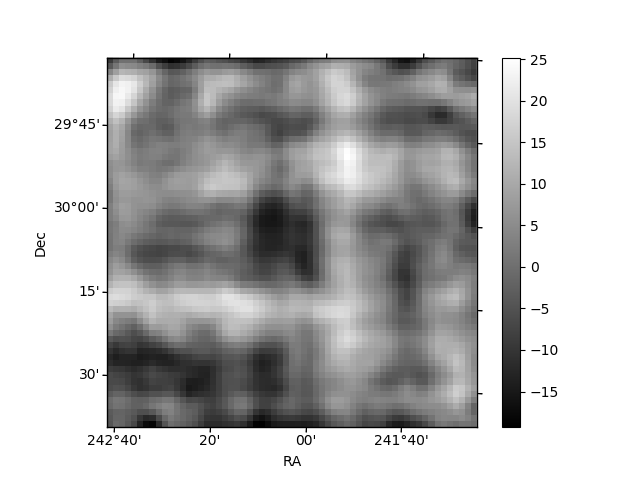
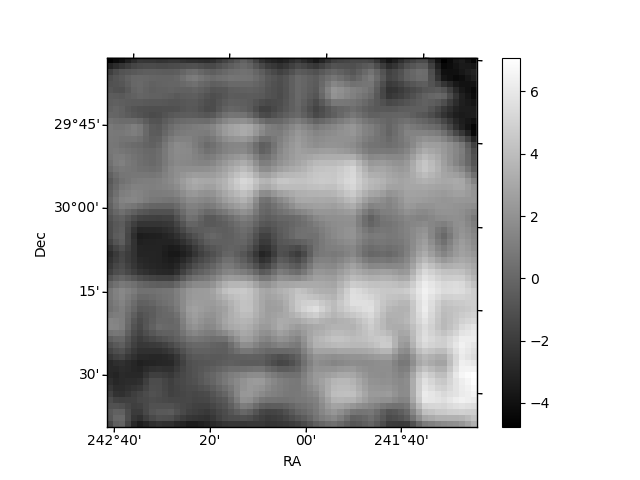
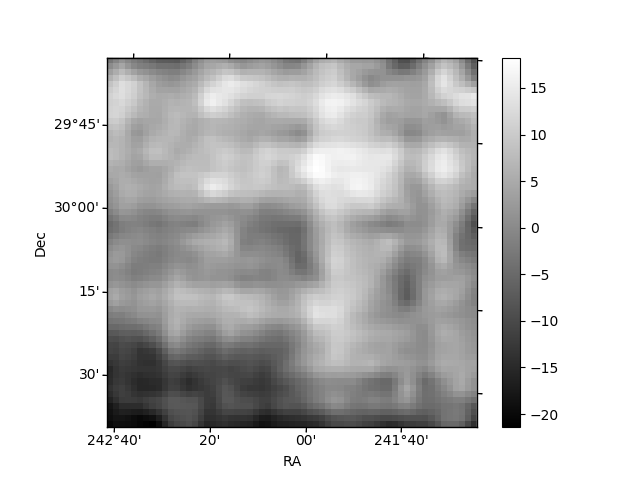
Histogram calculated using DETX and DETY for each event in the final _common_clean file
| Quadrant A | 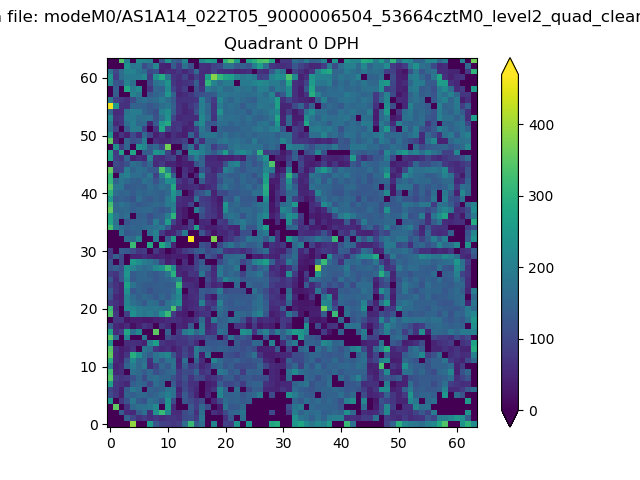 |
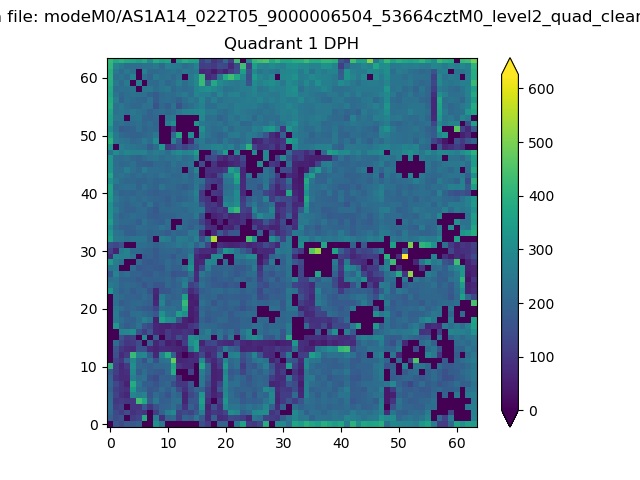 |
Quadrant B |
|---|---|---|---|
| Quadrant D | 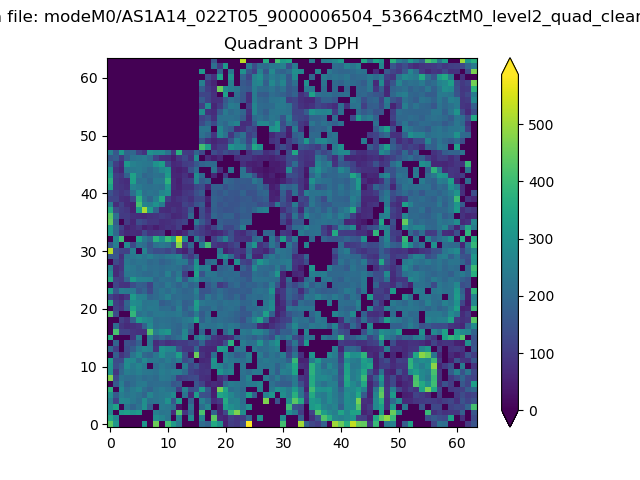 |
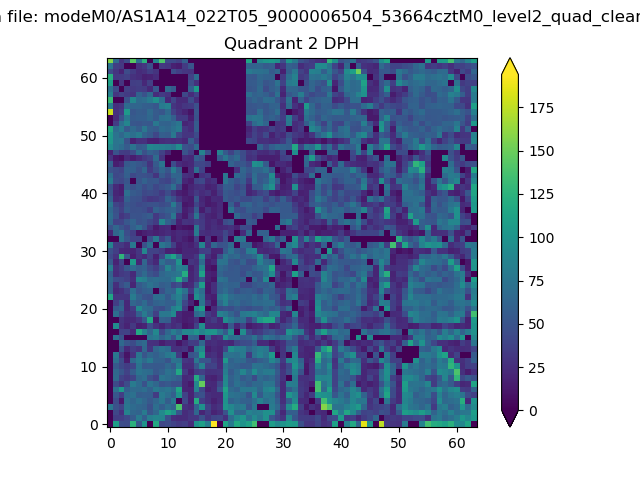 |
Quadrant C |
| Plot type | Count rate plots | Images |
|---|---|---|
| Comparison with Poisson distribution Blue bars denote a histogram of data divided into 1 sec bins. Red curve is a Poisson curve with rate = median count rate of data. |
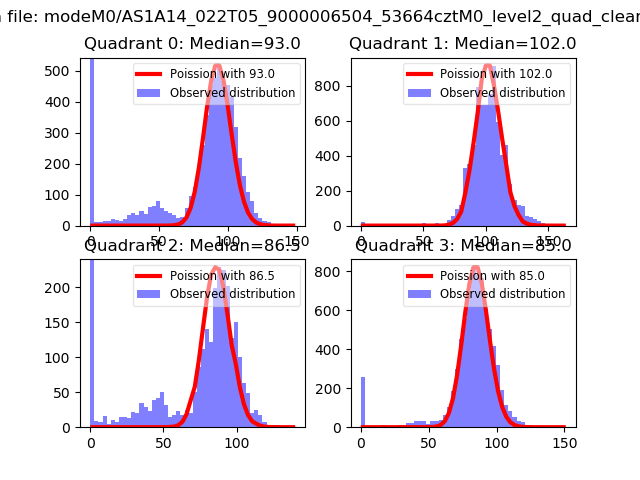 |
 |
| Quadrant-wise count rates Data is divided into 100 sec bins |
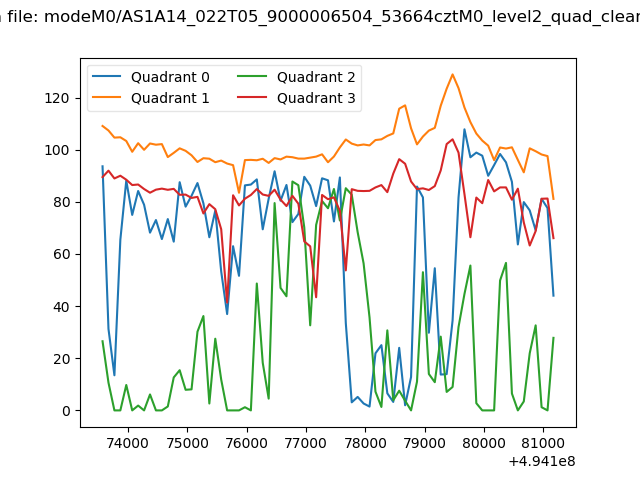 |
|
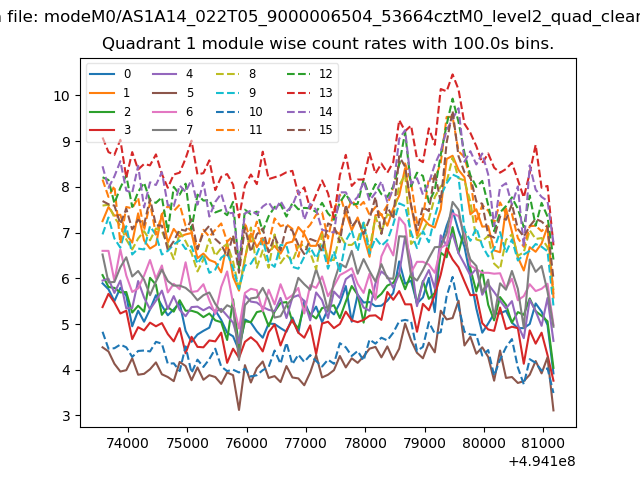
| Module-wise count rates for Quadrant A Data is divided into 100 sec bins |
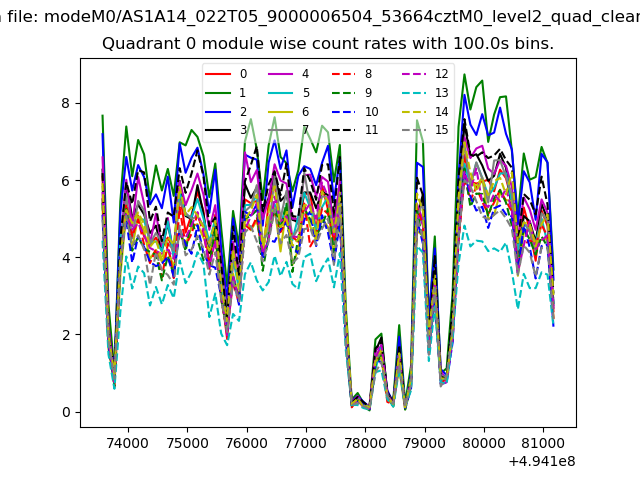 |
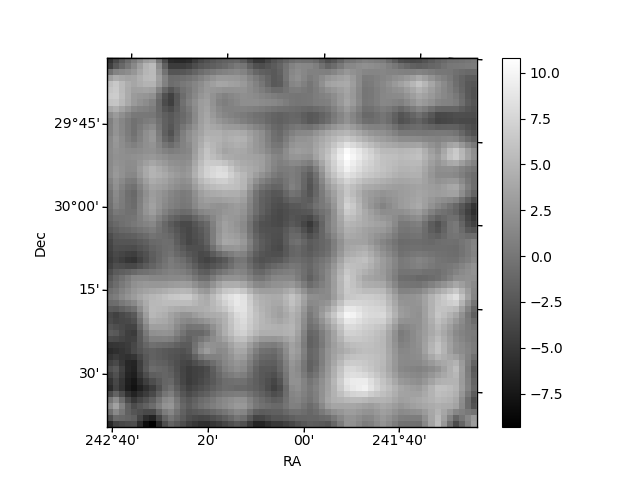 |
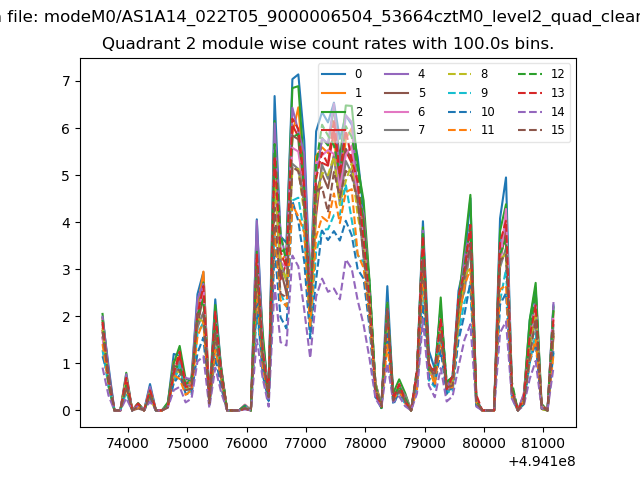
| Module-wise count rates for Quadrant B Data is divided into 100 sec bins |
 |
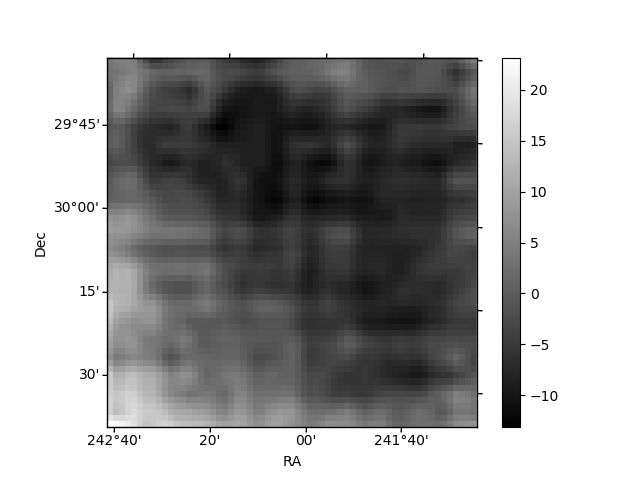 |
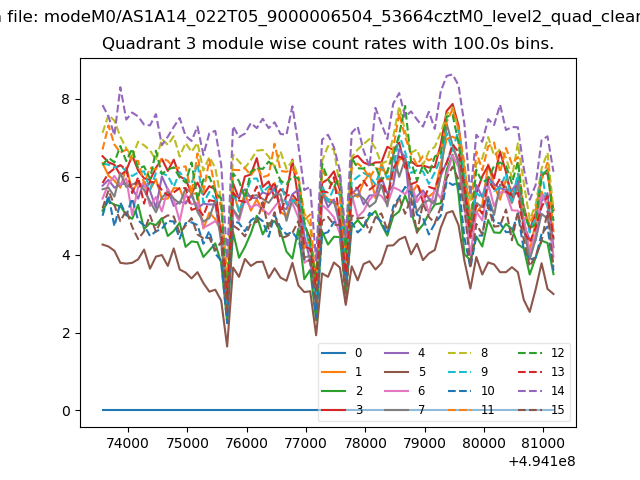
| Module-wise count rates for Quadrant C Data is divided into 100 sec bins |
 |
 |
| Module-wise count rates for Quadrant D Data is divided into 100 sec bins |
 |
 |
| Parameter | Plot |
|---|---|
| CZT HV Monitor | 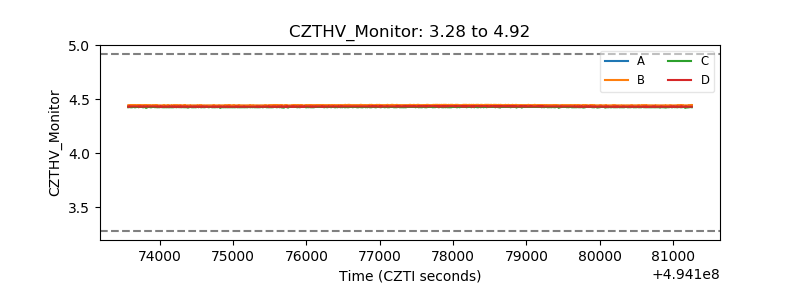 |
| D_VDD | 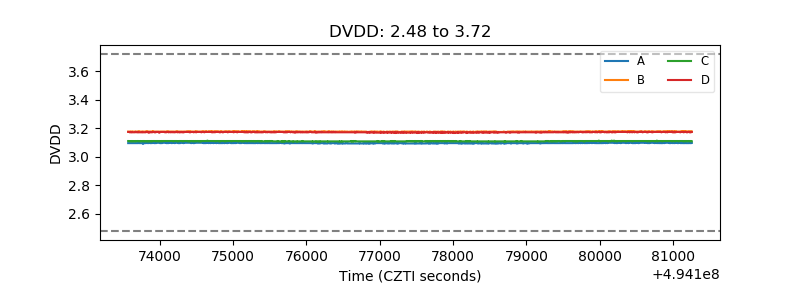 |
| Temperature 1 | 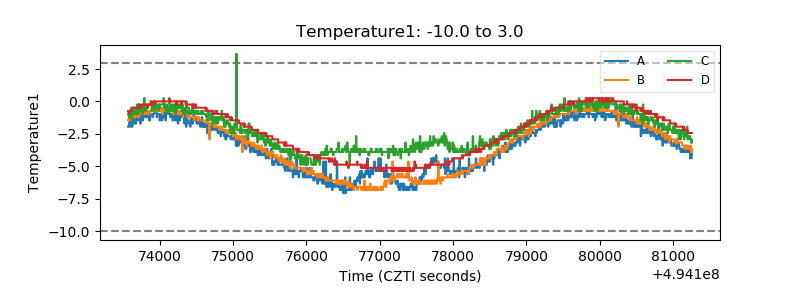 |
| Veto HV Monitor | 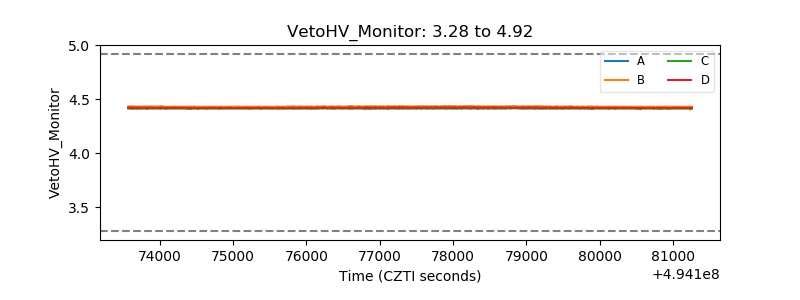 |
| Veto LLD | 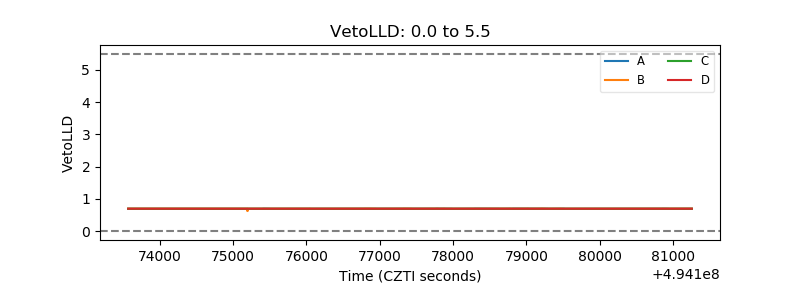 |
| Alpha Counter | 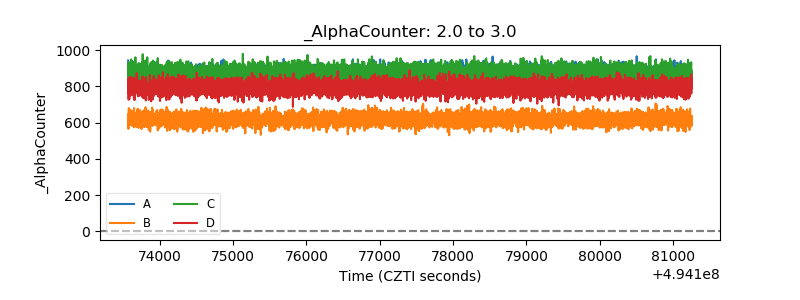 |
| _CPM_Rate | 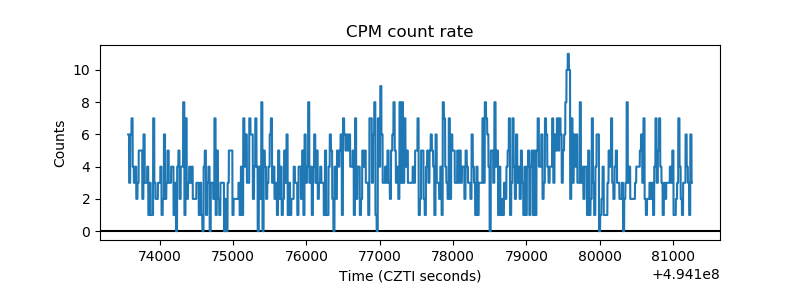 |
| CZT Counter | 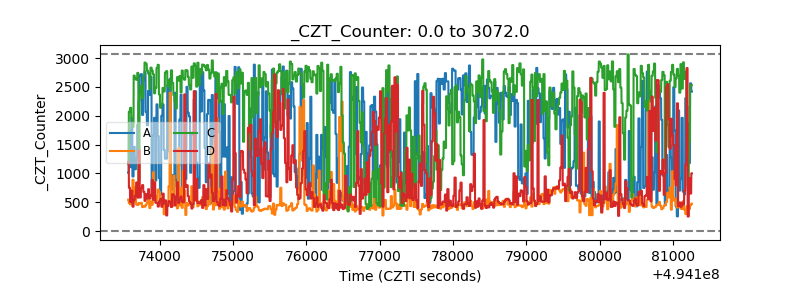 |
| +2.5 Volts monitor | 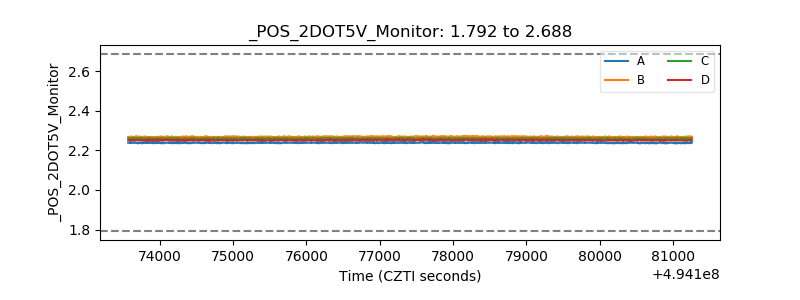 |
| +5 Volts monitor | 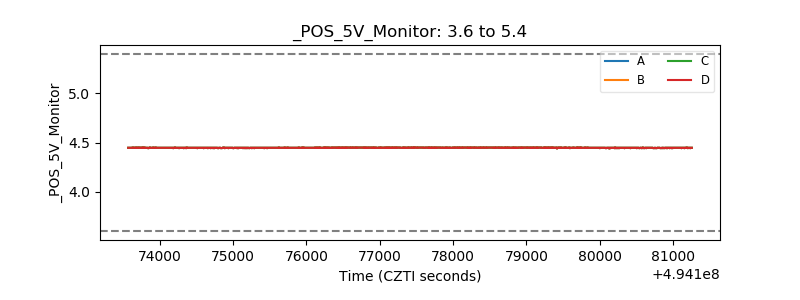 |
| _ROLL_ROT | 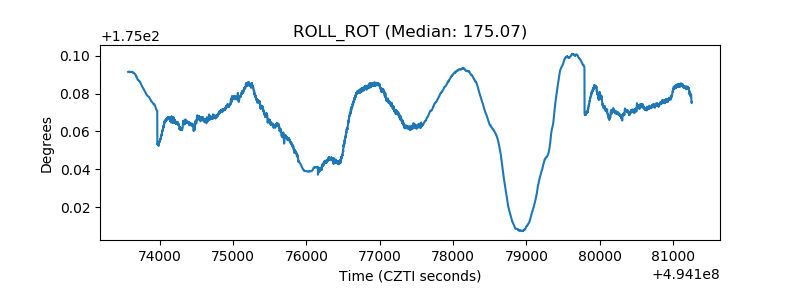 |
| _Roll_DEC | 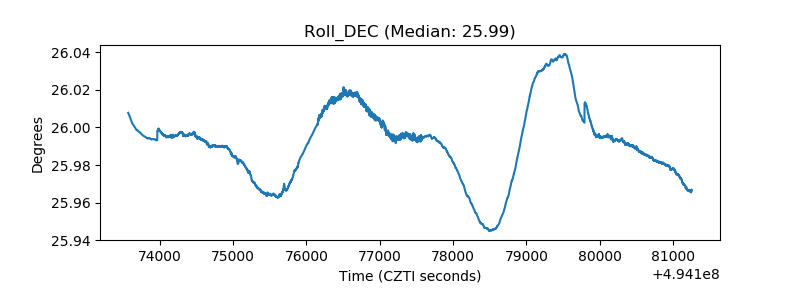 |
| _Roll_RA | 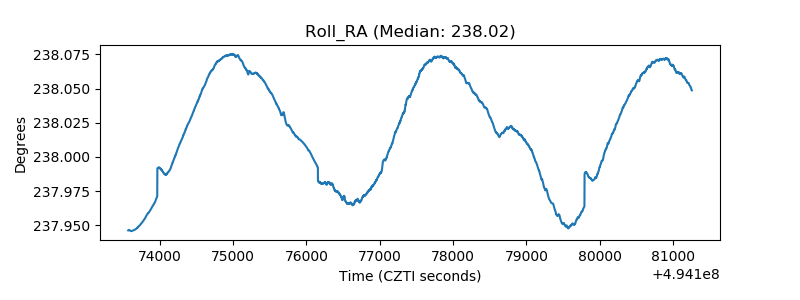 |
| Veto Counter | 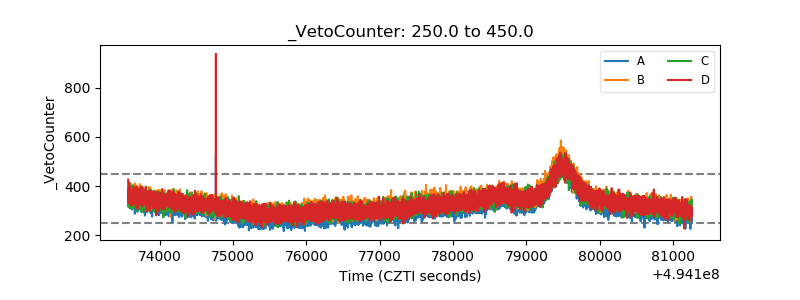 |