| Param | Original file | Final file |
|---|---|---|
| Filename | modeM0/AS1A14_022T05_9000006504_53665cztM0_level2.fits | modeM0/AS1A14_022T05_9000006504_53665cztM0_level2_quad_clean.evt |
| Size (bytes) | 1,172,963,520 | 82,693,440 |
| Size | 1.1 GB | 78.9 MB |
| Events in quadrant A | 14,511,805 | 366,471 |
| Events in quadrant B | 4,690,584 | 758,136 |
| Events in quadrant C | 16,491,102 | 233,598 |
| Events in quadrant D | 7,132,759 | 610,248 |
| Mode SS | |||
|---|---|---|---|
| Quadrant | BADHDUFLAG | Total packets | Discarded packets |
| A | 0 | 154 | 0 |
| B | 0 | 154 | 0 |
| C | 0 | 154 | 0 |
| D | 0 | 154 | 0 |
| Mode M0 | |||
|---|---|---|---|
| Quadrant | BADHDUFLAG | Total packets | Discarded packets |
| A | 0 | 48421 | 0 |
| B | 0 | 19409 | 0 |
| C | 0 | 54237 | 4 |
| D | 0 | 26442 | 0 |
| Quadrant | Total seconds | Saturated seconds | Saturation percentage |
|---|---|---|---|
| A | 7688 | 4312 | 56.087409% |
| B | 7688 | 312 | 4.058273% |
| C | 7688 | 5212 | 67.793965% |
| D | 7688 | 790 | 10.275754% |
Noise dominated data is calculated using 1-second bins in cleaned event files. If a bin has >2000 counts, and if more than 50% of those come from <1% of pixels, then it is considered to be noise-dominated and hence unusable.
| Quadrant | # 1 sec bins | Bins with >0 counts | Bins with >2000 counts | High rate bins dominated by noise | Noise dominated (total time) | Noise dominated (detector-on time) | Marked lightcurve |
|---|---|---|---|---|---|---|---|
| A | 7687 | 7687 | 3777 | 3777 | 49.13% | 49.13% | 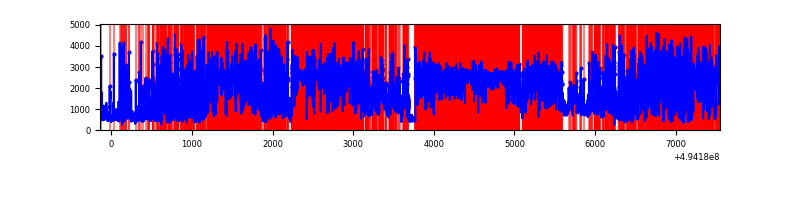 |
| B | 7688 | 7688 | 177 | 177 | 2.30% | 2.30% | 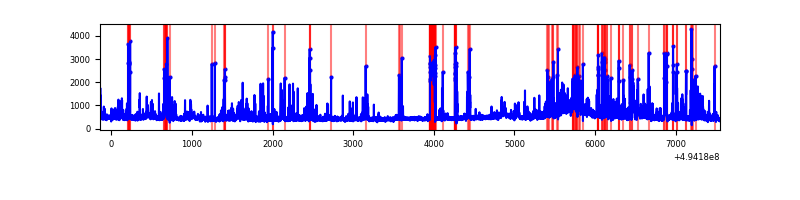 |
| C | 7688 | 7688 | 4988 | 4988 | 64.88% | 64.88% | 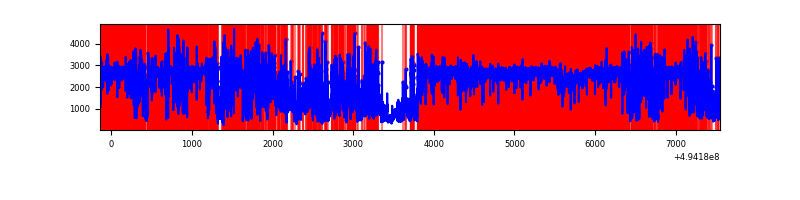 |
| D | 7688 | 7688 | 739 | 739 | 9.61% | 9.61% | 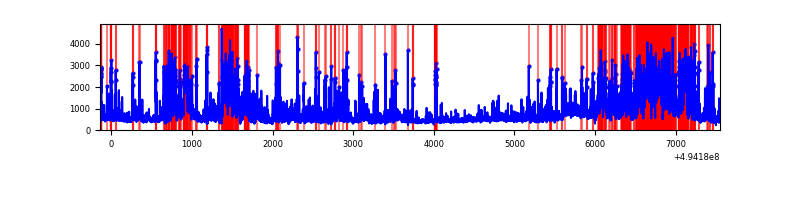 |
Top three noisy pixels from each quadrant. If the there are fewer than three noisy pixels in the level2.evt file, extra rows are filled as -1
| Pixel properties | Quadrant properties | ||||||
|---|---|---|---|---|---|---|---|
| Quadrant | DetID | PixID | Counts | Sigma | Mean | Median | Sigma |
| A | 3 | 78 | 4816359 | 30995.94 | 612 | 596 | 155.4 |
| A | 3 | 63 | 3832365 | 24662.61 | 612 | 596 | 155.4 |
| A | 14 | 254 | 2457311 | 15812.28 | 612 | 596 | 155.4 |
| B | 5 | 172 | 812982 | 4715.48 | 805 | 779 | 172.2 |
| B | 5 | 185 | 299480 | 1734.19 | 805 | 779 | 172.2 |
| B | 4 | 170 | 96223 | 554.13 | 805 | 779 | 172.2 |
| C | 1 | 241 | 9158052 | 69573.15 | 468 | 463 | 131.6 |
| C | 15 | 224 | 3367687 | 25581.88 | 468 | 463 | 131.6 |
| C | 7 | 80 | 1158189 | 8795.62 | 468 | 463 | 131.6 |
| D | 2 | 37 | 944829 | 4184.31 | 780 | 742 | 225.6 |
| D | 10 | 172 | 919807 | 4073.41 | 780 | 742 | 225.6 |
| D | 2 | 120 | 567844 | 2513.47 | 780 | 742 | 225.6 |
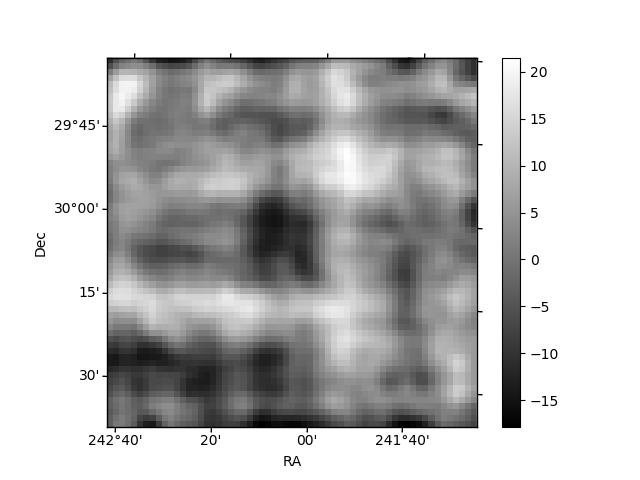
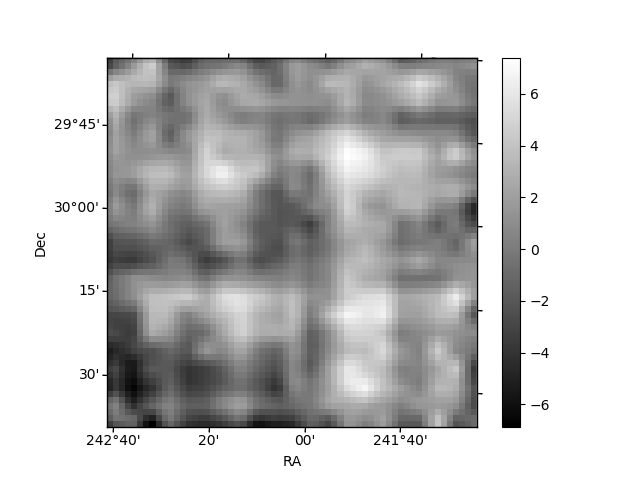
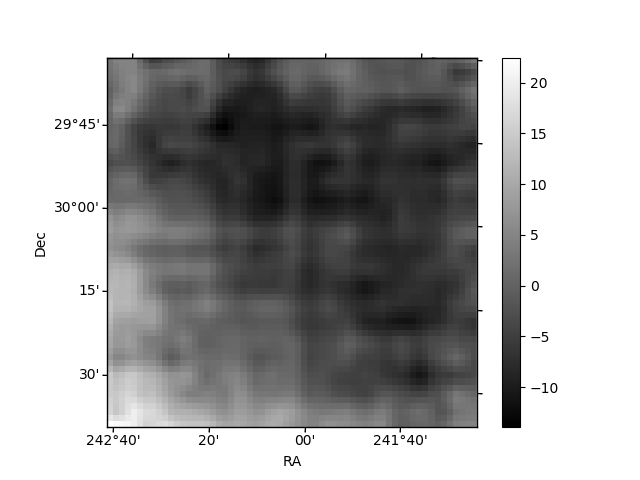
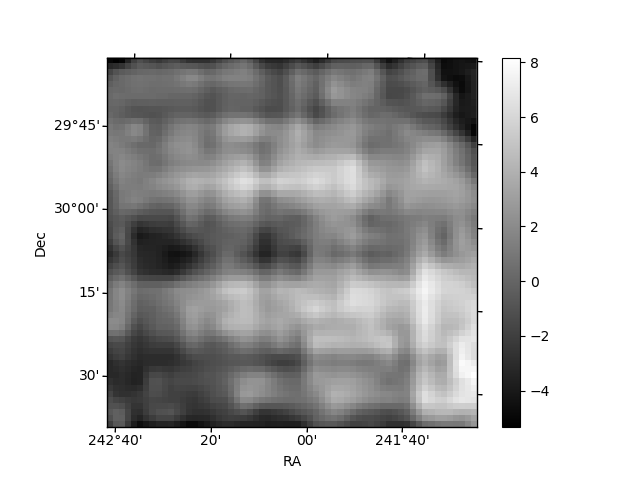
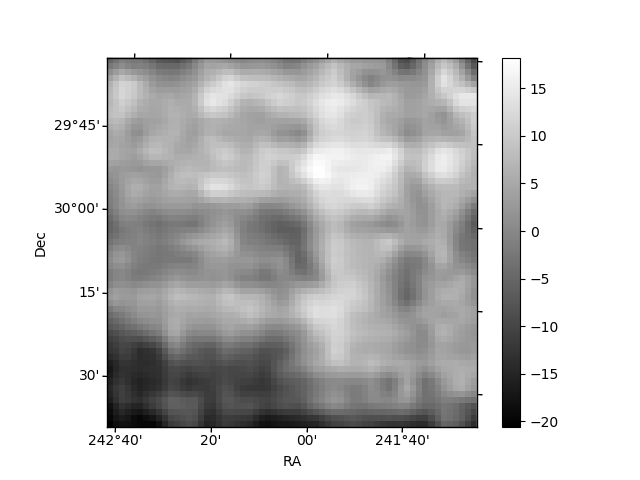
Histogram calculated using DETX and DETY for each event in the final _common_clean file
| Quadrant A | 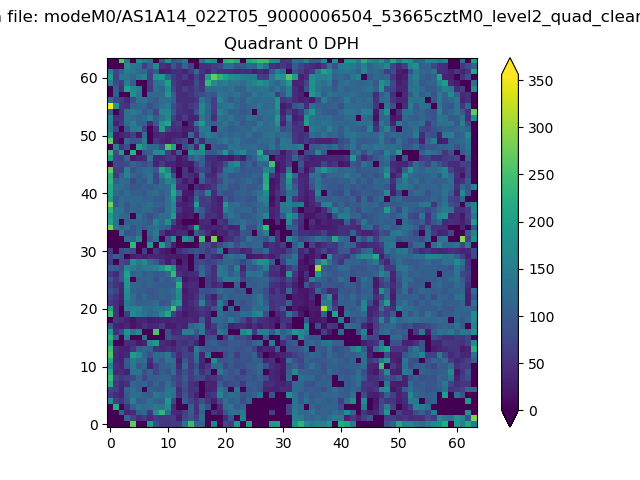 |
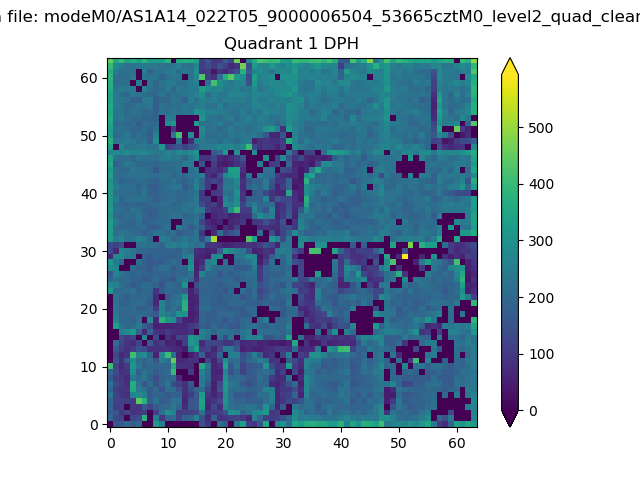 |
Quadrant B |
|---|---|---|---|
| Quadrant D | 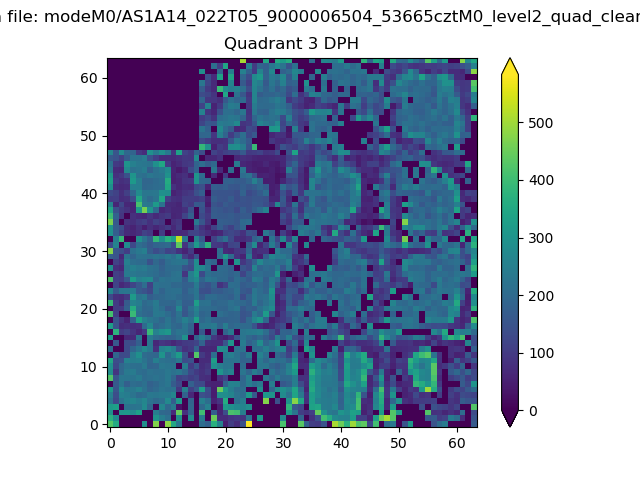 |
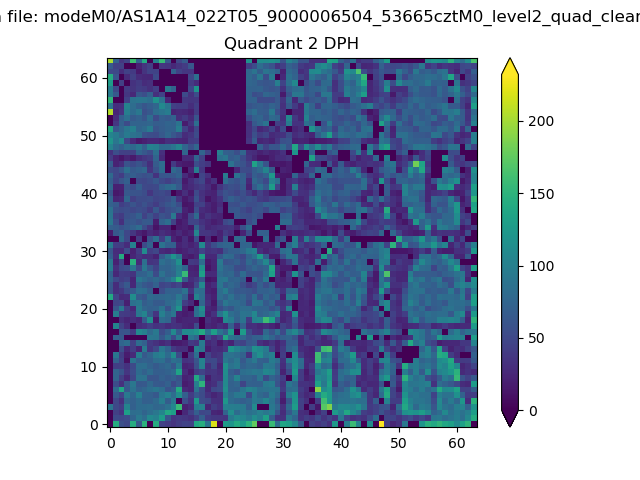 |
Quadrant C |
| Plot type | Count rate plots | Images |
|---|---|---|
| Comparison with Poisson distribution Blue bars denote a histogram of data divided into 1 sec bins. Red curve is a Poisson curve with rate = median count rate of data. |
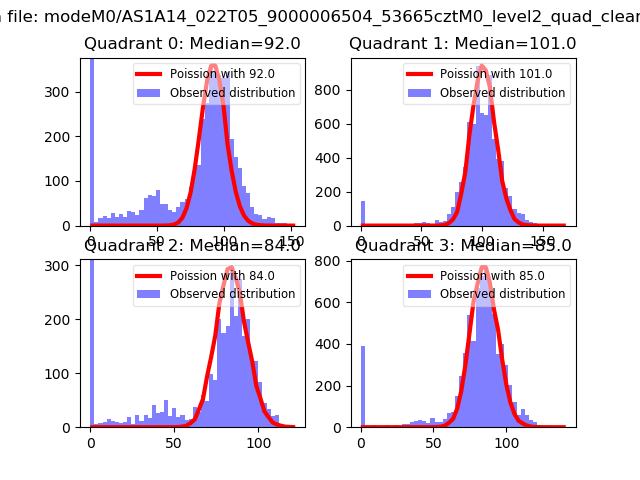 |
 |
| Quadrant-wise count rates Data is divided into 100 sec bins |
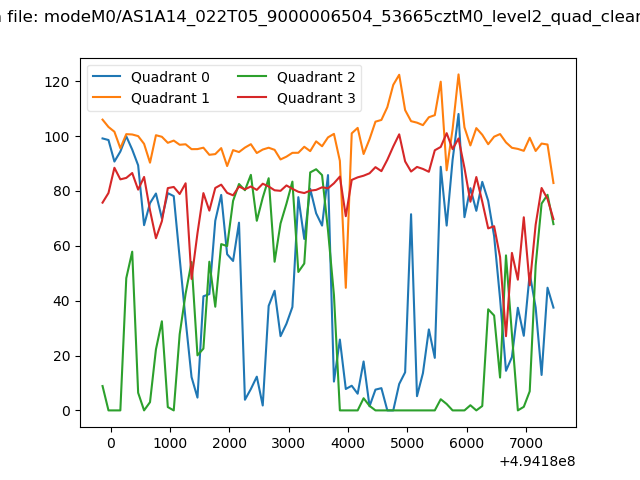 |
|
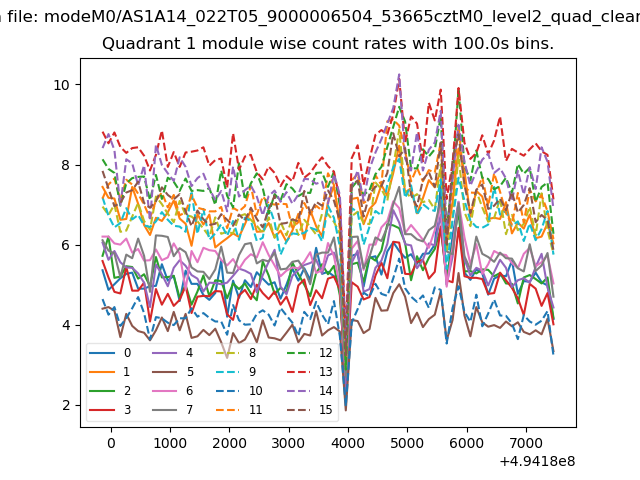
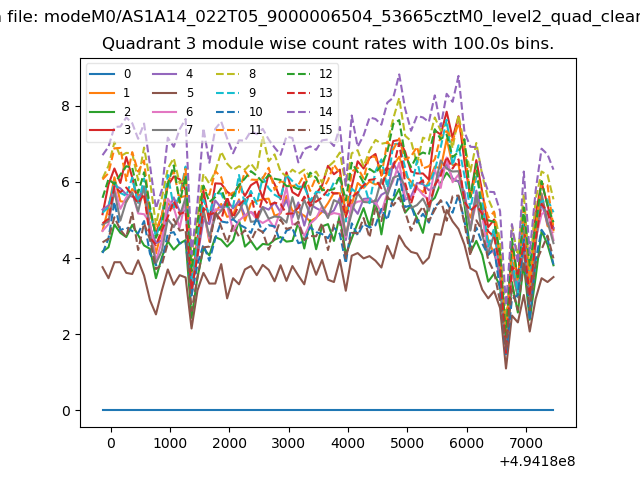
| Module-wise count rates for Quadrant A Data is divided into 100 sec bins |
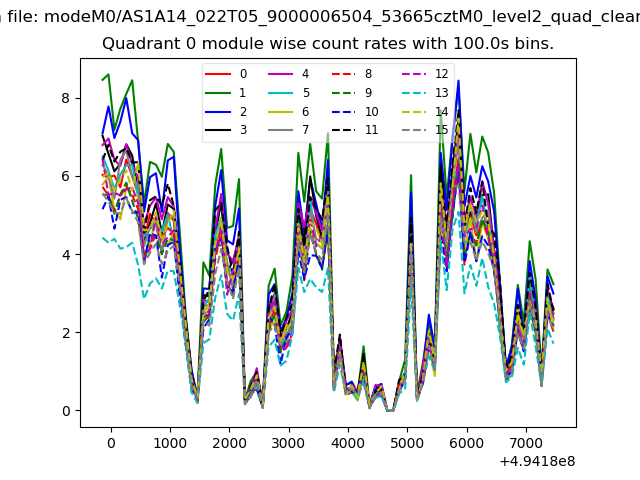 |
 |
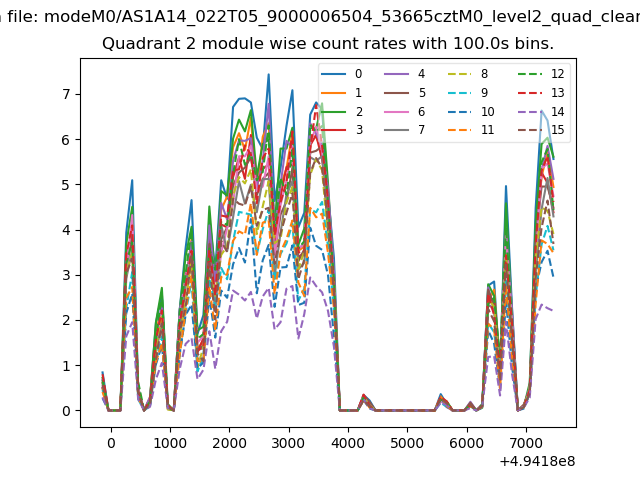
| Module-wise count rates for Quadrant B Data is divided into 100 sec bins |
 |
 |
| Module-wise count rates for Quadrant C Data is divided into 100 sec bins |
 |
 |
| Module-wise count rates for Quadrant D Data is divided into 100 sec bins |
 |
 |
| Parameter | Plot |
|---|---|
| CZT HV Monitor | 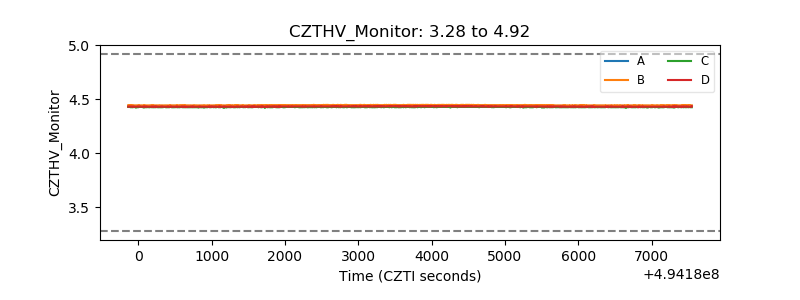 |
| D_VDD | 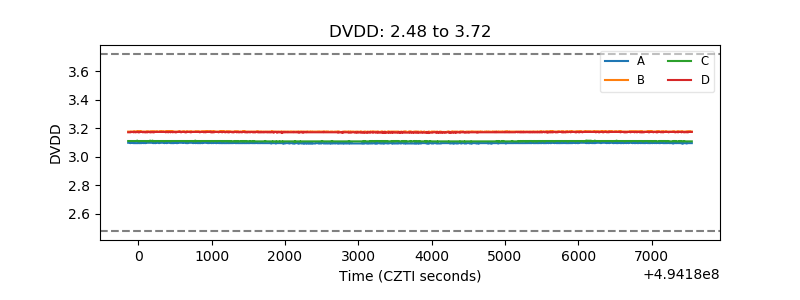 |
| Temperature 1 | 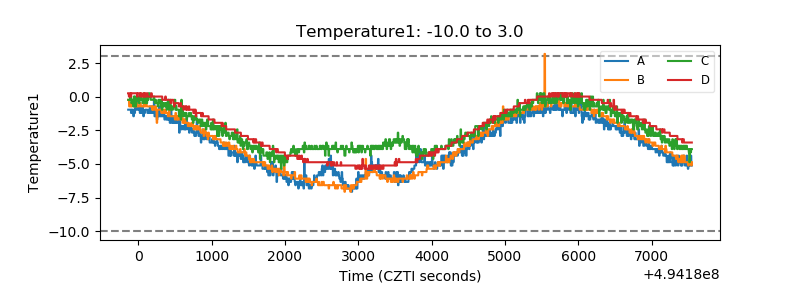 |
| Veto HV Monitor | 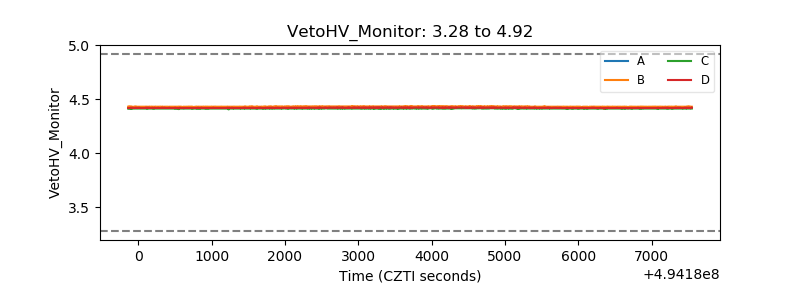 |
| Veto LLD | 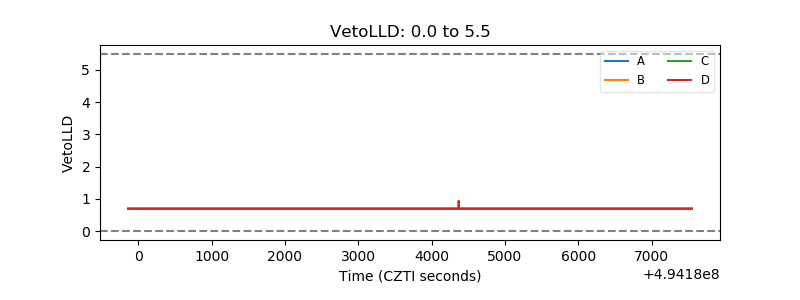 |
| Alpha Counter | 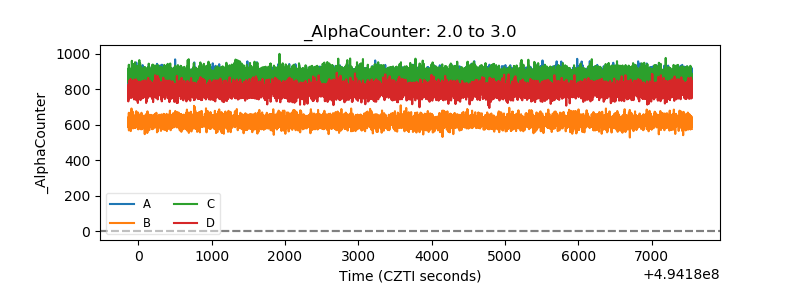 |
| _CPM_Rate | 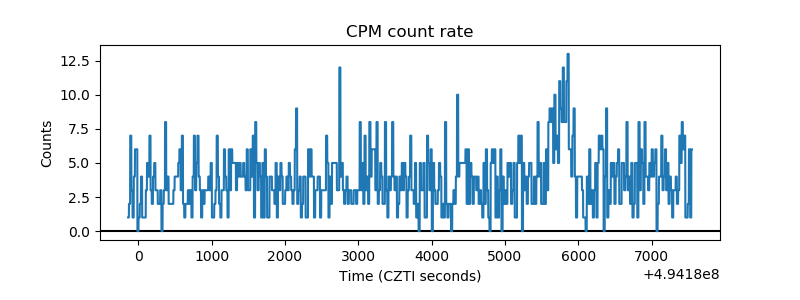 |
| CZT Counter | 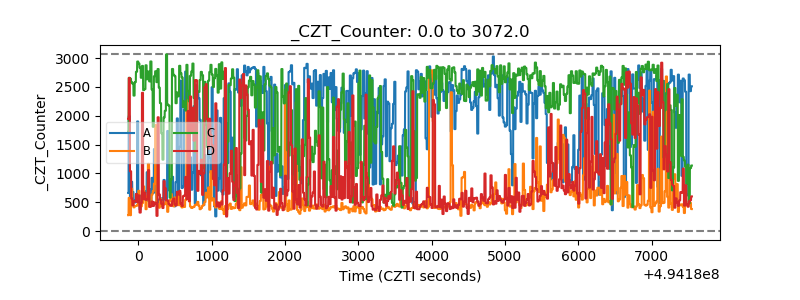 |
| +2.5 Volts monitor |  |
| +5 Volts monitor | 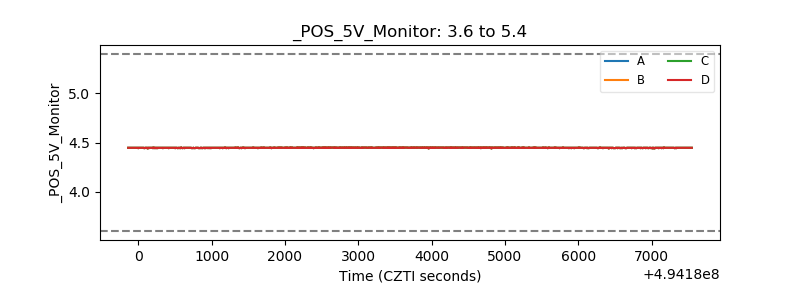 |
| _ROLL_ROT | 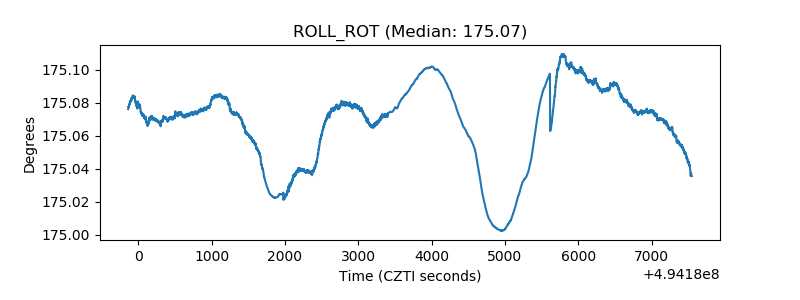 |
| _Roll_DEC | 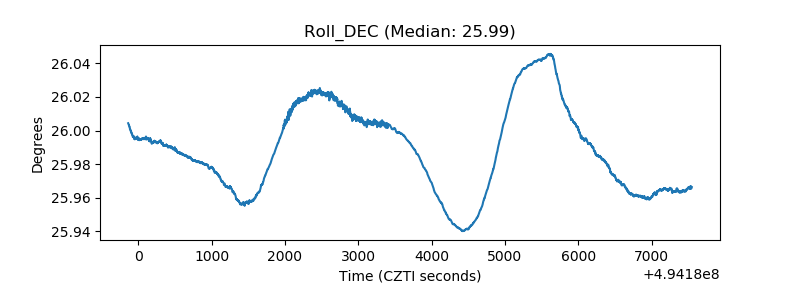 |
| _Roll_RA | 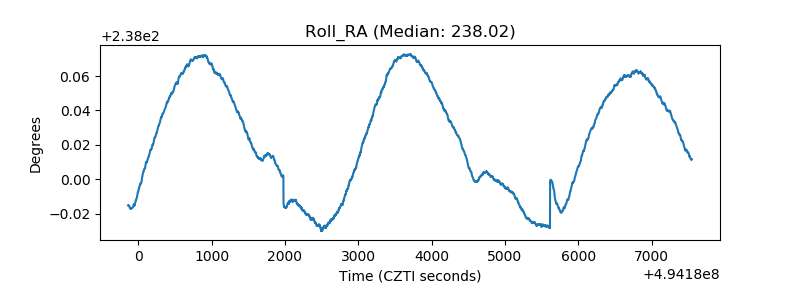 |
| Veto Counter | 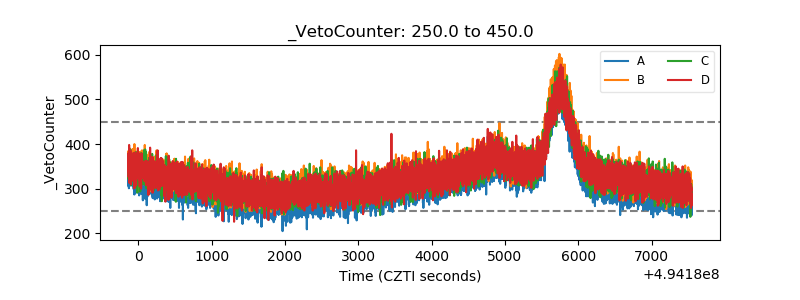 |