| Param | Original file | Final file |
|---|---|---|
| Filename | modeM0/AS1A14_022T05_9000006504_53668cztM0_level2.fits | modeM0/AS1A14_022T05_9000006504_53668cztM0_level2_quad_clean.evt |
| Size (bytes) | 3,119,561,280 | 175,112,640 |
| Size | 2.9 GB | 167.0 MB |
| Events in quadrant A | 41,102,348 | 495,984 |
| Events in quadrant B | 12,889,196 | 1,737,265 |
| Events in quadrant C | 36,340,725 | 665,332 |
| Events in quadrant D | 23,728,858 | 1,130,142 |
| Mode SS | |||
|---|---|---|---|
| Quadrant | BADHDUFLAG | Total packets | Discarded packets |
| A | 0 | 376 | 0 |
| B | 0 | 376 | 0 |
| C | 0 | 376 | 0 |
| D | 0 | 376 | 0 |
| Mode M9 | |||
|---|---|---|---|
| Quadrant | BADHDUFLAG | Total packets | Discarded packets |
| A | 0 | 16 | 0 |
| B | 0 | 16 | 0 |
| C | 0 | 16 | 0 |
| D | 0 | 16 | 0 |
| Mode M0 | |||
|---|---|---|---|
| Quadrant | BADHDUFLAG | Total packets | Discarded packets |
| A | 0 | 134883 | 3 |
| B | 0 | 51227 | 3 |
| C | 0 | 120499 | 3 |
| D | 0 | 83263 | 3 |
| Quadrant | Total seconds | Saturated seconds | Saturation percentage |
|---|---|---|---|
| A | 18443 | 13772 | 74.673318% |
| B | 18444 | 1178 | 6.386901% |
| C | 18444 | 11551 | 62.627413% |
| D | 18443 | 4844 | 26.264707% |
Noise dominated data is calculated using 1-second bins in cleaned event files. If a bin has >2000 counts, and if more than 50% of those come from <1% of pixels, then it is considered to be noise-dominated and hence unusable.
| Quadrant | # 1 sec bins | Bins with >0 counts | Bins with >2000 counts | High rate bins dominated by noise | Noise dominated (total time) | Noise dominated (detector-on time) | Marked lightcurve |
|---|---|---|---|---|---|---|---|
| A | 20097 | 18444 | 13026 | 13026 | 64.82% | 70.62% | 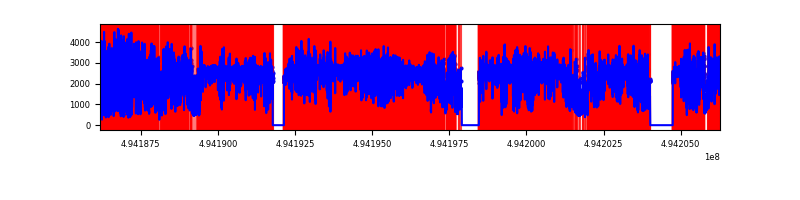 |
| B | 20099 | 18446 | 806 | 806 | 4.01% | 4.37% | 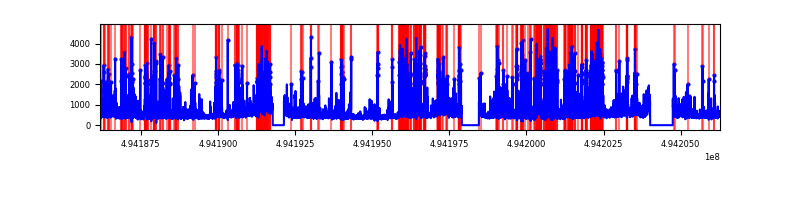 |
| C | 20099 | 18445 | 10469 | 10469 | 52.09% | 56.76% | 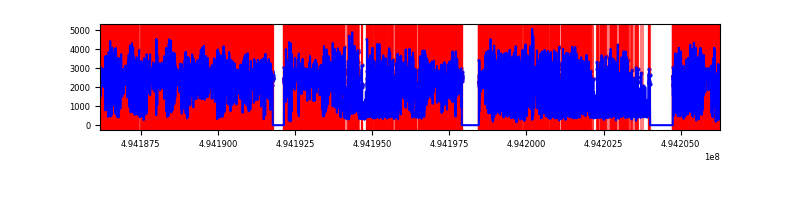 |
| D | 20098 | 18446 | 4356 | 4356 | 21.67% | 23.61% | 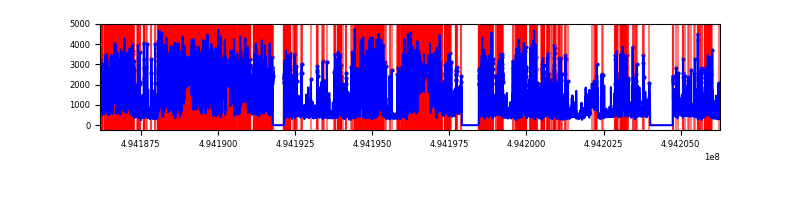 |
Top three noisy pixels from each quadrant. If the there are fewer than three noisy pixels in the level2.evt file, extra rows are filled as -1
| Pixel properties | Quadrant properties | ||||||
|---|---|---|---|---|---|---|---|
| Quadrant | DetID | PixID | Counts | Sigma | Mean | Median | Sigma |
| A | 3 | 63 | 20974147 | 73040.8 | 1142 | 1115 | 287.1 |
| A | 3 | 78 | 12047818 | 41953.92 | 1142 | 1115 | 287.1 |
| A | 14 | 254 | 1271159 | 4423.06 | 1142 | 1115 | 287.1 |
| B | 10 | 20 | 2117106 | 5309.01 | 1888 | 1821 | 398.4 |
| B | 5 | 172 | 1118520 | 2802.73 | 1888 | 1821 | 398.4 |
| B | 5 | 185 | 748697 | 1874.53 | 1888 | 1821 | 398.4 |
| C | 1 | 241 | 16962433 | 49756.31 | 1220 | 1206 | 340.9 |
| C | 15 | 224 | 11037573 | 32375.54 | 1220 | 1206 | 340.9 |
| C | 2 | 12 | 1024451 | 3001.72 | 1220 | 1206 | 340.9 |
| D | 8 | 176 | 8107388 | 16793.92 | 1644 | 1563 | 482.7 |
| D | 10 | 172 | 3722298 | 7708.74 | 1644 | 1563 | 482.7 |
| D | 2 | 37 | 1407809 | 2913.51 | 1644 | 1563 | 482.7 |
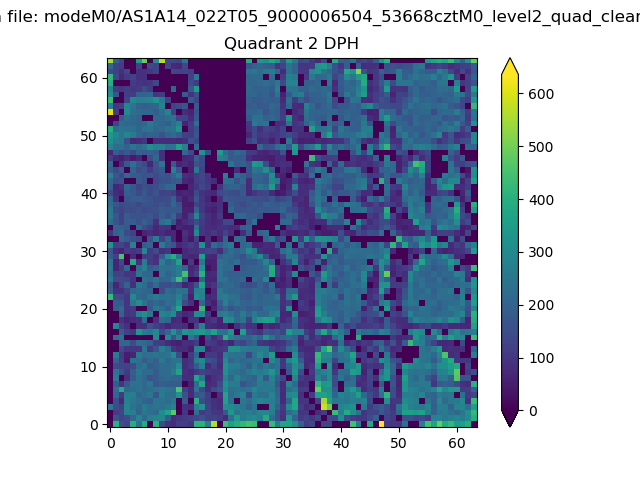
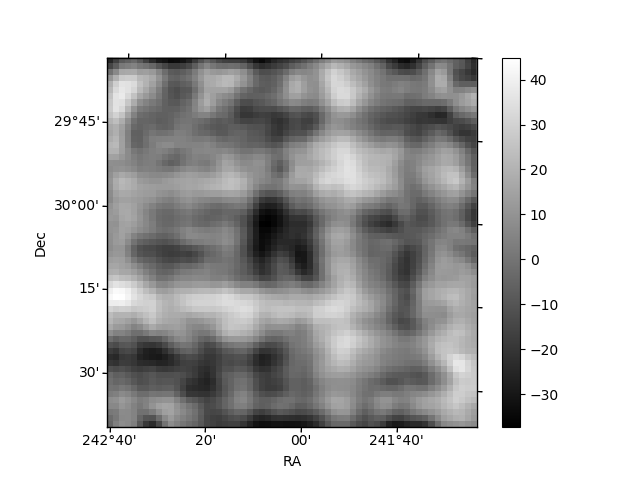
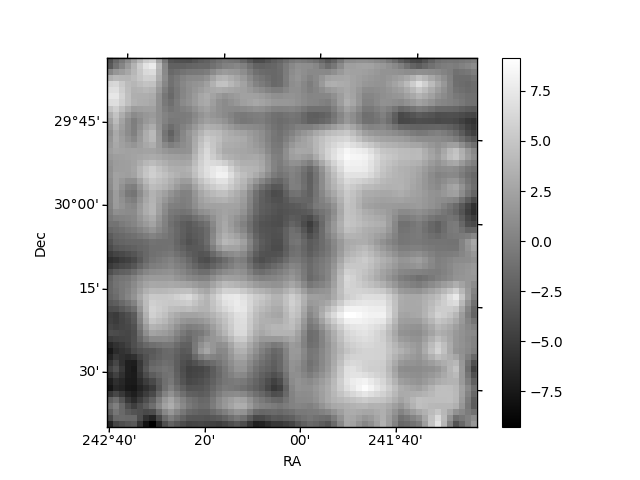
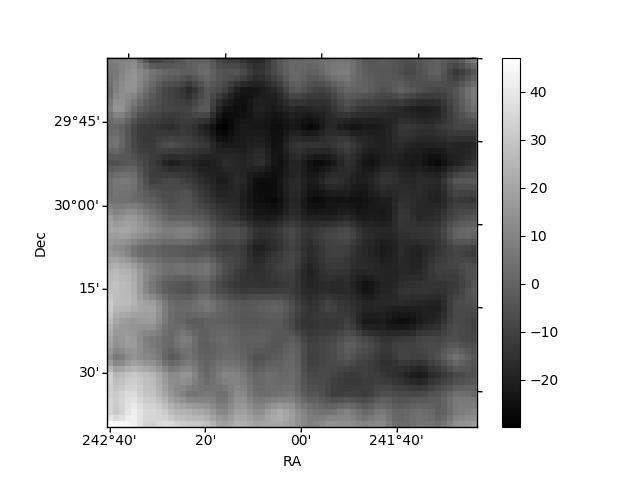
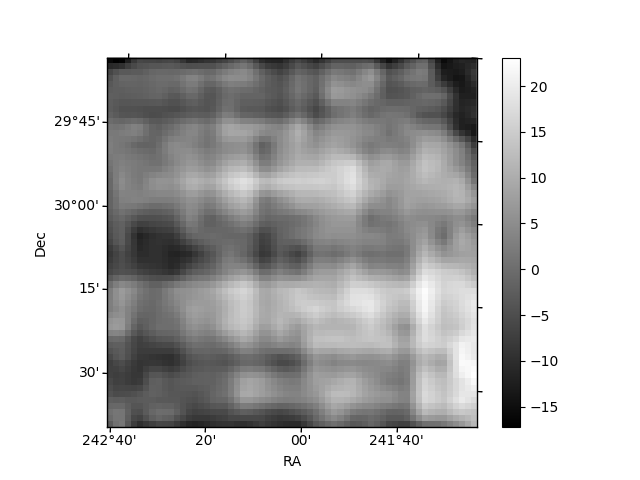
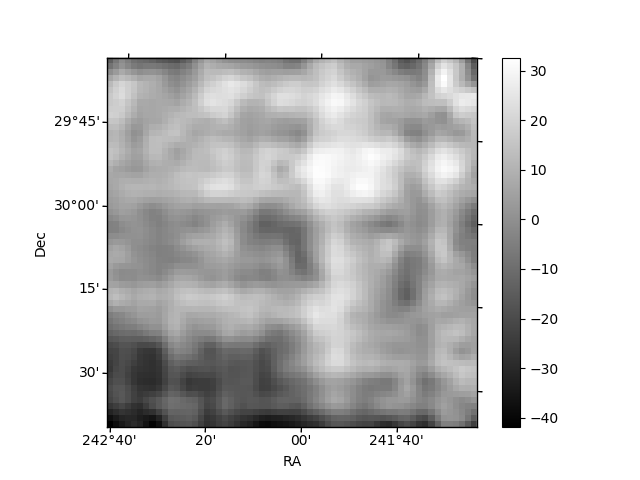
Histogram calculated using DETX and DETY for each event in the final _common_clean file
| Quadrant A | 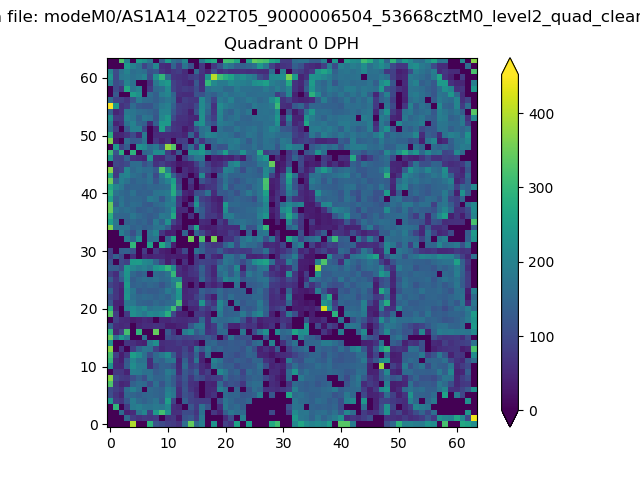 |
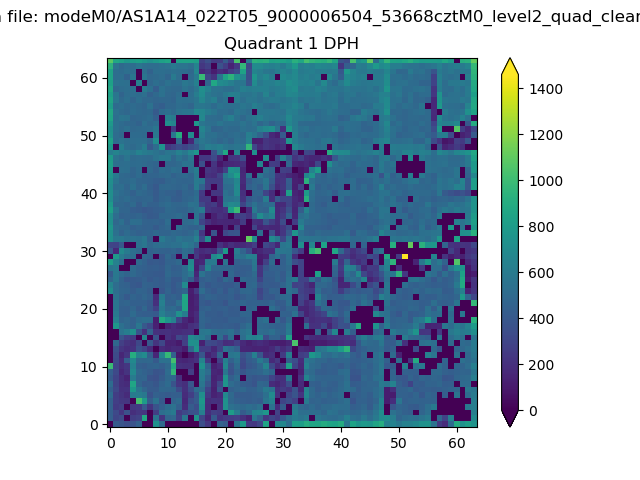 |
Quadrant B |
|---|---|---|---|
| Quadrant D | 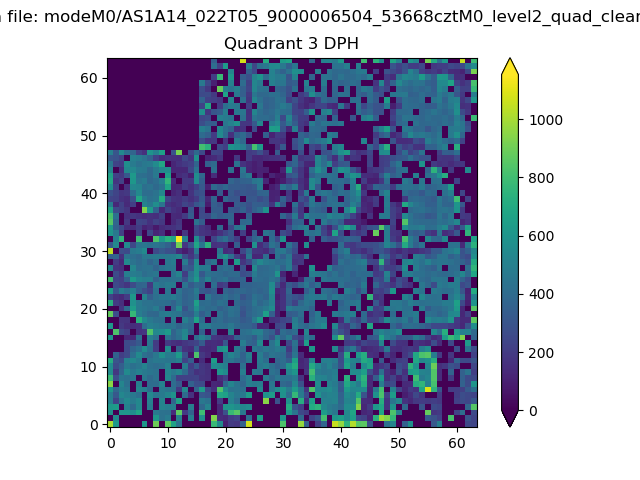 |
 |
Quadrant C |
| Plot type | Count rate plots | Images |
|---|---|---|
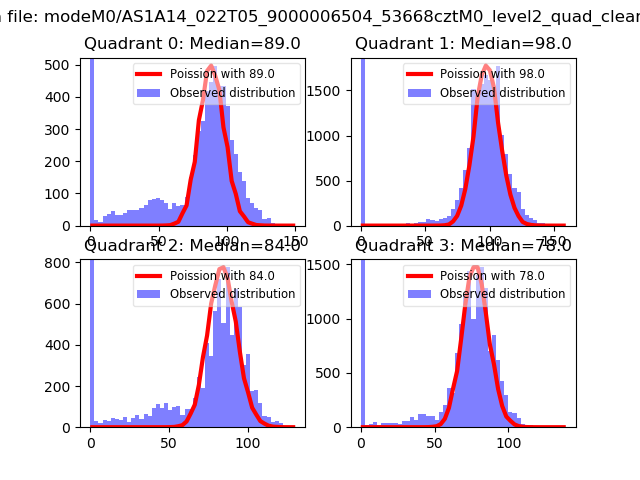
| Comparison with Poisson distribution Blue bars denote a histogram of data divided into 1 sec bins. Red curve is a Poisson curve with rate = median count rate of data. |
 |
 |
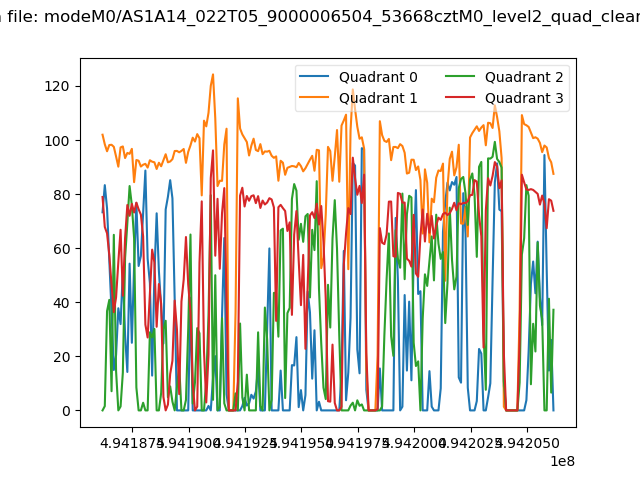
| Quadrant-wise count rates Data is divided into 100 sec bins |
 |
|
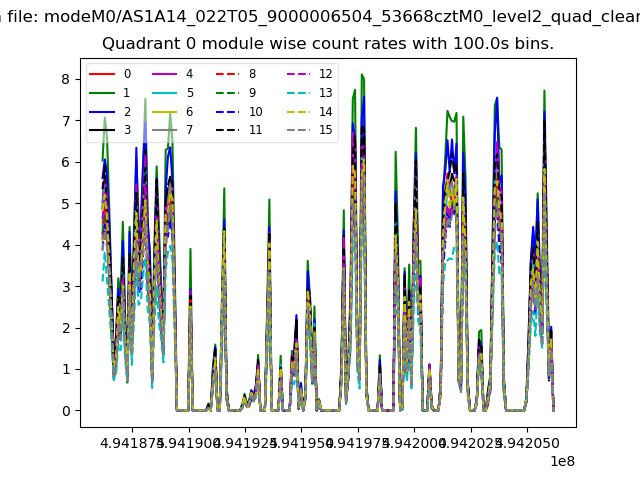
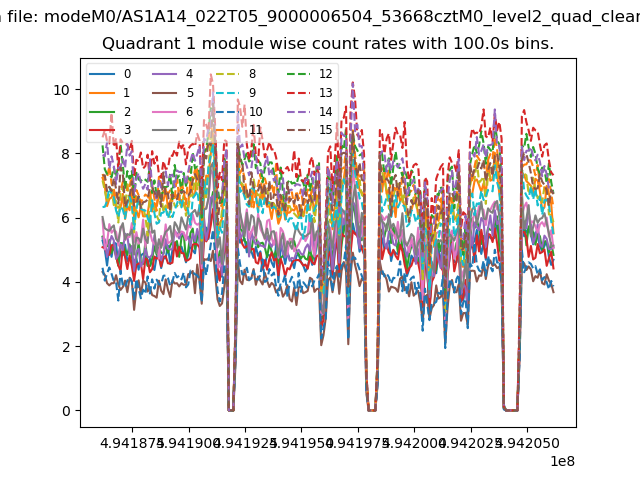
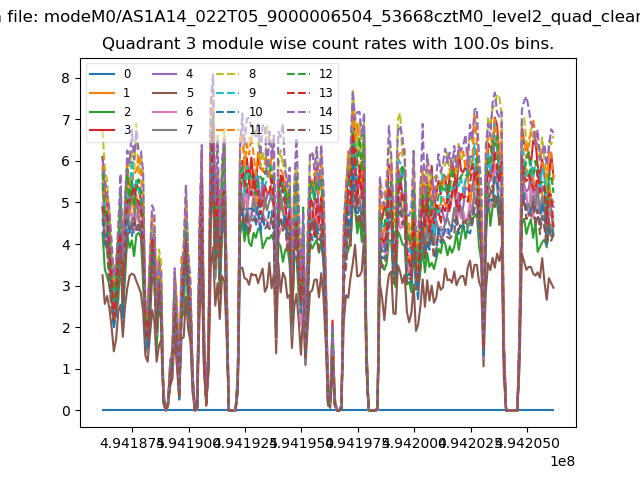
| Module-wise count rates for Quadrant A Data is divided into 100 sec bins |
 |
 |
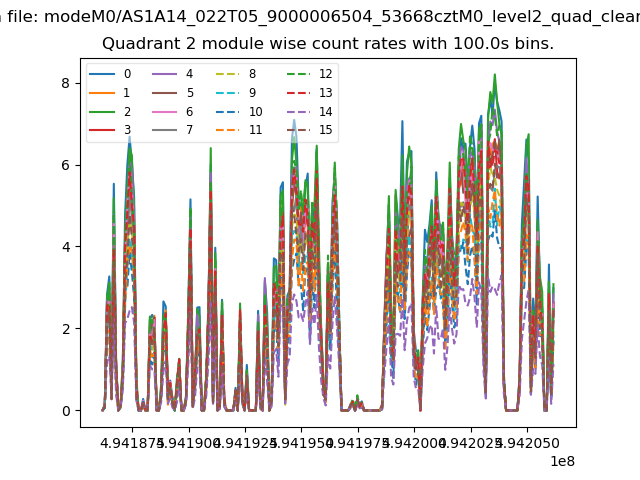
| Module-wise count rates for Quadrant B Data is divided into 100 sec bins |
 |
 |
| Module-wise count rates for Quadrant C Data is divided into 100 sec bins |
 |
 |
| Module-wise count rates for Quadrant D Data is divided into 100 sec bins |
 |
 |
| Parameter | Plot |
|---|---|
| CZT HV Monitor | 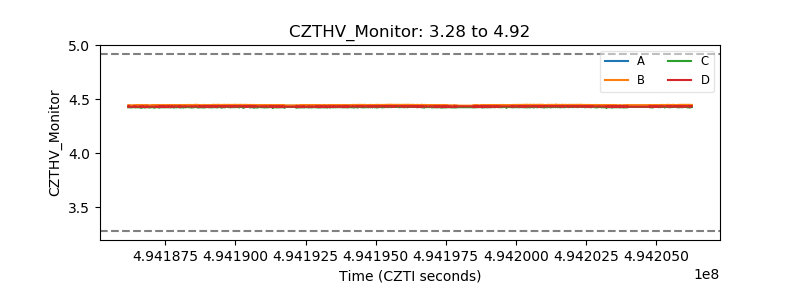 |
| D_VDD | 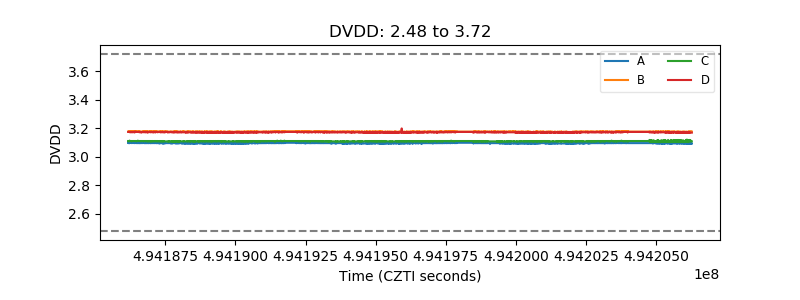 |
| Temperature 1 | 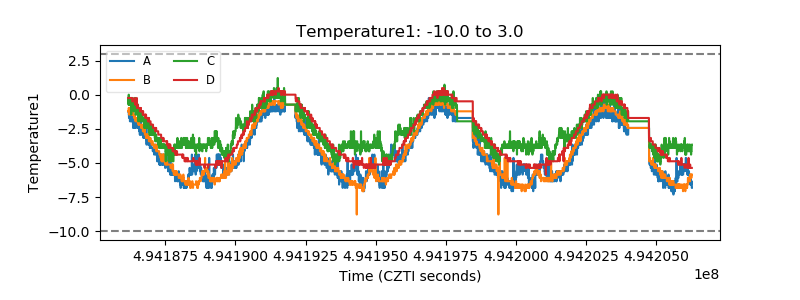 |
| Veto HV Monitor | 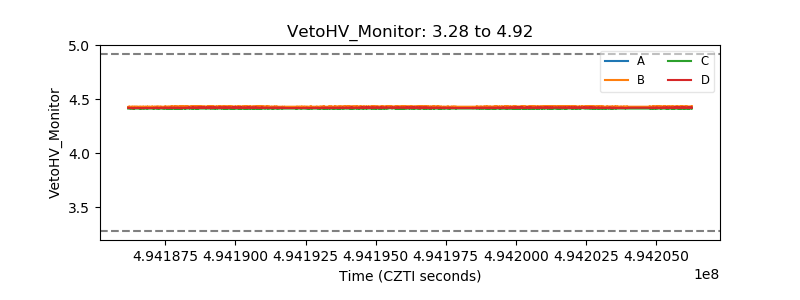 |
| Veto LLD | 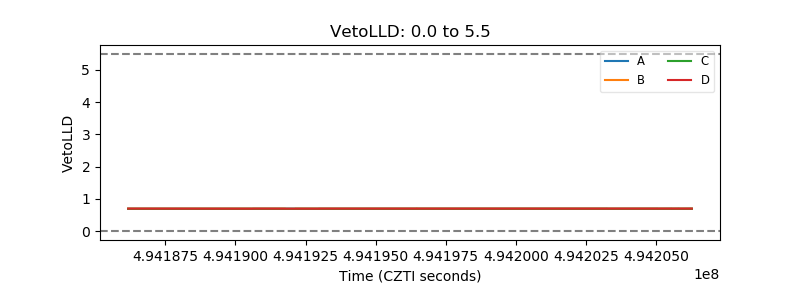 |
| Alpha Counter | 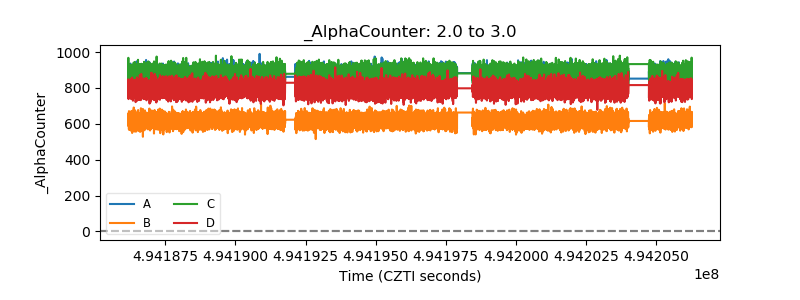 |
| _CPM_Rate | 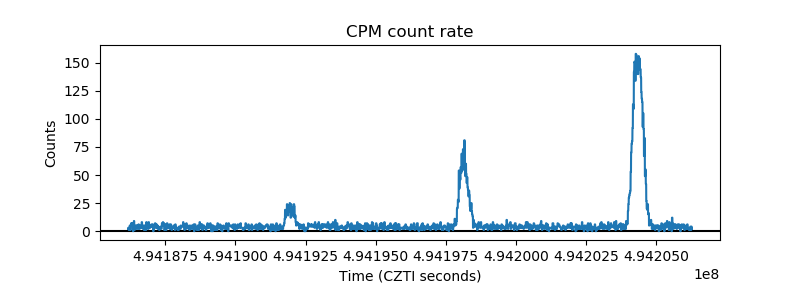 |
| CZT Counter | 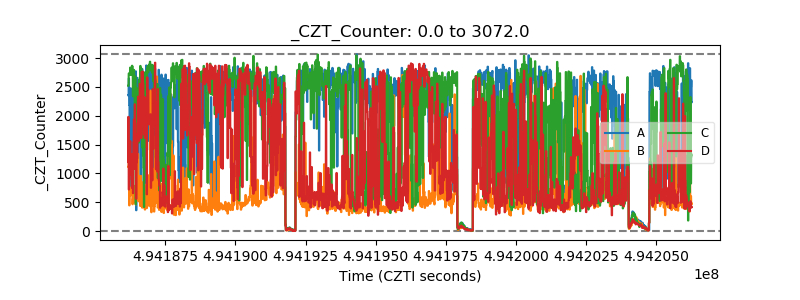 |
| +2.5 Volts monitor |  |
| +5 Volts monitor |  |
| _ROLL_ROT | 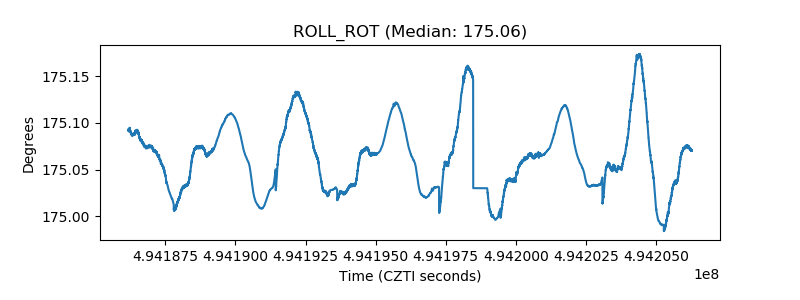 |
| _Roll_DEC | 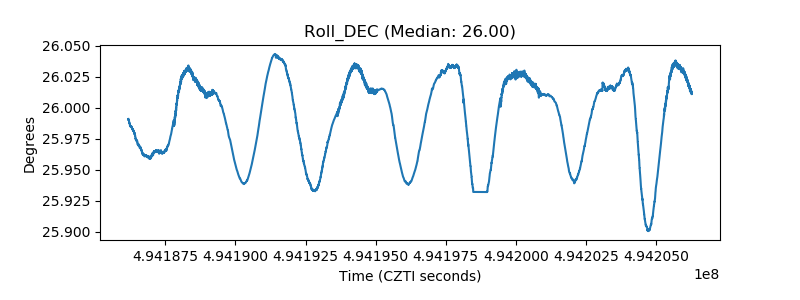 |
| _Roll_RA | 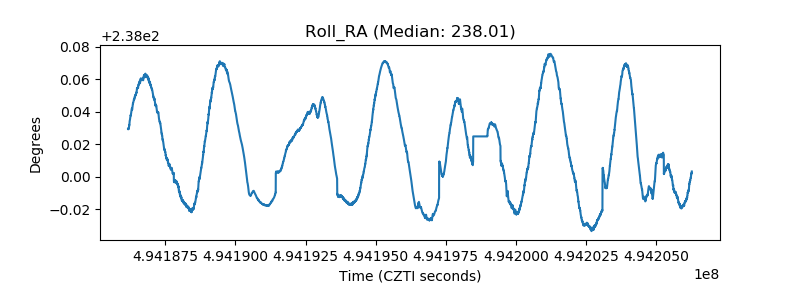 |
| Veto Counter | 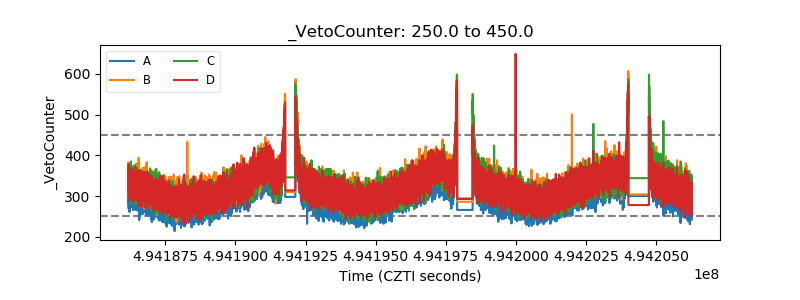 |