| Param | Original file | Final file |
|---|---|---|
| Filename | modeM0/AS1A14_022T05_9000006504_53669cztM0_level2.fits | modeM0/AS1A14_022T05_9000006504_53669cztM0_level2_quad_clean.evt |
| Size (bytes) | 1,052,297,280 | 66,528,000 |
| Size | 1003.5 MB | 63.4 MB |
| Events in quadrant A | 14,746,391 | 181,919 |
| Events in quadrant B | 3,914,885 | 646,935 |
| Events in quadrant C | 12,134,575 | 290,056 |
| Events in quadrant D | 7,650,140 | 436,614 |
| Mode SS | |||
|---|---|---|---|
| Quadrant | BADHDUFLAG | Total packets | Discarded packets |
| A | 0 | 136 | 0 |
| B | 0 | 136 | 0 |
| C | 0 | 136 | 0 |
| D | 0 | 136 | 0 |
| Mode M9 | |||
|---|---|---|---|
| Quadrant | BADHDUFLAG | Total packets | Discarded packets |
| A | 0 | 8 | 0 |
| B | 0 | 8 | 0 |
| C | 0 | 8 | 0 |
| D | 0 | 8 | 0 |
| Mode M0 | |||
|---|---|---|---|
| Quadrant | BADHDUFLAG | Total packets | Discarded packets |
| A | 0 | 48335 | 1 |
| B | 0 | 16152 | 1 |
| C | 0 | 40581 | 1 |
| D | 0 | 27269 | 1 |
| Quadrant | Total seconds | Saturated seconds | Saturation percentage |
|---|---|---|---|
| A | 6565 | 4926 | 75.034273% |
| B | 6564 | 157 | 2.391834% |
| C | 6564 | 3680 | 56.063376% |
| D | 6564 | 1545 | 23.537477% |
Noise dominated data is calculated using 1-second bins in cleaned event files. If a bin has >2000 counts, and if more than 50% of those come from <1% of pixels, then it is considered to be noise-dominated and hence unusable.
| Quadrant | # 1 sec bins | Bins with >0 counts | Bins with >2000 counts | High rate bins dominated by noise | Noise dominated (total time) | Noise dominated (detector-on time) | Marked lightcurve |
|---|---|---|---|---|---|---|---|
| A | 7445 | 6565 | 4718 | 4718 | 63.37% | 71.87% | 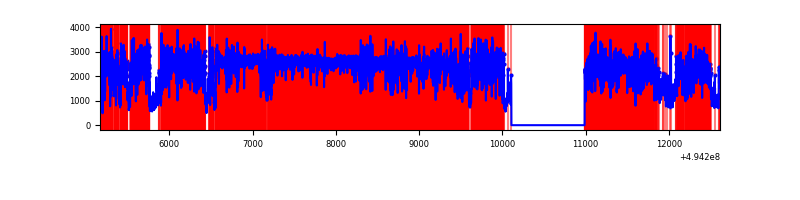 |
| B | 7444 | 6565 | 75 | 75 | 1.01% | 1.14% | 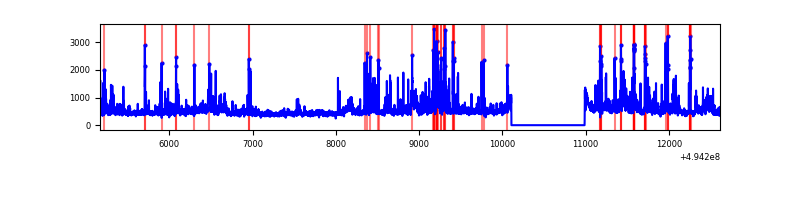 |
| C | 7444 | 6564 | 3189 | 3189 | 42.84% | 48.58% | 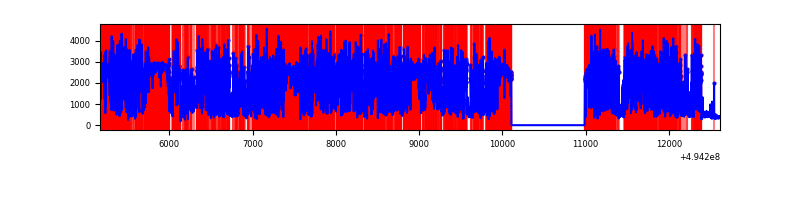 |
| D | 7443 | 6564 | 1321 | 1321 | 17.75% | 20.12% | 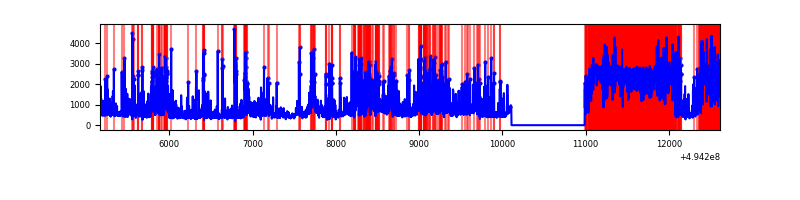 |
Top three noisy pixels from each quadrant. If the there are fewer than three noisy pixels in the level2.evt file, extra rows are filled as -1
| Pixel properties | Quadrant properties | ||||||
|---|---|---|---|---|---|---|---|
| Quadrant | DetID | PixID | Counts | Sigma | Mean | Median | Sigma |
| A | 3 | 63 | 9650060 | 88488.78 | 436 | 427 | 109.0 |
| A | 3 | 78 | 2786517 | 25548.92 | 436 | 427 | 109.0 |
| A | 15 | 174 | 271480 | 2485.6 | 436 | 427 | 109.0 |
| B | 10 | 254 | 382258 | 2582.25 | 689 | 666 | 147.8 |
| B | 5 | 185 | 240462 | 1622.71 | 689 | 666 | 147.8 |
| B | 5 | 172 | 219381 | 1480.05 | 689 | 666 | 147.8 |
| C | 15 | 224 | 5925334 | 45758.98 | 462 | 460 | 129.5 |
| C | 1 | 241 | 2734616 | 21116.43 | 462 | 460 | 129.5 |
| C | 13 | 3 | 672330 | 5188.99 | 462 | 460 | 129.5 |
| D | 8 | 176 | 3456776 | 21206.85 | 562 | 535 | 163.0 |
| D | 2 | 37 | 503365 | 3085.27 | 562 | 535 | 163.0 |
| D | 13 | 153 | 265102 | 1623.33 | 562 | 535 | 163.0 |
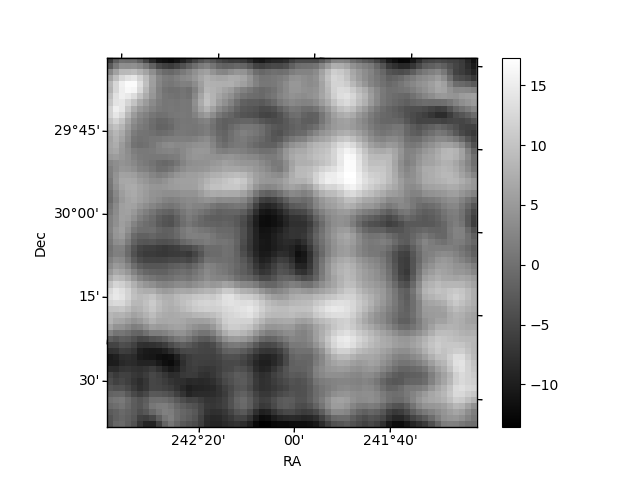
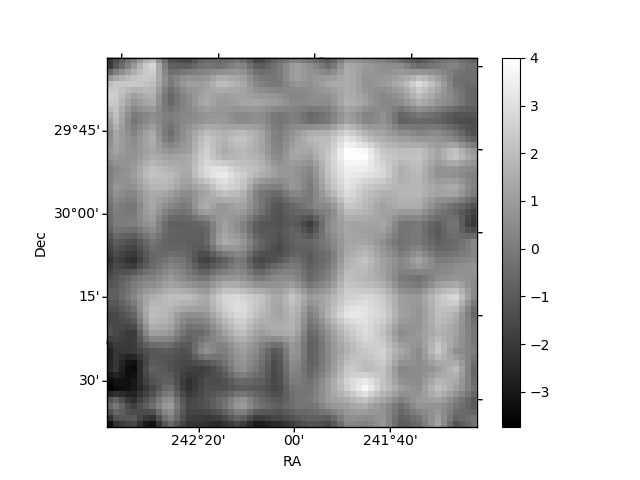
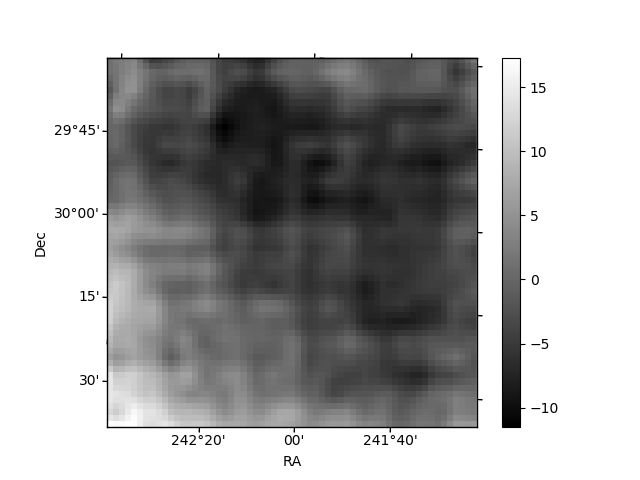
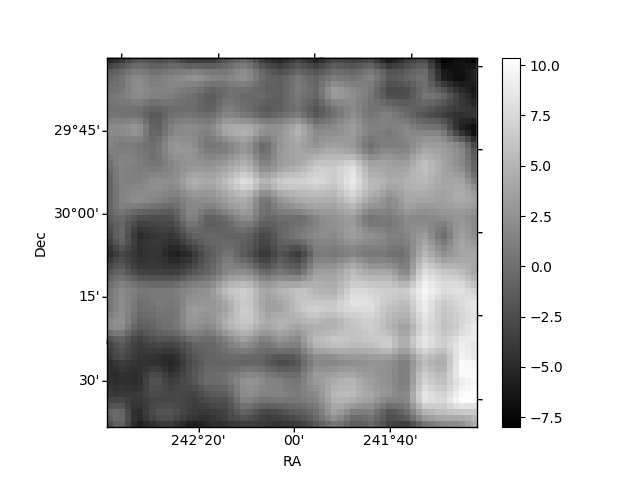
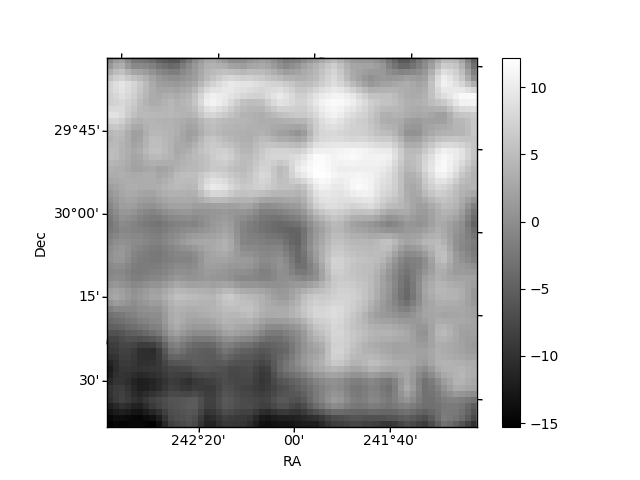
Histogram calculated using DETX and DETY for each event in the final _common_clean file
| Quadrant A | 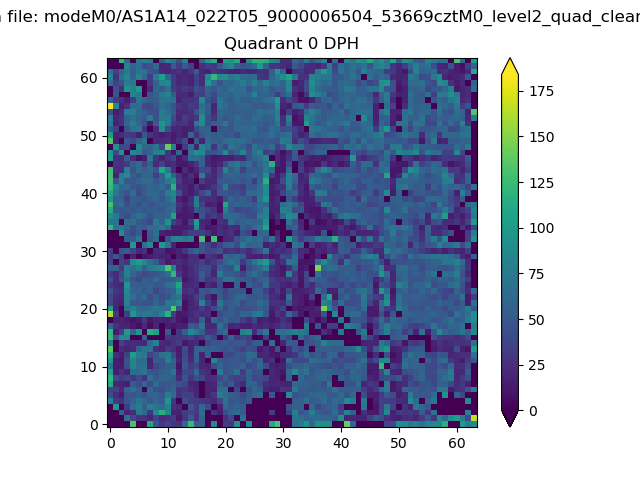 |
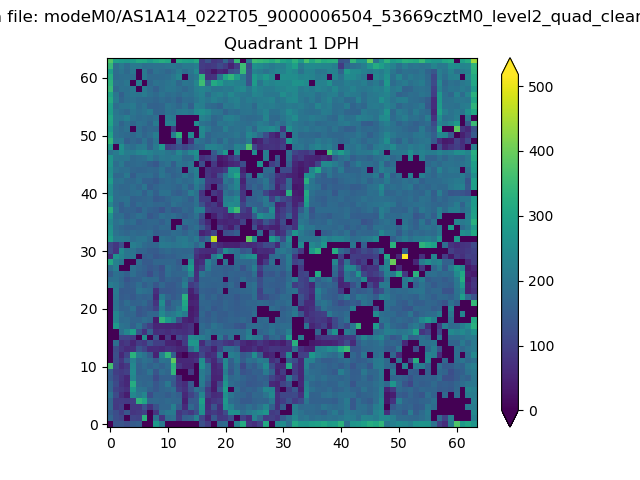 |
Quadrant B |
|---|---|---|---|
| Quadrant D | 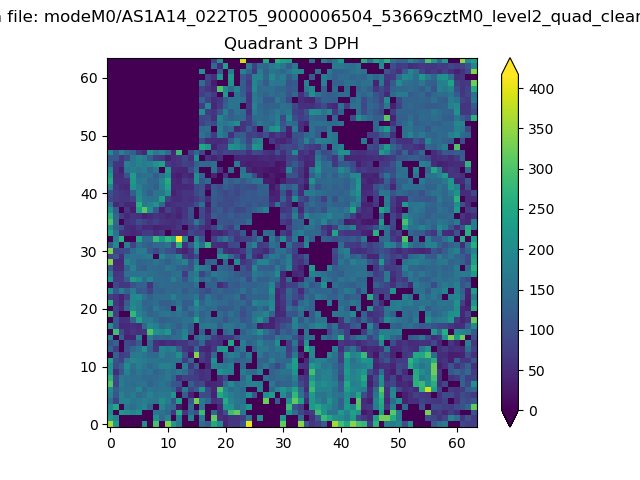 |
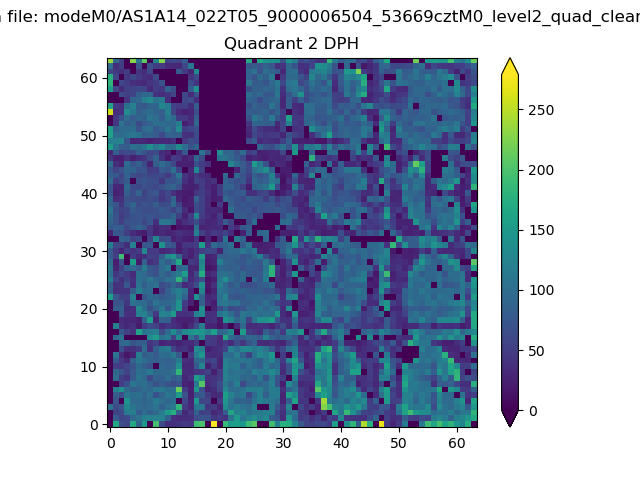 |
Quadrant C |
| Plot type | Count rate plots | Images |
|---|---|---|
| Comparison with Poisson distribution Blue bars denote a histogram of data divided into 1 sec bins. Red curve is a Poisson curve with rate = median count rate of data. |
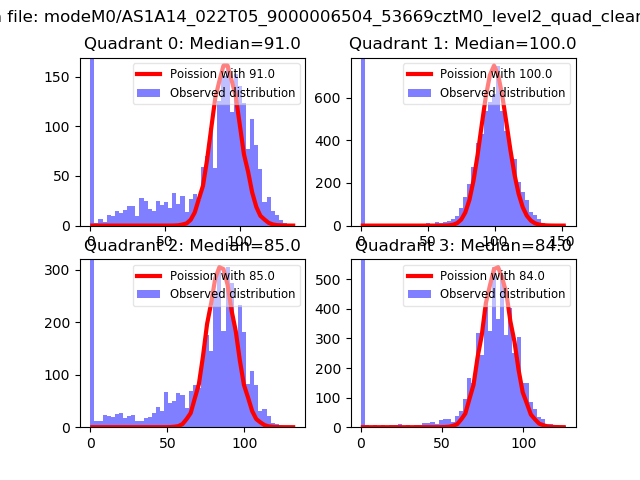 |
 |
| Quadrant-wise count rates Data is divided into 100 sec bins |
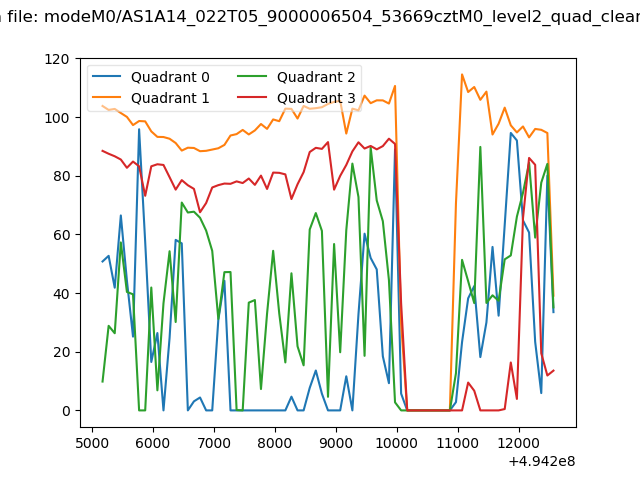 |
|
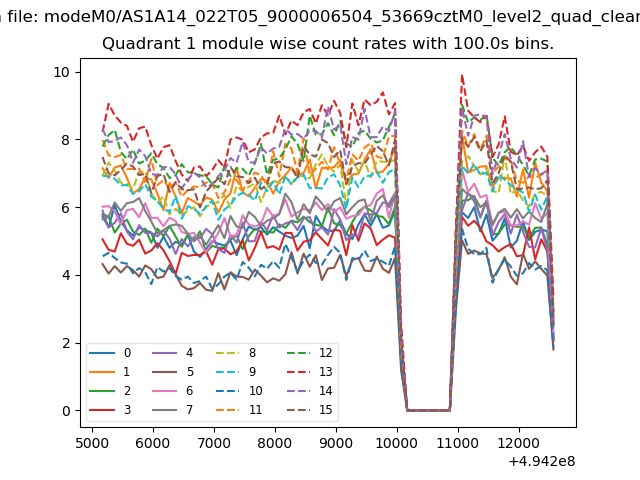
| Module-wise count rates for Quadrant A Data is divided into 100 sec bins |
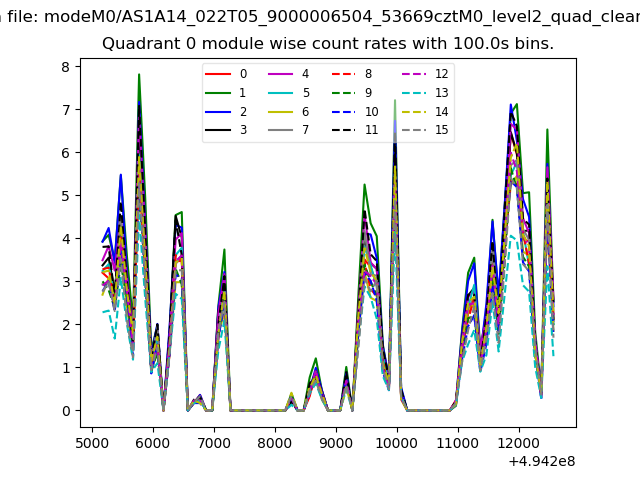 |
 |
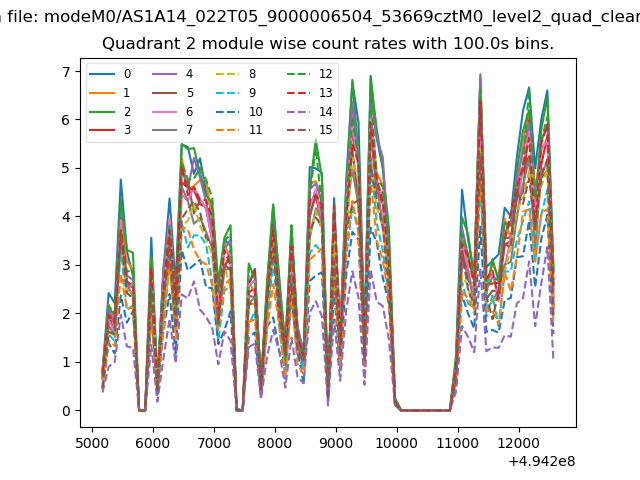
| Module-wise count rates for Quadrant B Data is divided into 100 sec bins |
 |
 |
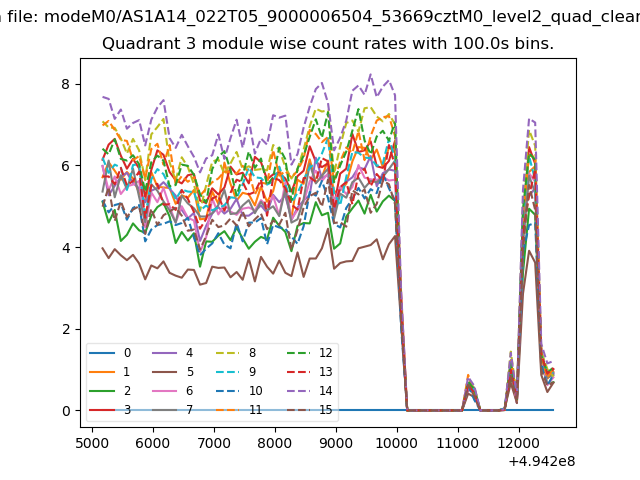
| Module-wise count rates for Quadrant C Data is divided into 100 sec bins |
 |
 |
| Module-wise count rates for Quadrant D Data is divided into 100 sec bins |
 |
 |
| Parameter | Plot |
|---|---|
| CZT HV Monitor | 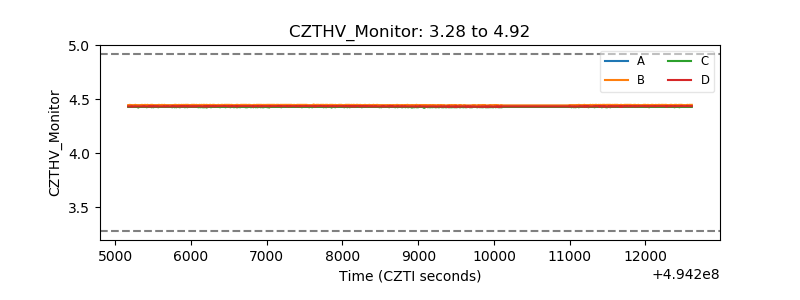 |
| D_VDD | 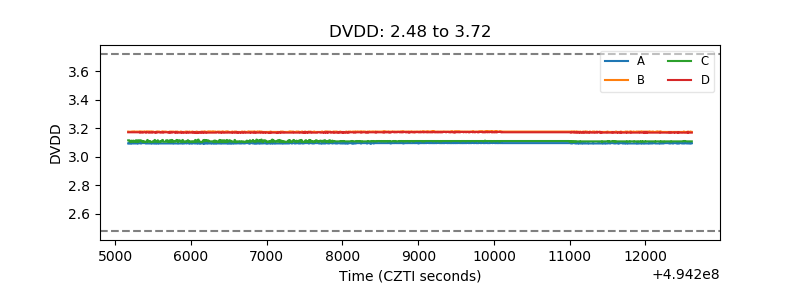 |
| Temperature 1 | 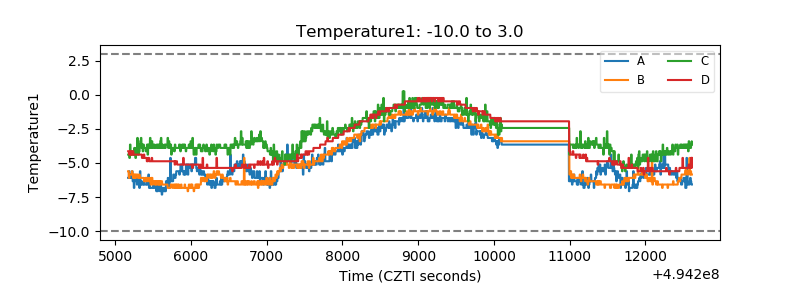 |
| Veto HV Monitor | 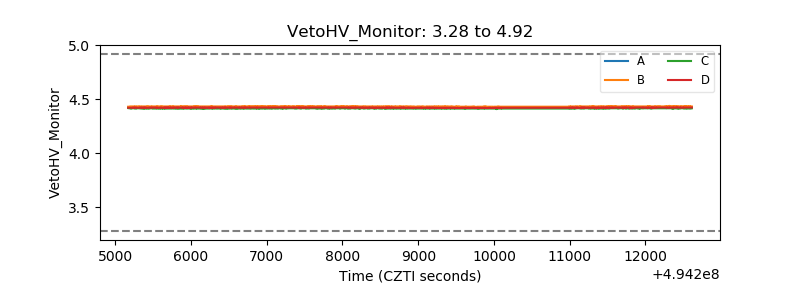 |
| Veto LLD | 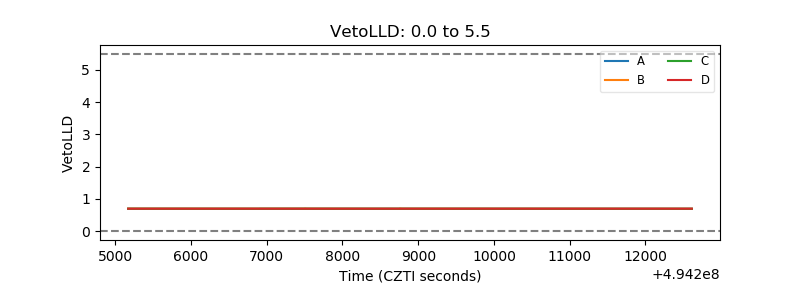 |
| Alpha Counter | 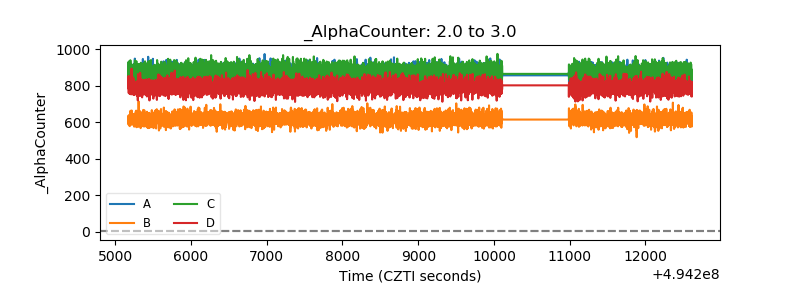 |
| _CPM_Rate | 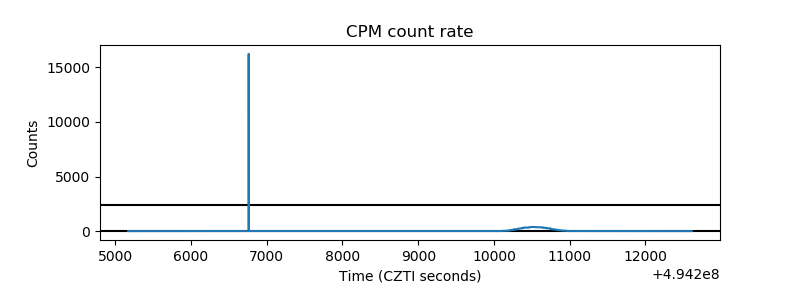 |
| CZT Counter | 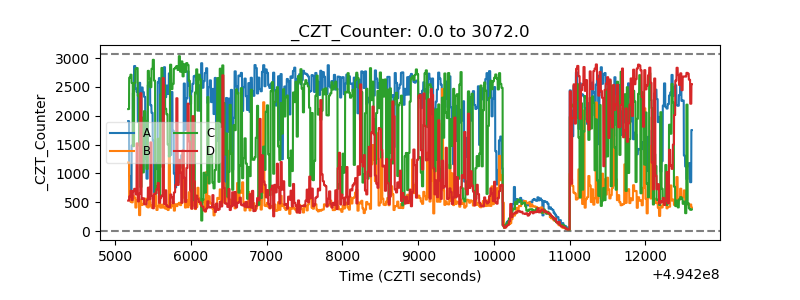 |
| +2.5 Volts monitor | 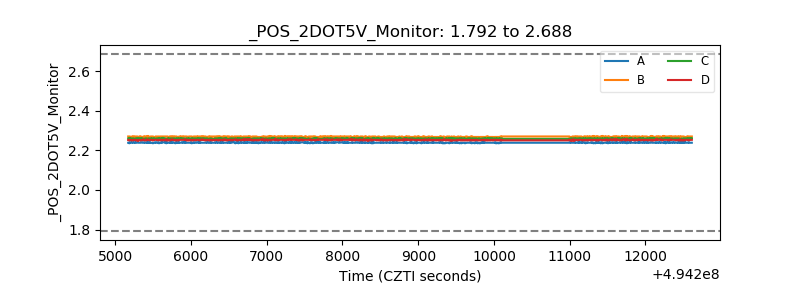 |
| +5 Volts monitor | 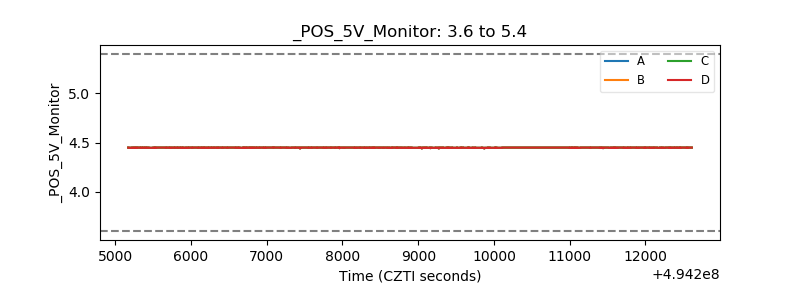 |
| _ROLL_ROT | 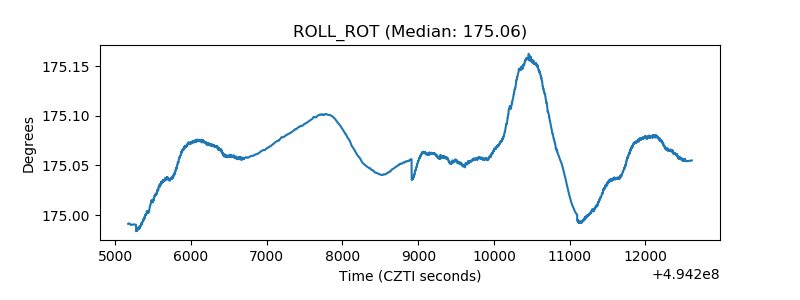 |
| _Roll_DEC | 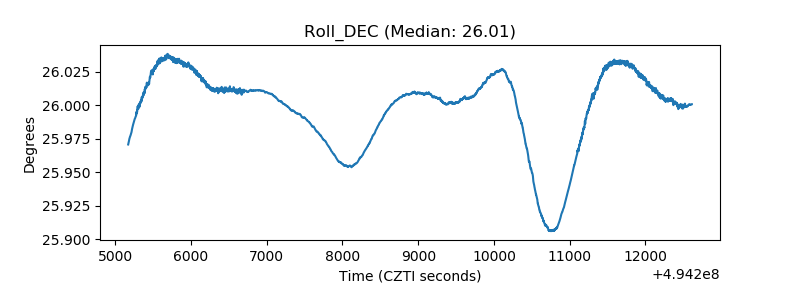 |
| _Roll_RA | 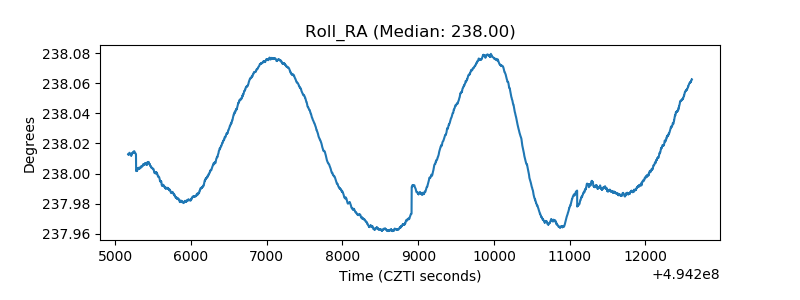 |
| Veto Counter | 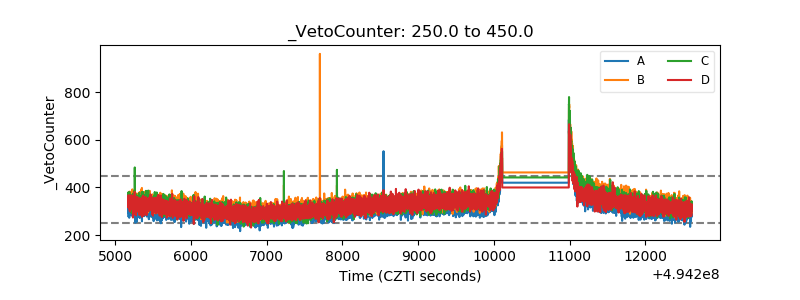 |