| Param | Original file | Final file |
|---|---|---|
| Filename | modeM0/AS1A14_022T05_9000006504_53672cztM0_level2.fits | modeM0/AS1A14_022T05_9000006504_53672cztM0_level2_quad_clean.evt |
| Size (bytes) | 1,178,550,720 | 62,184,960 |
| Size | 1.1 GB | 59.3 MB |
| Events in quadrant A | 13,892,589 | 226,650 |
| Events in quadrant B | 4,141,262 | 678,623 |
| Events in quadrant C | 13,079,518 | 236,763 |
| Events in quadrant D | 12,019,344 | 292,806 |
| Mode SS | |||
|---|---|---|---|
| Quadrant | BADHDUFLAG | Total packets | Discarded packets |
| A | 0 | 130 | 0 |
| B | 0 | 130 | 0 |
| C | 0 | 130 | 0 |
| D | 0 | 130 | 0 |
| Mode M9 | |||
|---|---|---|---|
| Quadrant | BADHDUFLAG | Total packets | Discarded packets |
| A | 0 | 11 | 0 |
| B | 0 | 11 | 0 |
| C | 0 | 11 | 0 |
| D | 0 | 11 | 0 |
| Mode M0 | |||
|---|---|---|---|
| Quadrant | BADHDUFLAG | Total packets | Discarded packets |
| A | 0 | 45723 | 1 |
| B | 0 | 16515 | 1 |
| C | 0 | 43246 | 1 |
| D | 0 | 40227 | 7 |
| Quadrant | Total seconds | Saturated seconds | Saturation percentage |
|---|---|---|---|
| A | 6414 | 4455 | 69.457437% |
| B | 6414 | 190 | 2.962270% |
| C | 6415 | 4259 | 66.391270% |
| D | 6414 | 3349 | 52.213907% |
Noise dominated data is calculated using 1-second bins in cleaned event files. If a bin has >2000 counts, and if more than 50% of those come from <1% of pixels, then it is considered to be noise-dominated and hence unusable.
| Quadrant | # 1 sec bins | Bins with >0 counts | Bins with >2000 counts | High rate bins dominated by noise | Noise dominated (total time) | Noise dominated (detector-on time) | Marked lightcurve |
|---|---|---|---|---|---|---|---|
| A | 7504 | 6414 | 4145 | 4145 | 55.24% | 64.62% | 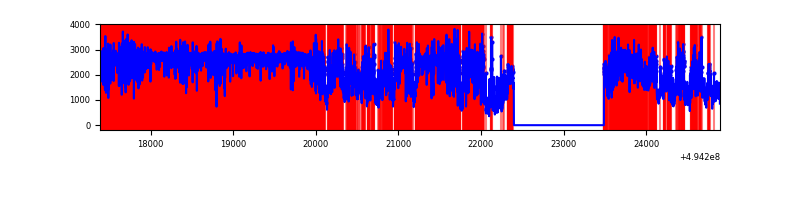 |
| B | 7504 | 6414 | 63 | 63 | 0.84% | 0.98% | 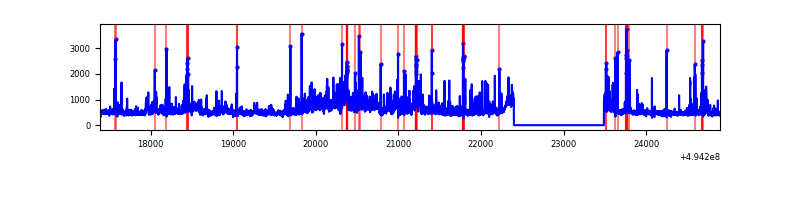 |
| C | 7504 | 6414 | 3757 | 3757 | 50.07% | 58.57% | 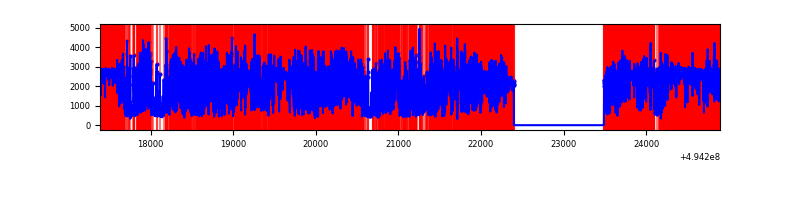 |
| D | 7504 | 6414 | 3094 | 3094 | 41.23% | 48.24% | 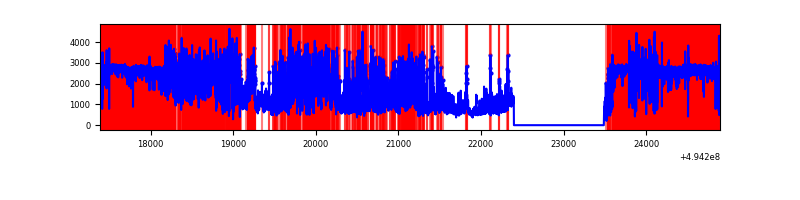 |
Top three noisy pixels from each quadrant. If the there are fewer than three noisy pixels in the level2.evt file, extra rows are filled as -1
| Pixel properties | Quadrant properties | ||||||
|---|---|---|---|---|---|---|---|
| Quadrant | DetID | PixID | Counts | Sigma | Mean | Median | Sigma |
| A | 3 | 63 | 8085907 | 67562.74 | 479 | 468 | 119.7 |
| A | 3 | 78 | 3392365 | 28343.03 | 479 | 468 | 119.7 |
| A | 4 | 249 | 259177 | 2161.8 | 479 | 468 | 119.7 |
| B | 7 | 0 | 384116 | 2505.37 | 708 | 684 | 153.0 |
| B | 5 | 172 | 347992 | 2269.33 | 708 | 684 | 153.0 |
| B | 10 | 254 | 153680 | 999.69 | 708 | 684 | 153.0 |
| C | 15 | 224 | 6466454 | 53986.69 | 434 | 429 | 119.8 |
| C | 1 | 241 | 4116031 | 34362.34 | 434 | 429 | 119.8 |
| C | 15 | 158 | 413524 | 3449.05 | 434 | 429 | 119.8 |
| D | 8 | 176 | 8052950 | 61641.84 | 453 | 432 | 130.6 |
| D | 12 | 34 | 777860 | 5951.19 | 453 | 432 | 130.6 |
| D | 3 | 12 | 761195 | 5823.62 | 453 | 432 | 130.6 |
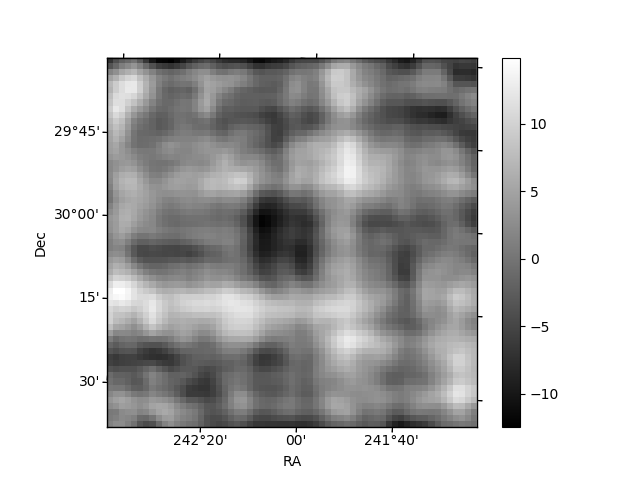
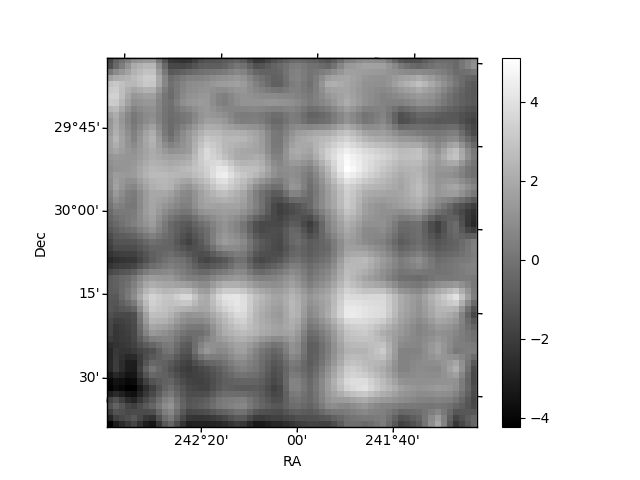
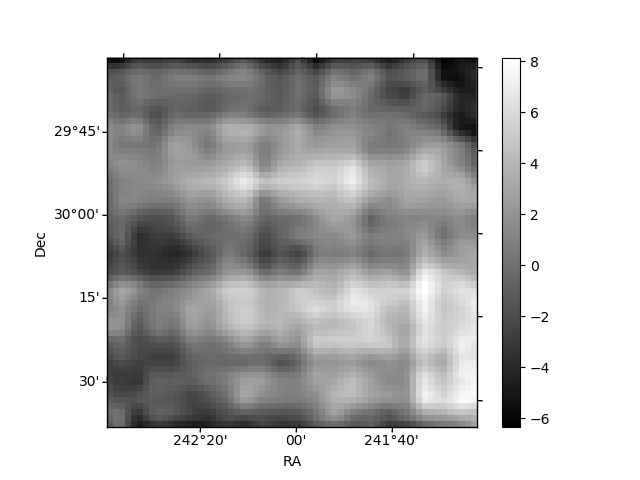
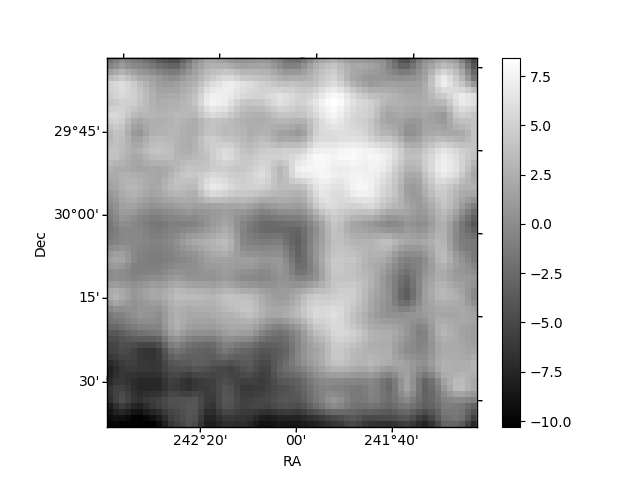
Histogram calculated using DETX and DETY for each event in the final _common_clean file
| Quadrant A | 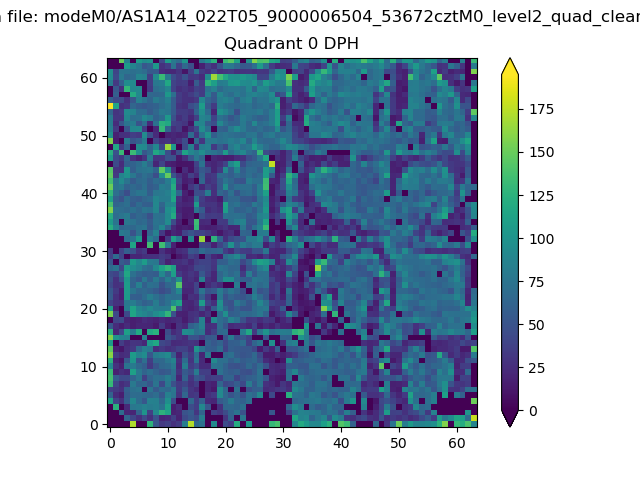 |
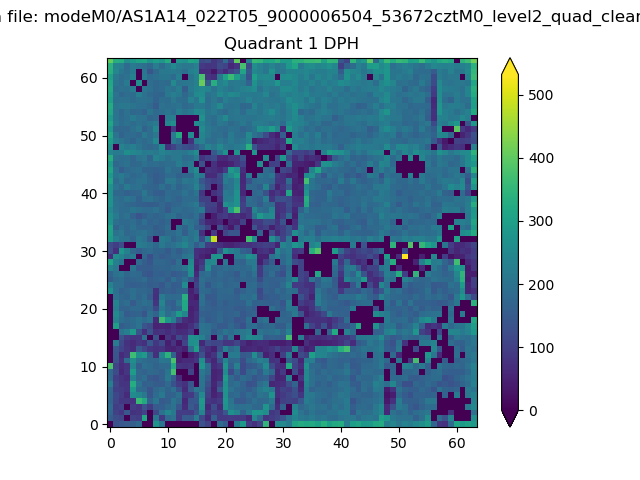 |
Quadrant B |
|---|---|---|---|
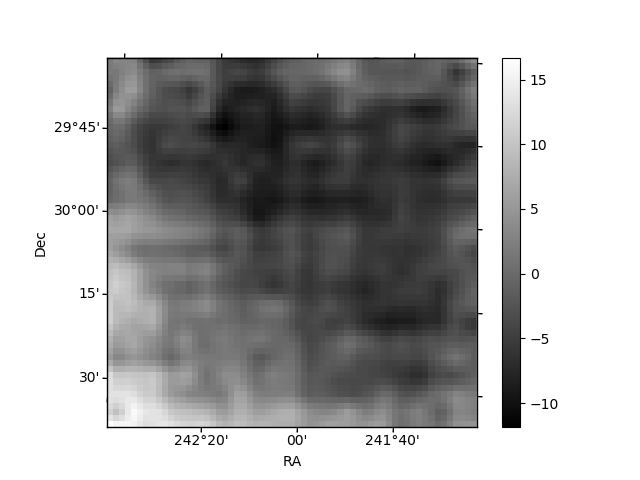
| Quadrant D | 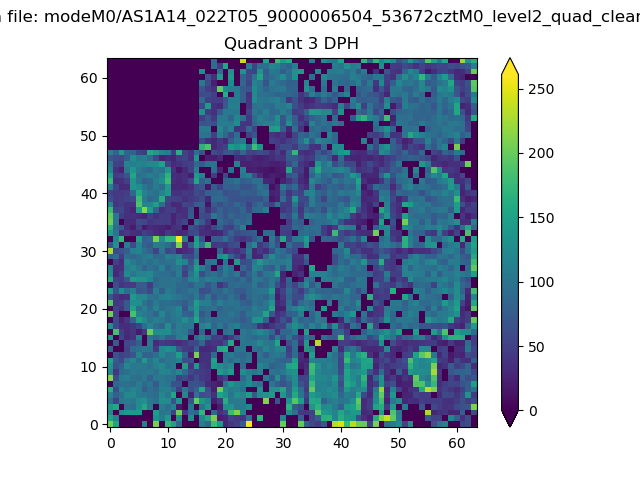 |
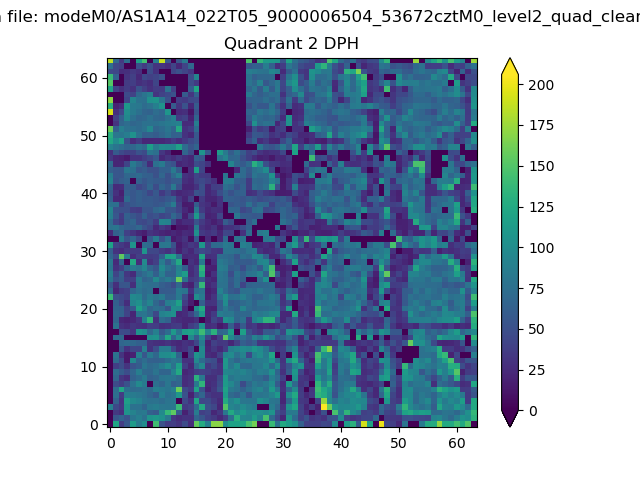 |
Quadrant C |
| Plot type | Count rate plots | Images |
|---|---|---|
| Comparison with Poisson distribution Blue bars denote a histogram of data divided into 1 sec bins. Red curve is a Poisson curve with rate = median count rate of data. |
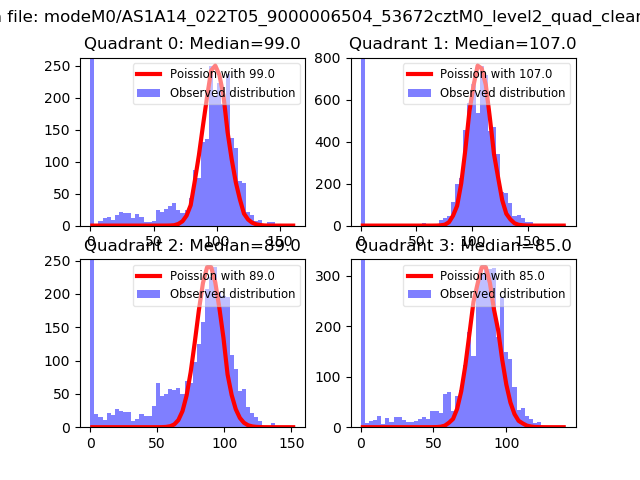 |
 |
| Quadrant-wise count rates Data is divided into 100 sec bins |
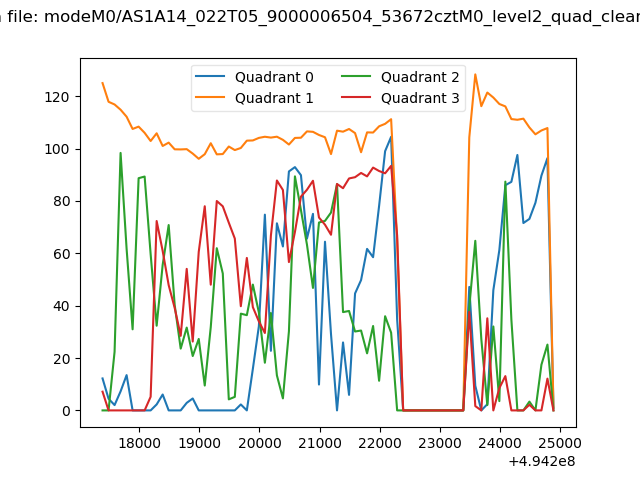 |
|
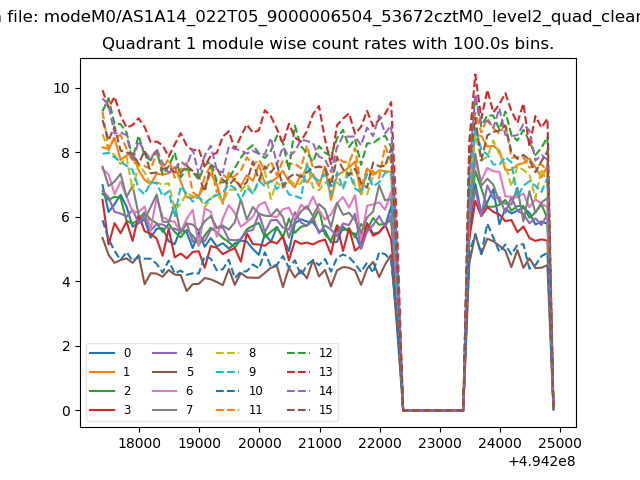
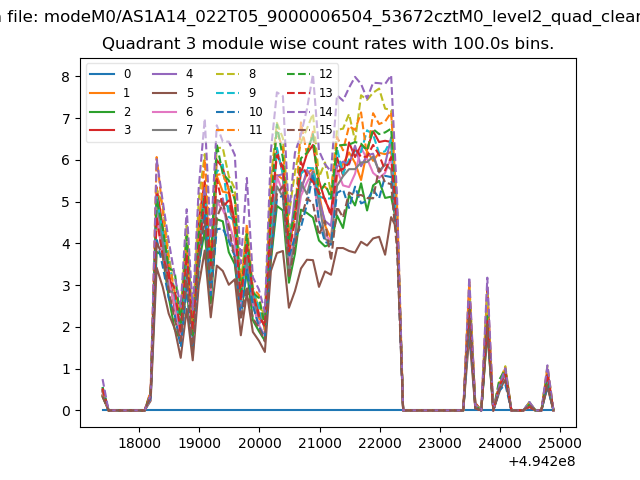
| Module-wise count rates for Quadrant A Data is divided into 100 sec bins |
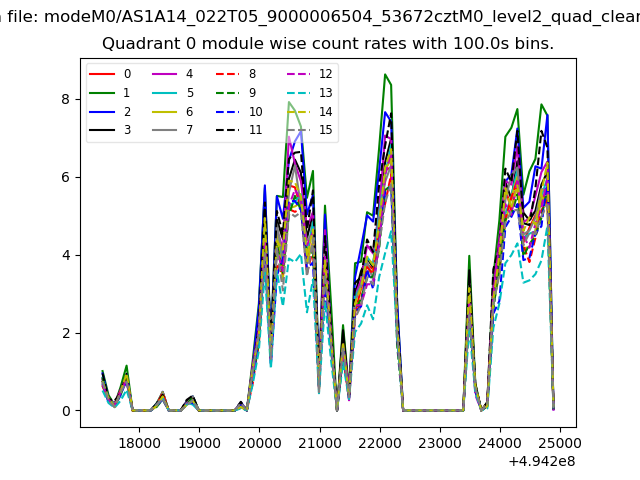 |
 |
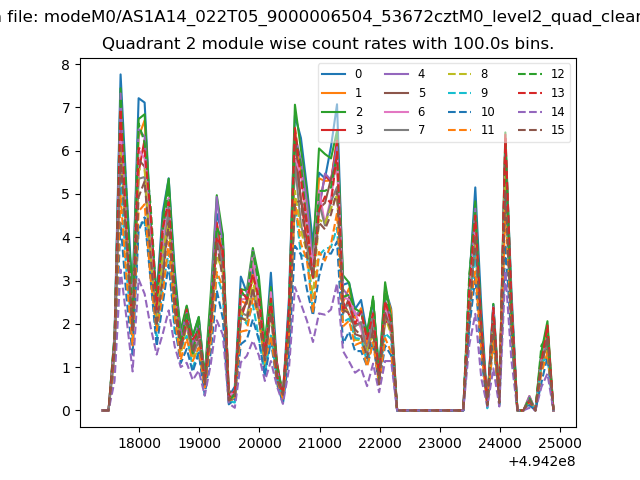
| Module-wise count rates for Quadrant B Data is divided into 100 sec bins |
 |
 |
| Module-wise count rates for Quadrant C Data is divided into 100 sec bins |
 |
 |
| Module-wise count rates for Quadrant D Data is divided into 100 sec bins |
 |
 |
| Parameter | Plot |
|---|---|
| CZT HV Monitor |  |
| D_VDD | 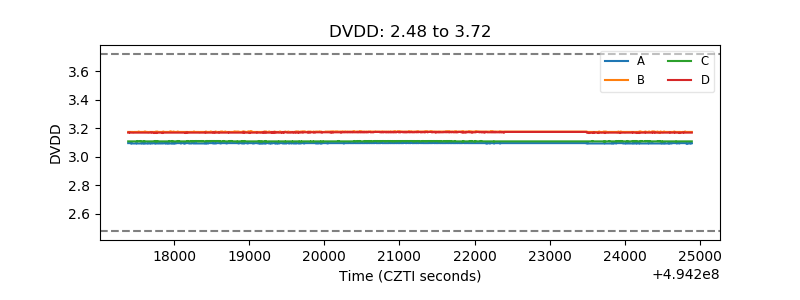 |
| Temperature 1 | 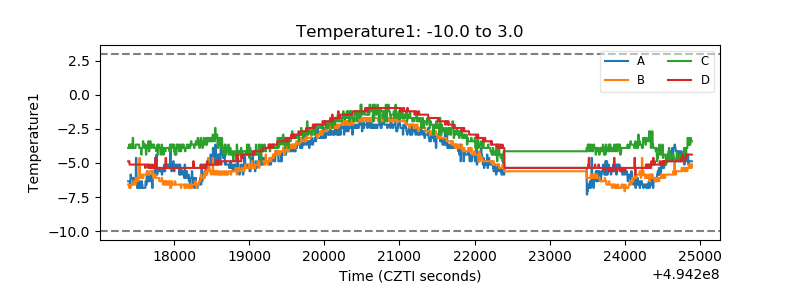 |
| Veto HV Monitor | 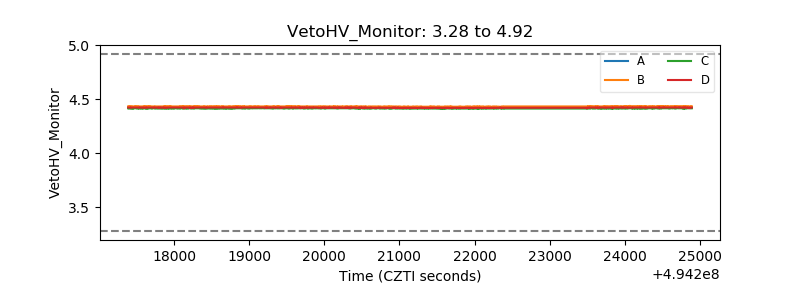 |
| Veto LLD | 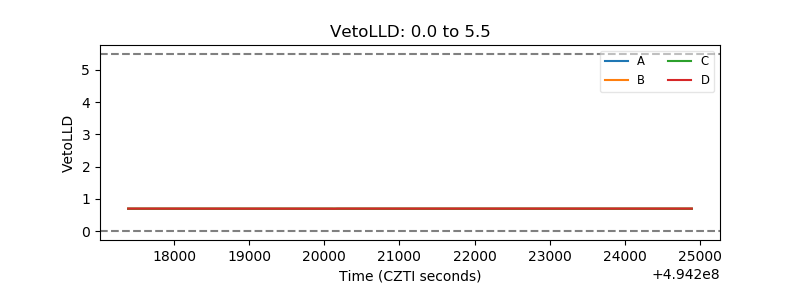 |
| Alpha Counter | 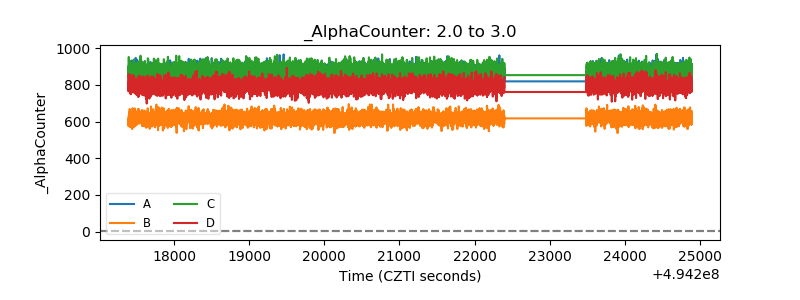 |
| _CPM_Rate | 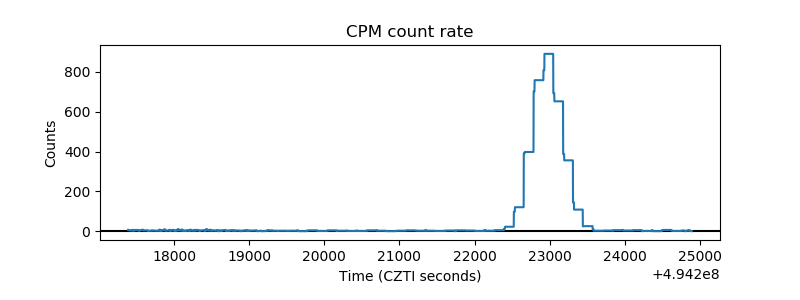 |
| CZT Counter | 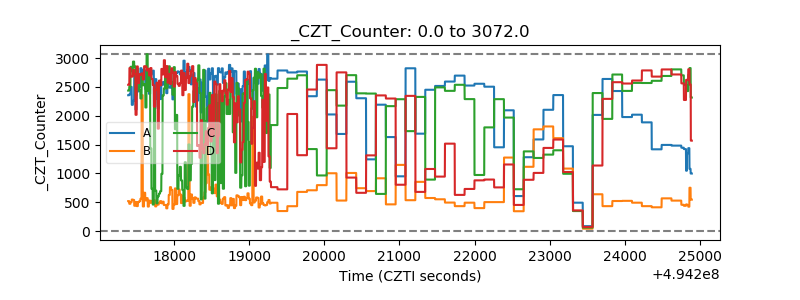 |
| +2.5 Volts monitor |  |
| +5 Volts monitor |  |
| _ROLL_ROT | 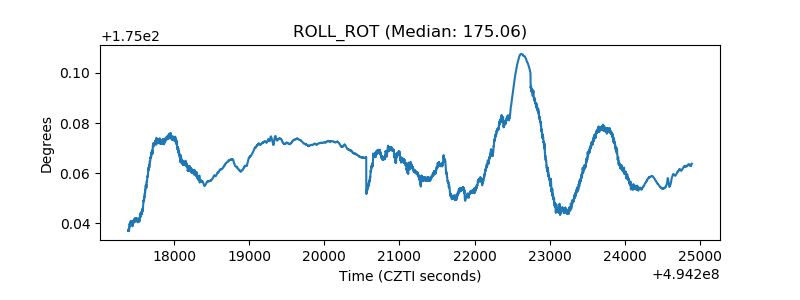 |
| _Roll_DEC | 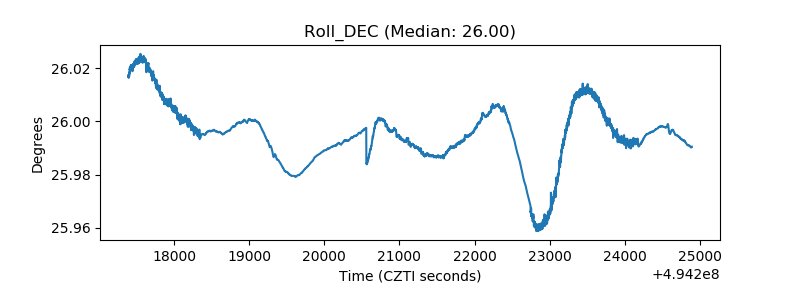 |
| _Roll_RA | 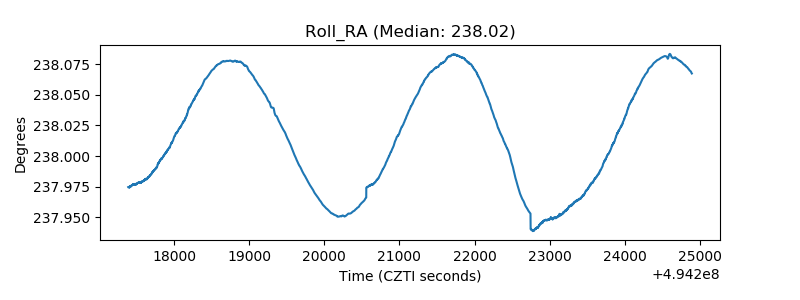 |
| Veto Counter | 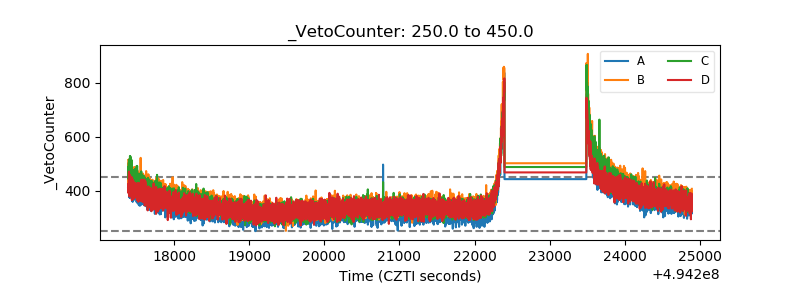 |