| Param | Original file | Final file |
|---|---|---|
| Filename | modeM0/AS1A14_022T05_9000006504_53674cztM0_level2.fits | modeM0/AS1A14_022T05_9000006504_53674cztM0_level2_quad_clean.evt |
| Size (bytes) | 1,123,963,200 | 67,167,360 |
| Size | 1.0 GB | 64.1 MB |
| Events in quadrant A | 13,244,390 | 262,013 |
| Events in quadrant B | 4,675,716 | 687,298 |
| Events in quadrant C | 11,826,750 | 314,547 |
| Events in quadrant D | 11,359,718 | 317,967 |
| Mode SS | |||
|---|---|---|---|
| Quadrant | BADHDUFLAG | Total packets | Discarded packets |
| A | 0 | 130 | 0 |
| B | 0 | 130 | 0 |
| C | 0 | 130 | 0 |
| D | 0 | 130 | 0 |
| Mode M9 | |||
|---|---|---|---|
| Quadrant | BADHDUFLAG | Total packets | Discarded packets |
| A | 0 | 12 | 0 |
| B | 0 | 12 | 0 |
| C | 0 | 12 | 0 |
| D | 0 | 12 | 0 |
| Mode M0 | |||
|---|---|---|---|
| Quadrant | BADHDUFLAG | Total packets | Discarded packets |
| A | 0 | 43807 | 1 |
| B | 0 | 18141 | 1 |
| C | 0 | 39530 | 1 |
| D | 0 | 38207 | 1 |
| Quadrant | Total seconds | Saturated seconds | Saturation percentage |
|---|---|---|---|
| A | 6473 | 4251 | 65.672795% |
| B | 6474 | 432 | 6.672845% |
| C | 6474 | 3645 | 56.302132% |
| D | 6474 | 3240 | 50.046339% |
Noise dominated data is calculated using 1-second bins in cleaned event files. If a bin has >2000 counts, and if more than 50% of those come from <1% of pixels, then it is considered to be noise-dominated and hence unusable.
| Quadrant | # 1 sec bins | Bins with >0 counts | Bins with >2000 counts | High rate bins dominated by noise | Noise dominated (total time) | Noise dominated (detector-on time) | Marked lightcurve |
|---|---|---|---|---|---|---|---|
| A | 7638 | 6473 | 3810 | 3810 | 49.88% | 58.86% | 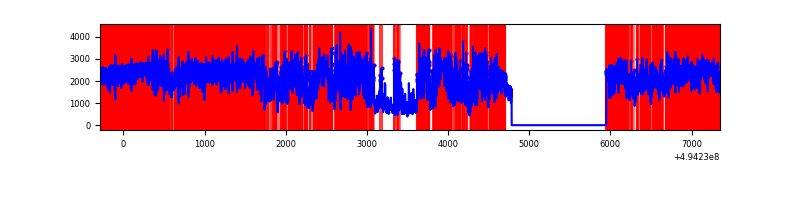 |
| B | 7639 | 6474 | 244 | 244 | 3.19% | 3.77% | 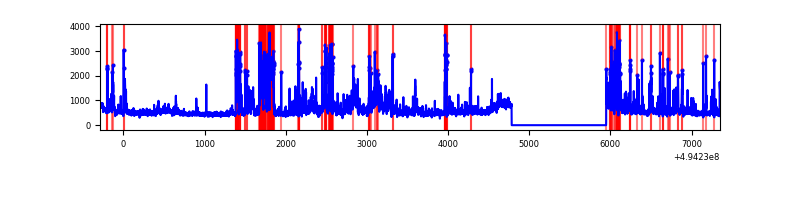 |
| C | 7639 | 6474 | 3126 | 3126 | 40.92% | 48.29% | 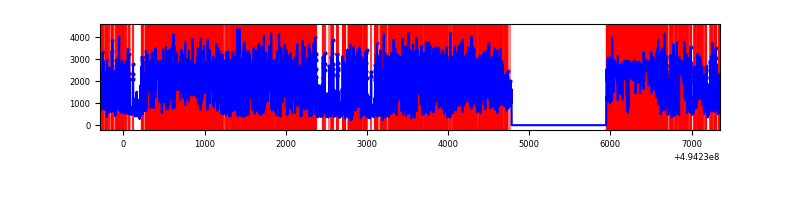 |
| D | 7639 | 6474 | 2844 | 2844 | 37.23% | 43.93% | 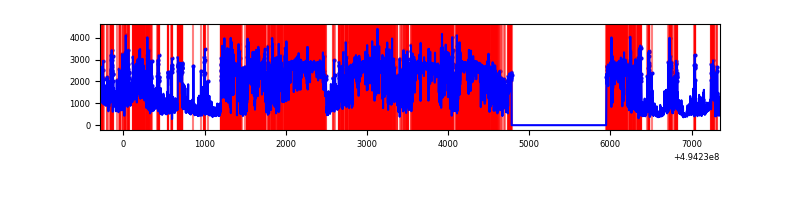 |
Top three noisy pixels from each quadrant. If the there are fewer than three noisy pixels in the level2.evt file, extra rows are filled as -1
| Pixel properties | Quadrant properties | ||||||
|---|---|---|---|---|---|---|---|
| Quadrant | DetID | PixID | Counts | Sigma | Mean | Median | Sigma |
| A | 3 | 63 | 8936870 | 66326.27 | 538 | 527 | 134.7 |
| A | 3 | 78 | 1260196 | 9349.37 | 538 | 527 | 134.7 |
| A | 15 | 174 | 360237 | 2669.8 | 538 | 527 | 134.7 |
| B | 5 | 185 | 870598 | 5602.35 | 725 | 703 | 155.3 |
| B | 7 | 0 | 499748 | 3213.98 | 725 | 703 | 155.3 |
| B | 2 | 249 | 102987 | 658.74 | 725 | 703 | 155.3 |
| C | 15 | 224 | 6887447 | 49432.34 | 507 | 502 | 139.3 |
| C | 1 | 241 | 2364128 | 16965.37 | 507 | 502 | 139.3 |
| C | 15 | 158 | 250581 | 1794.99 | 507 | 502 | 139.3 |
| D | 12 | 34 | 4965414 | 33798.23 | 502 | 480 | 146.9 |
| D | 8 | 176 | 3265194 | 22224.17 | 502 | 480 | 146.9 |
| D | 2 | 37 | 277271 | 1884.22 | 502 | 480 | 146.9 |
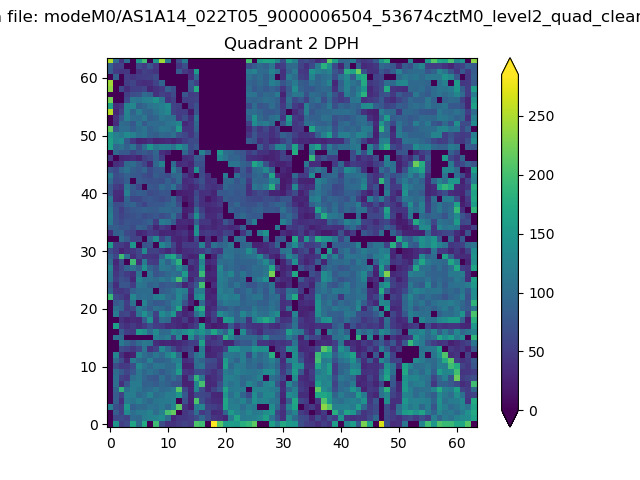
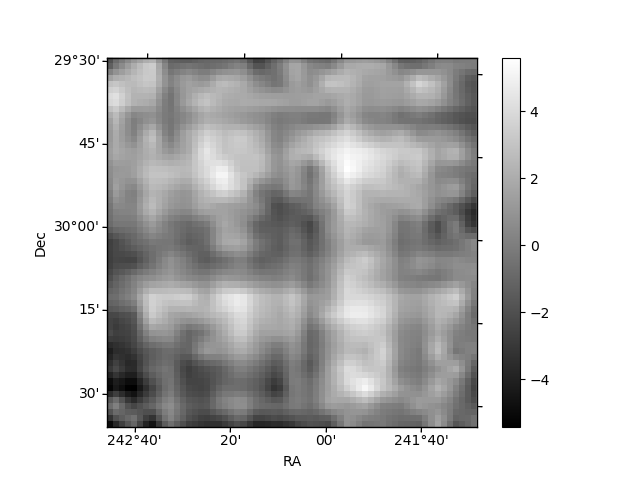
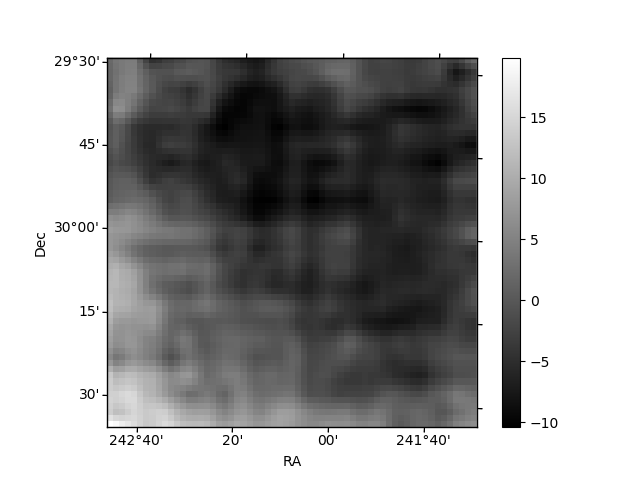
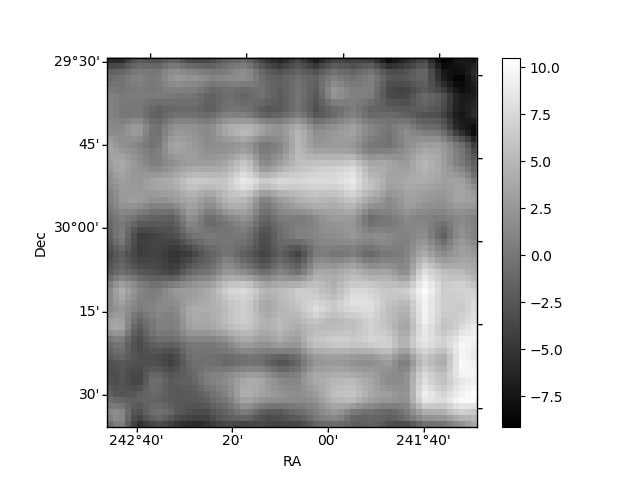
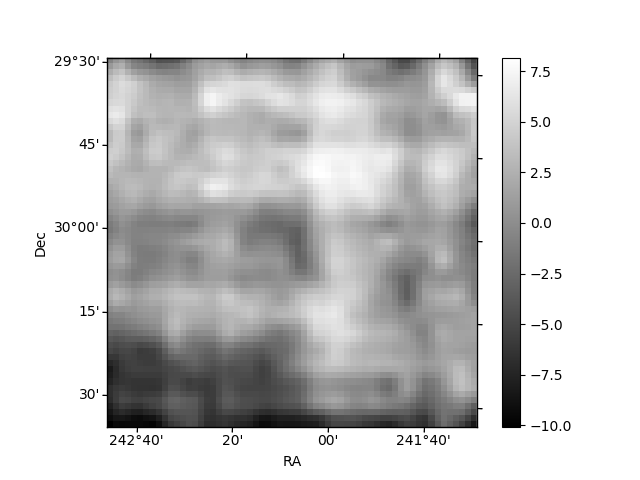
Histogram calculated using DETX and DETY for each event in the final _common_clean file
| Quadrant A | 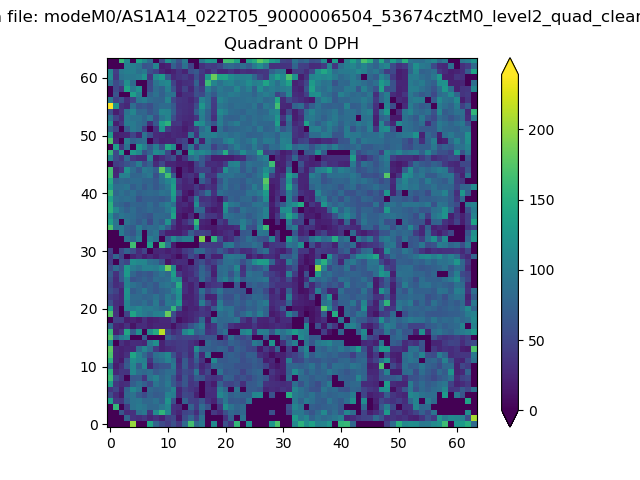 |
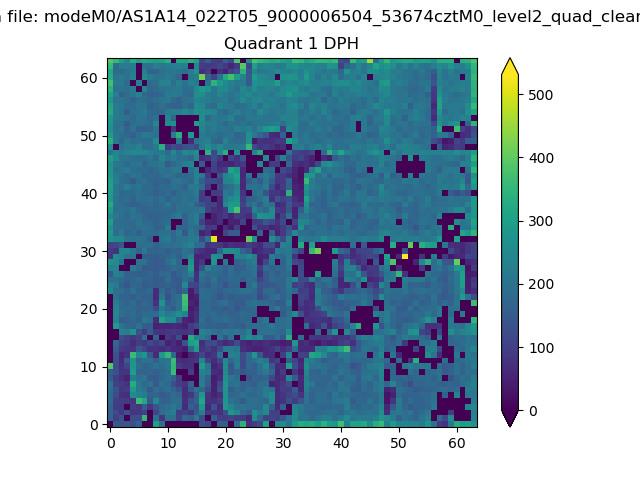 |
Quadrant B |
|---|---|---|---|
| Quadrant D | 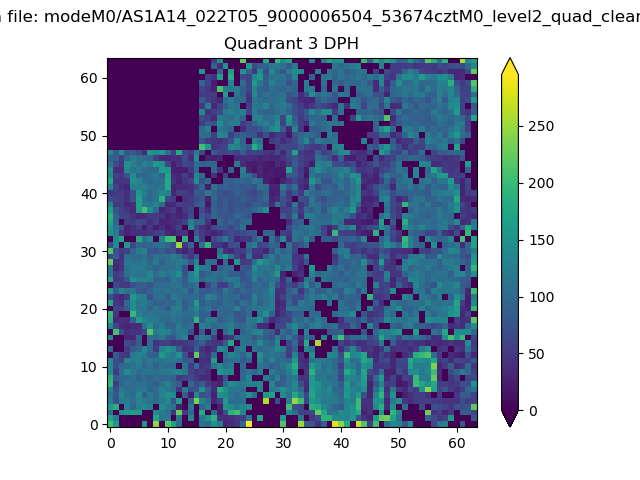 |
 |
Quadrant C |
| Plot type | Count rate plots | Images |
|---|---|---|
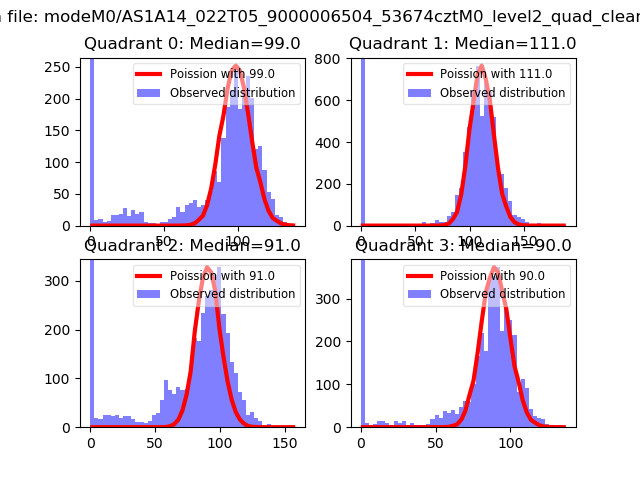
| Comparison with Poisson distribution Blue bars denote a histogram of data divided into 1 sec bins. Red curve is a Poisson curve with rate = median count rate of data. |
 |
 |
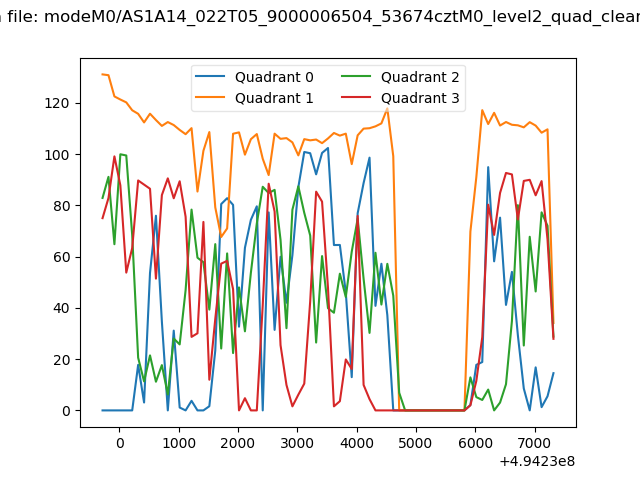
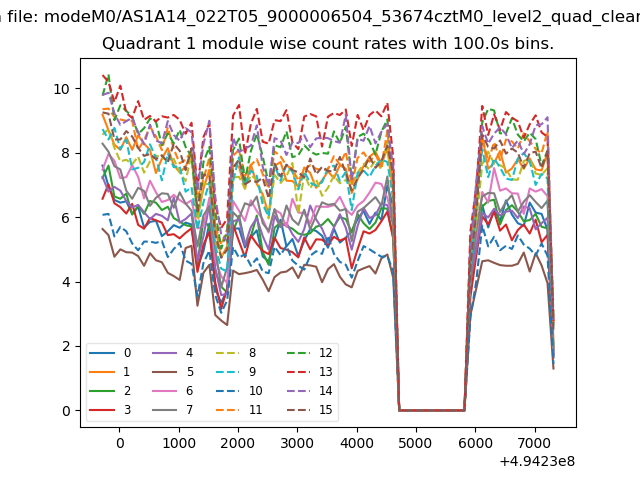
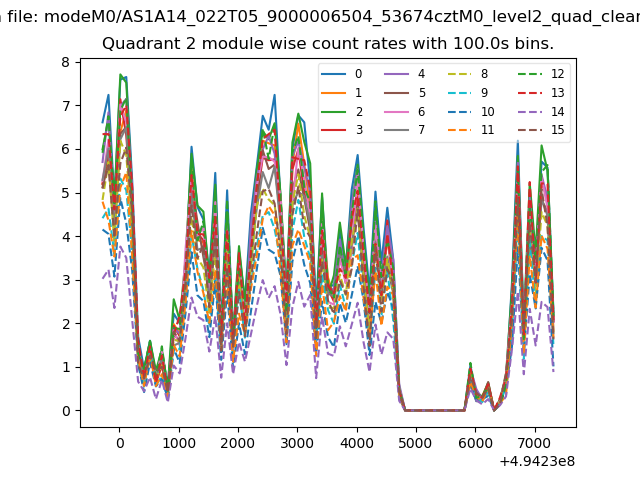
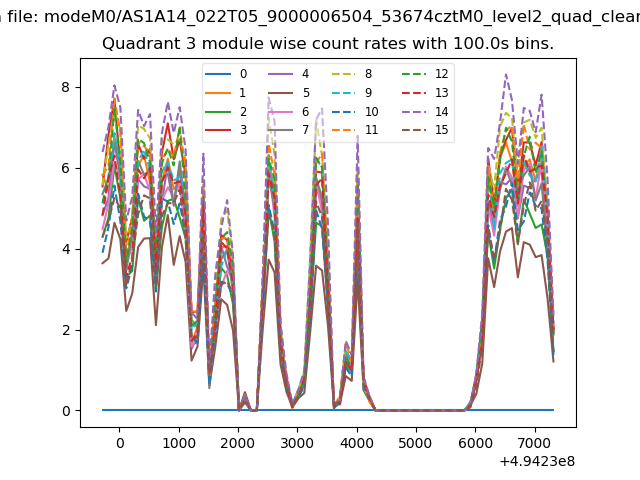
| Quadrant-wise count rates Data is divided into 100 sec bins |
 |
|
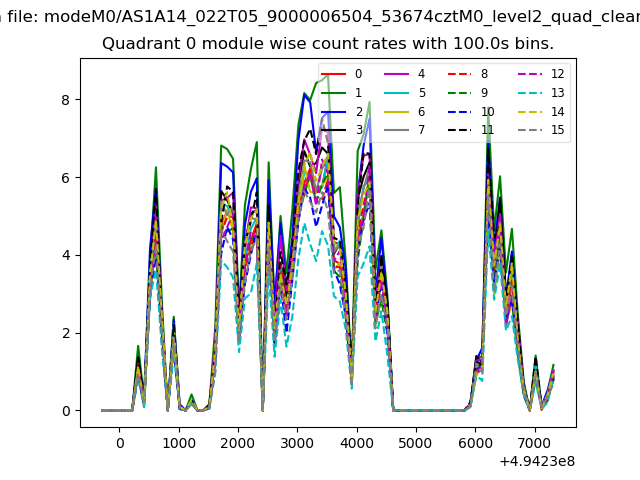
| Module-wise count rates for Quadrant A Data is divided into 100 sec bins |
 |
 |
| Module-wise count rates for Quadrant B Data is divided into 100 sec bins |
 |
 |
| Module-wise count rates for Quadrant C Data is divided into 100 sec bins |
 |
 |
| Module-wise count rates for Quadrant D Data is divided into 100 sec bins |
 |
 |
| Parameter | Plot |
|---|---|
| CZT HV Monitor |  |
| D_VDD | 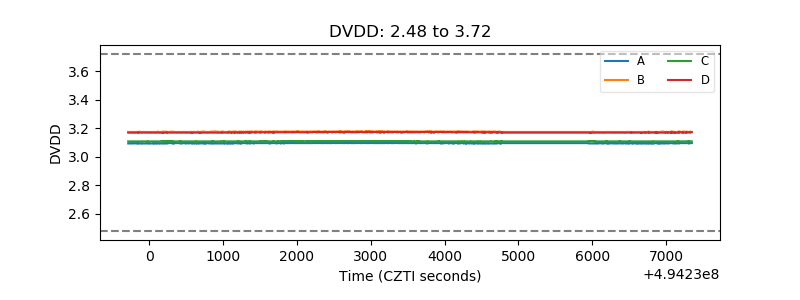 |
| Temperature 1 | 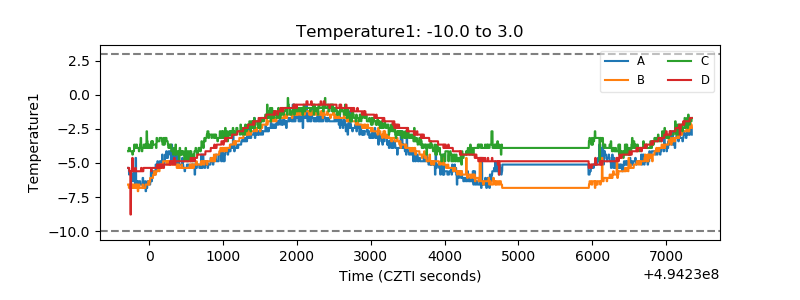 |
| Veto HV Monitor | 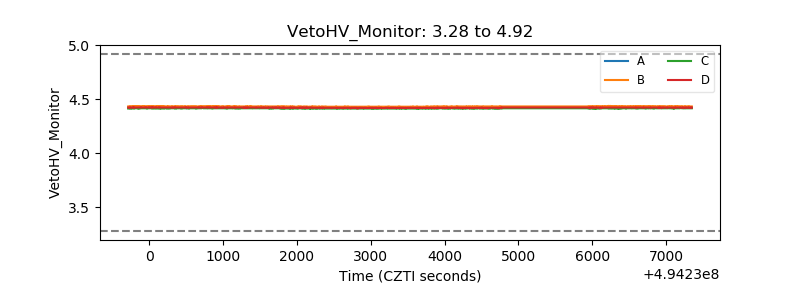 |
| Veto LLD | 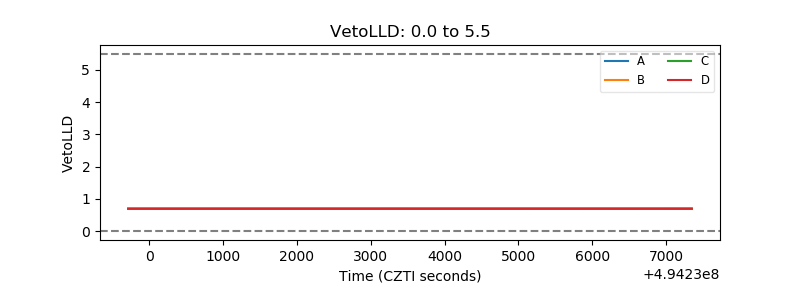 |
| Alpha Counter | 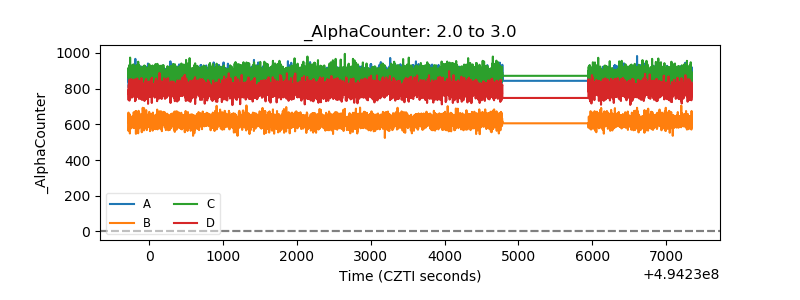 |
| _CPM_Rate | 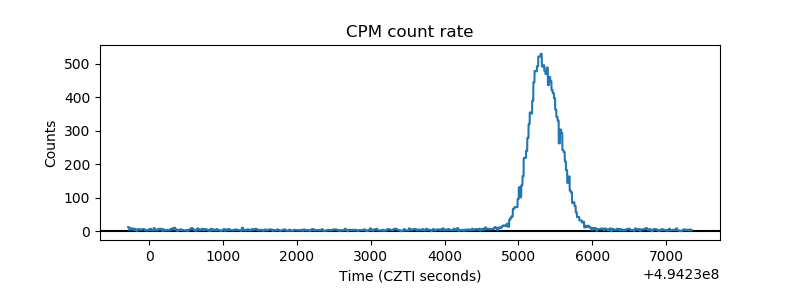 |
| CZT Counter | 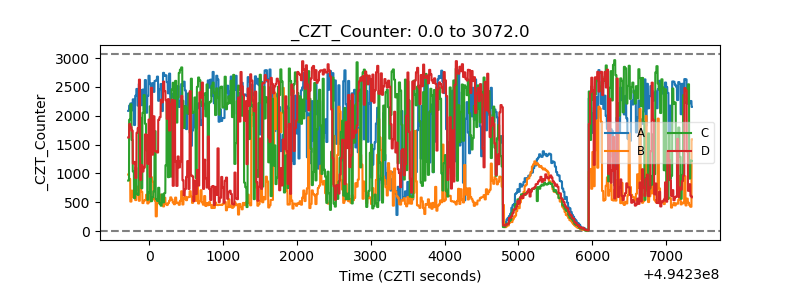 |
| +2.5 Volts monitor |  |
| +5 Volts monitor |  |
| _ROLL_ROT | 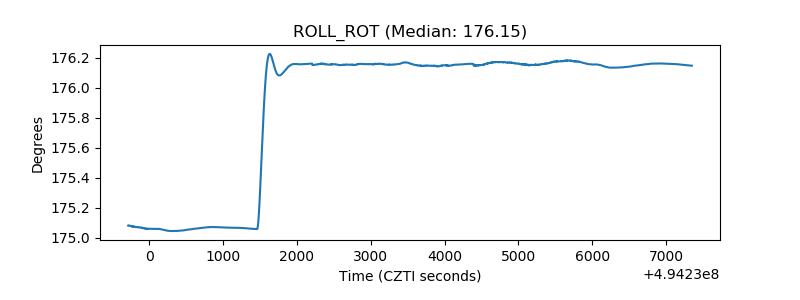 |
| _Roll_DEC | 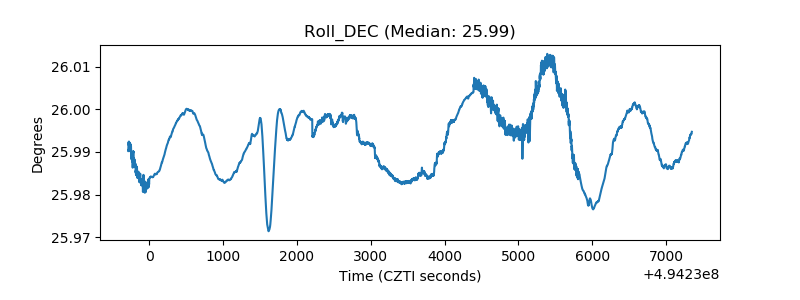 |
| _Roll_RA | 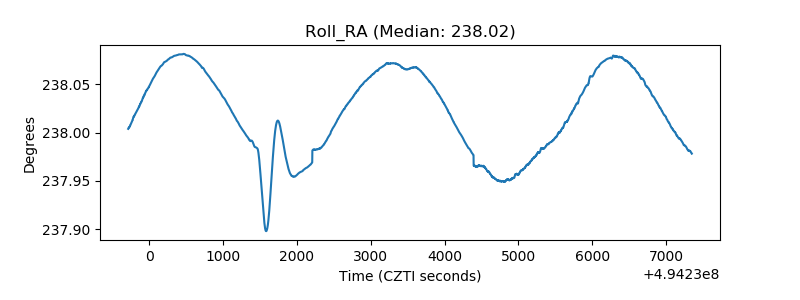 |
| Veto Counter | 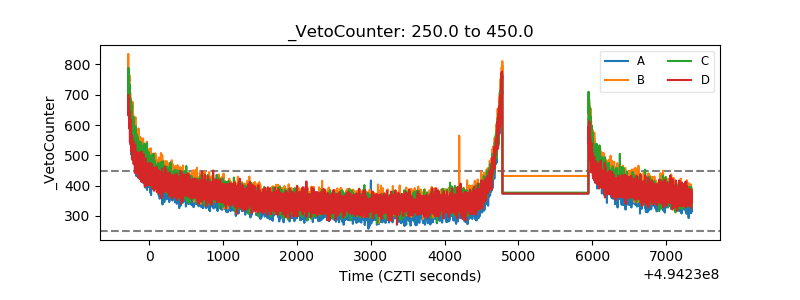 |