| Param | Original file | Final file |
|---|---|---|
| Filename | modeM0/AS1A14_022T05_9000006504_53675cztM0_level2.fits | modeM0/AS1A14_022T05_9000006504_53675cztM0_level2_quad_clean.evt |
| Size (bytes) | 1,123,007,040 | 65,540,160 |
| Size | 1.0 GB | 62.5 MB |
| Events in quadrant A | 15,143,891 | 135,982 |
| Events in quadrant B | 4,301,202 | 682,879 |
| Events in quadrant C | 12,501,399 | 275,653 |
| Events in quadrant D | 9,121,198 | 434,954 |
| Mode SS | |||
|---|---|---|---|
| Quadrant | BADHDUFLAG | Total packets | Discarded packets |
| A | 0 | 132 | 0 |
| B | 0 | 132 | 0 |
| C | 0 | 132 | 0 |
| D | 0 | 132 | 0 |
| Mode M9 | |||
|---|---|---|---|
| Quadrant | BADHDUFLAG | Total packets | Discarded packets |
| A | 0 | 11 | 0 |
| B | 0 | 11 | 0 |
| C | 0 | 11 | 0 |
| D | 0 | 11 | 0 |
| Mode M0 | |||
|---|---|---|---|
| Quadrant | BADHDUFLAG | Total packets | Discarded packets |
| A | 0 | 49438 | 1 |
| B | 0 | 17171 | 1 |
| C | 0 | 41606 | 9 |
| D | 0 | 31603 | 1 |
| Quadrant | Total seconds | Saturated seconds | Saturation percentage |
|---|---|---|---|
| A | 6519 | 5428 | 83.264304% |
| B | 6519 | 315 | 4.832029% |
| C | 6518 | 3907 | 59.941700% |
| D | 6518 | 1869 | 28.674440% |
Noise dominated data is calculated using 1-second bins in cleaned event files. If a bin has >2000 counts, and if more than 50% of those come from <1% of pixels, then it is considered to be noise-dominated and hence unusable.
| Quadrant | # 1 sec bins | Bins with >0 counts | Bins with >2000 counts | High rate bins dominated by noise | Noise dominated (total time) | Noise dominated (detector-on time) | Marked lightcurve |
|---|---|---|---|---|---|---|---|
| A | 7593 | 6518 | 5094 | 5094 | 67.09% | 78.15% | 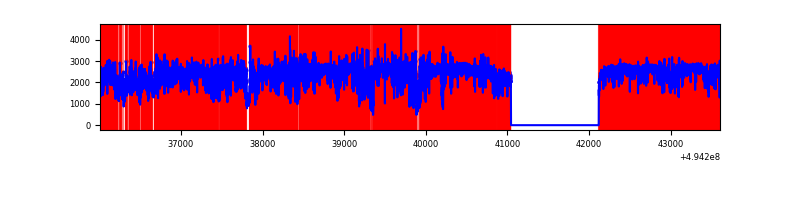 |
| B | 7594 | 6519 | 153 | 153 | 2.01% | 2.35% | 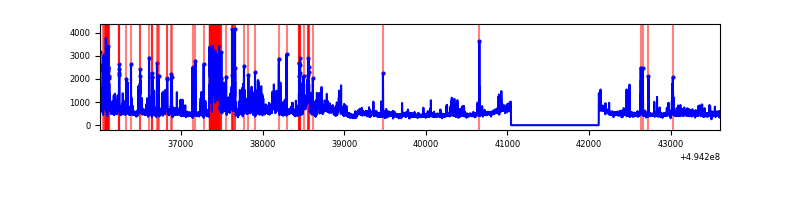 |
| C | 7592 | 6517 | 3549 | 3549 | 46.75% | 54.46% | 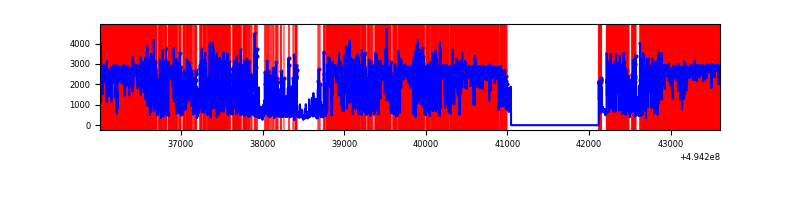 |
| D | 7593 | 6518 | 1700 | 1700 | 22.39% | 26.08% | 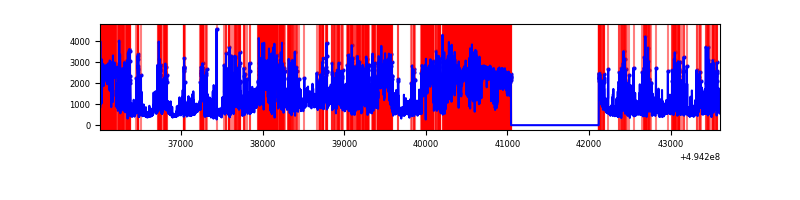 |
Top three noisy pixels from each quadrant. If the there are fewer than three noisy pixels in the level2.evt file, extra rows are filled as -1
| Pixel properties | Quadrant properties | ||||||
|---|---|---|---|---|---|---|---|
| Quadrant | DetID | PixID | Counts | Sigma | Mean | Median | Sigma |
| A | 3 | 63 | 10794650 | 97597.52 | 447 | 437 | 110.6 |
| A | 3 | 78 | 1319796 | 11929.19 | 447 | 437 | 110.6 |
| A | 12 | 115 | 719080 | 6497.72 | 447 | 437 | 110.6 |
| B | 5 | 185 | 432998 | 2805.33 | 719 | 697 | 154.1 |
| B | 7 | 0 | 427842 | 2771.88 | 719 | 697 | 154.1 |
| B | 2 | 136 | 326137 | 2111.88 | 719 | 697 | 154.1 |
| C | 1 | 241 | 5671490 | 44947.23 | 456 | 452 | 126.2 |
| C | 15 | 224 | 4520766 | 35826.88 | 456 | 452 | 126.2 |
| C | 15 | 158 | 127183 | 1004.44 | 456 | 452 | 126.2 |
| D | 8 | 176 | 3207915 | 19108.45 | 581 | 555 | 167.9 |
| D | 12 | 34 | 1592619 | 9485.02 | 581 | 555 | 167.9 |
| D | 2 | 62 | 682010 | 4059.9 | 581 | 555 | 167.9 |
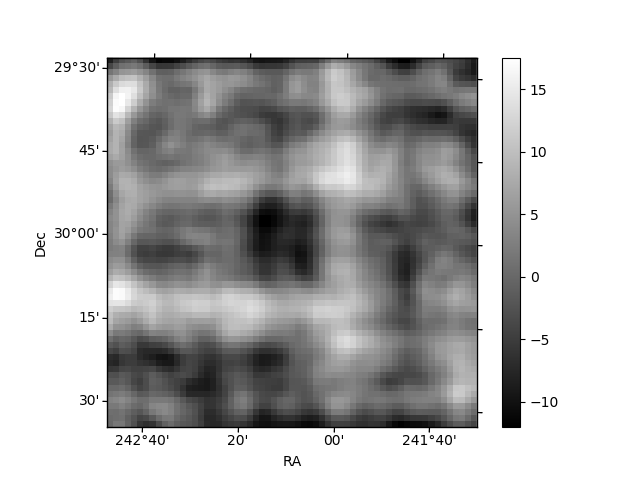
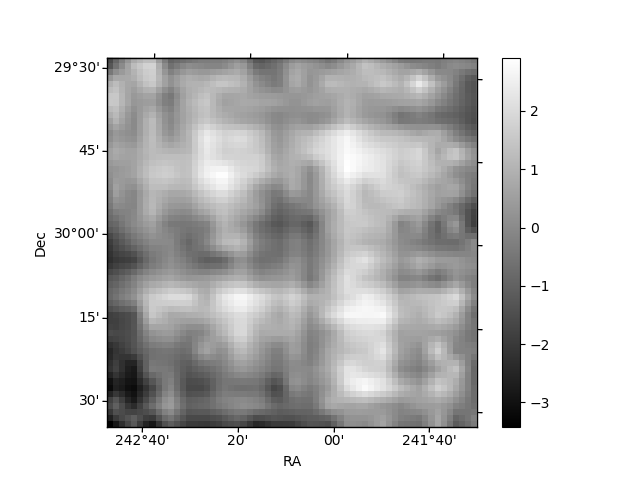
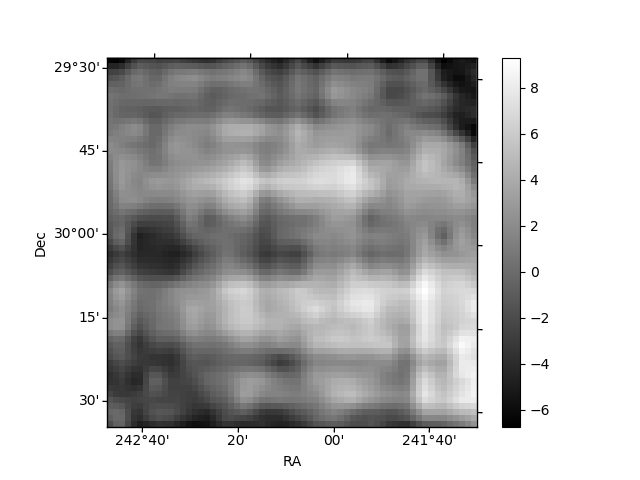
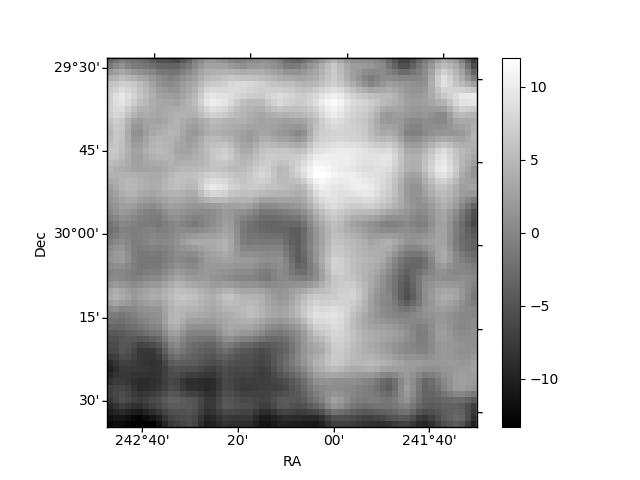
Histogram calculated using DETX and DETY for each event in the final _common_clean file
| Quadrant A | 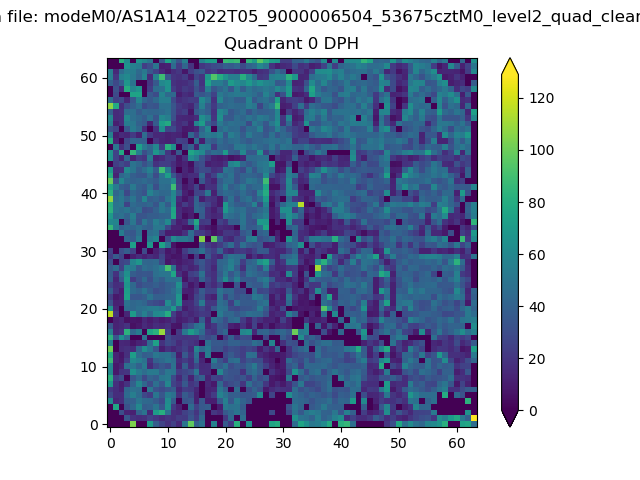 |
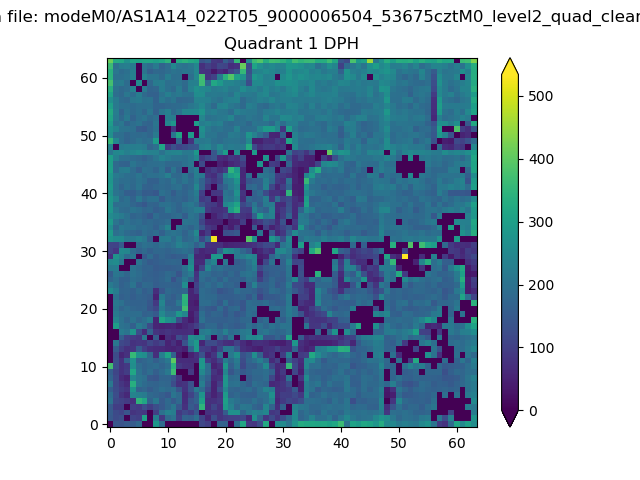 |
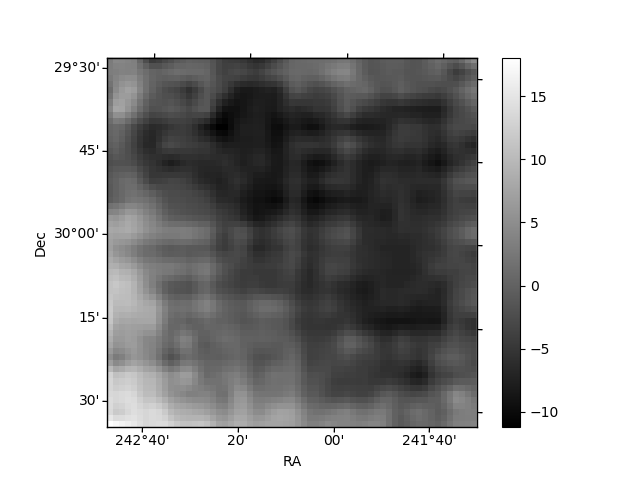
Quadrant B |
|---|---|---|---|
| Quadrant D | 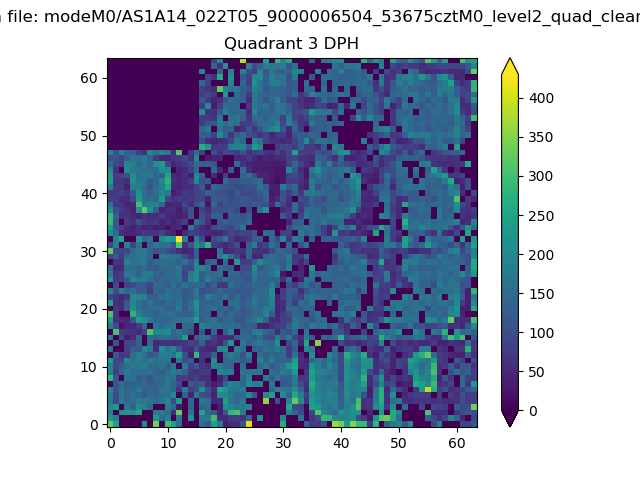 |
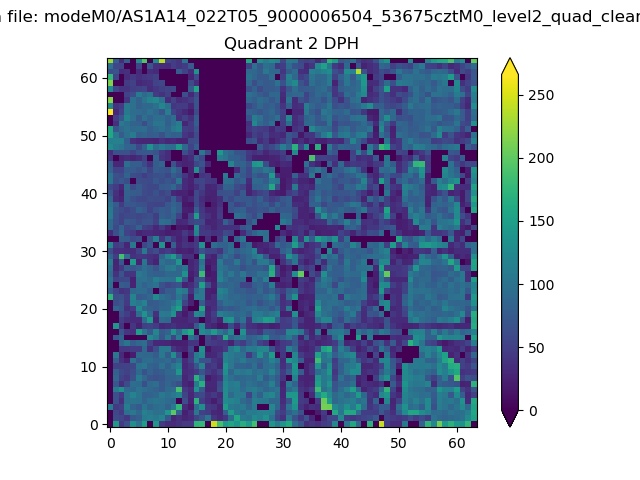 |
Quadrant C |
| Plot type | Count rate plots | Images |
|---|---|---|
| Comparison with Poisson distribution Blue bars denote a histogram of data divided into 1 sec bins. Red curve is a Poisson curve with rate = median count rate of data. |
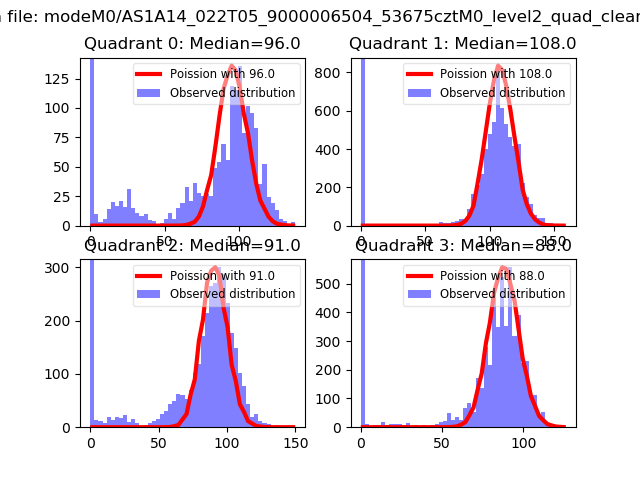 |
 |
| Quadrant-wise count rates Data is divided into 100 sec bins |
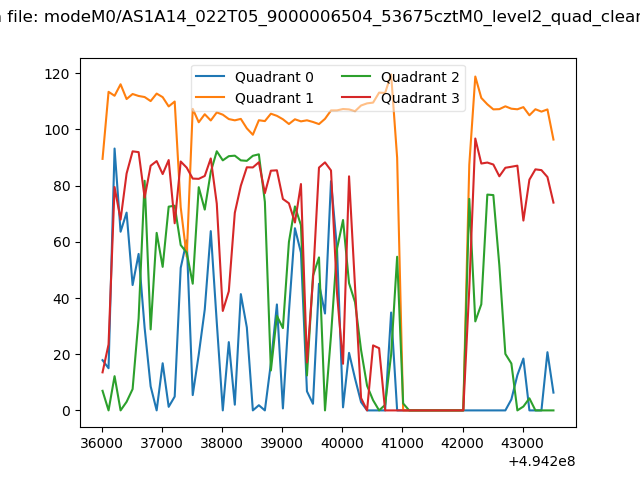 |
|
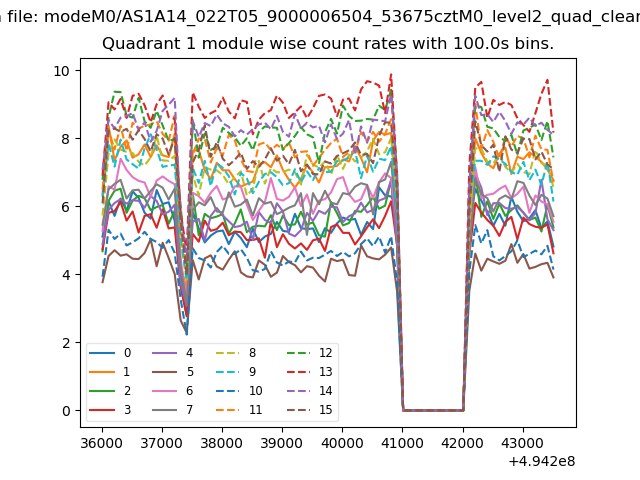
| Module-wise count rates for Quadrant A Data is divided into 100 sec bins |
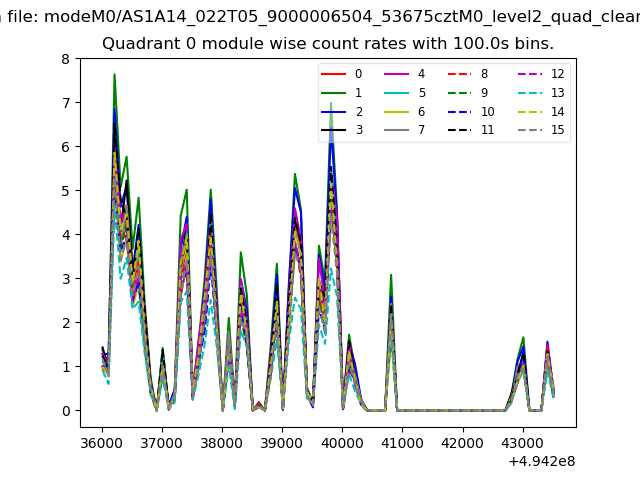 |
 |
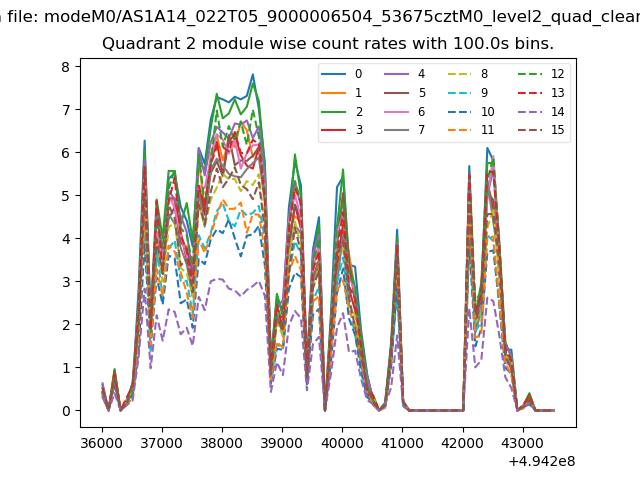
| Module-wise count rates for Quadrant B Data is divided into 100 sec bins |
 |
 |
| Module-wise count rates for Quadrant C Data is divided into 100 sec bins |
 |
 |
| Module-wise count rates for Quadrant D Data is divided into 100 sec bins |
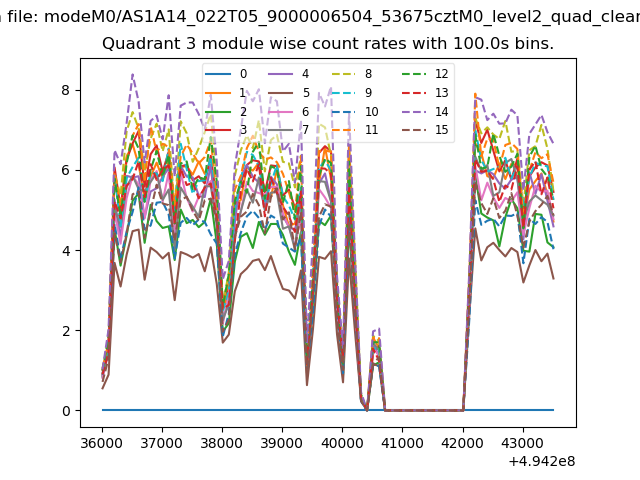 |
 |
| Parameter | Plot |
|---|---|
| CZT HV Monitor | 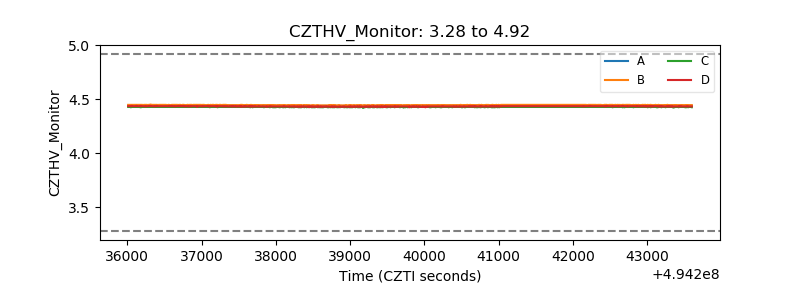 |
| D_VDD | 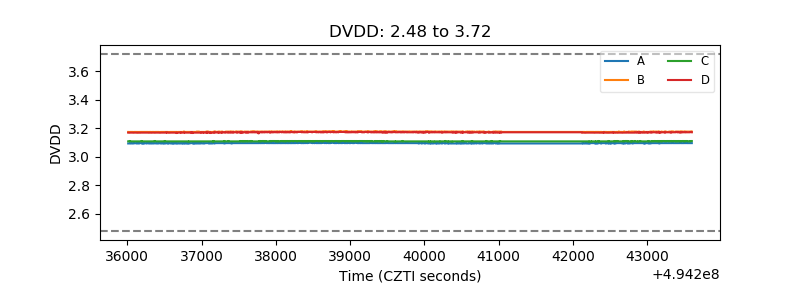 |
| Temperature 1 | 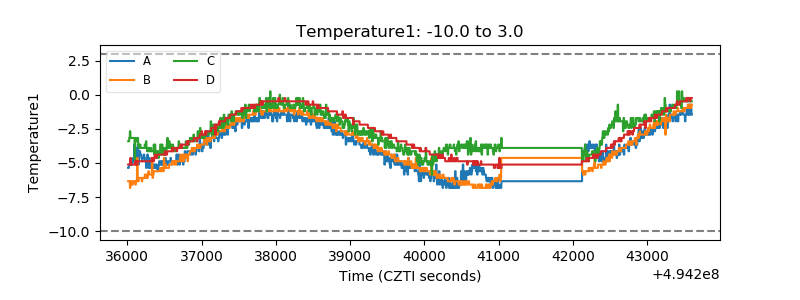 |
| Veto HV Monitor | 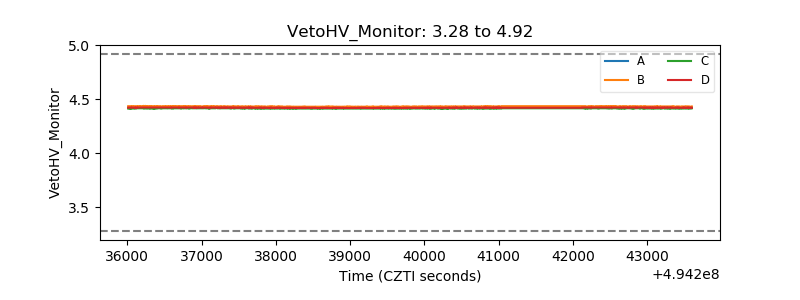 |
| Veto LLD | 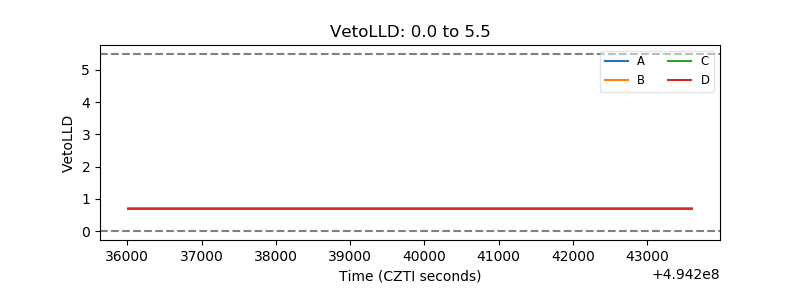 |
| Alpha Counter | 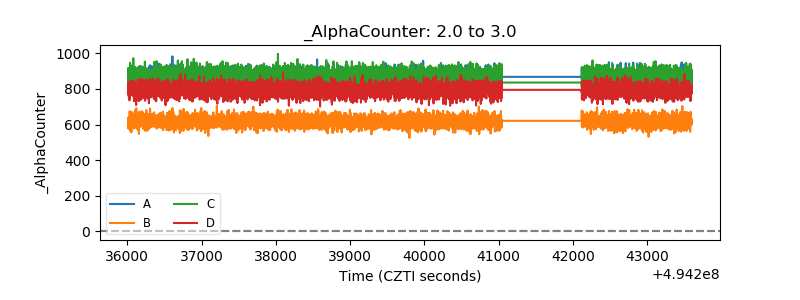 |
| _CPM_Rate | 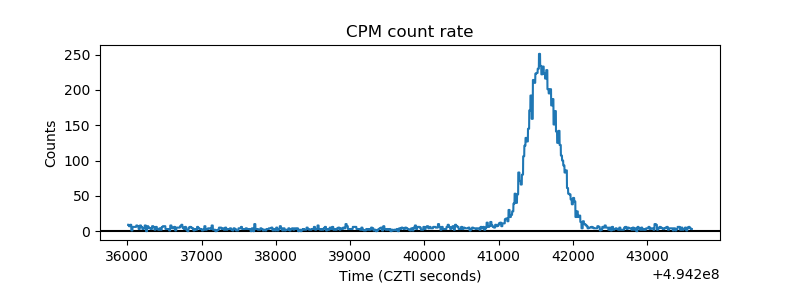 |
| CZT Counter | 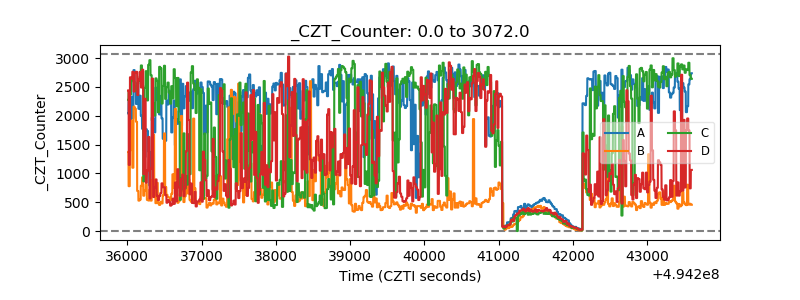 |
| +2.5 Volts monitor | 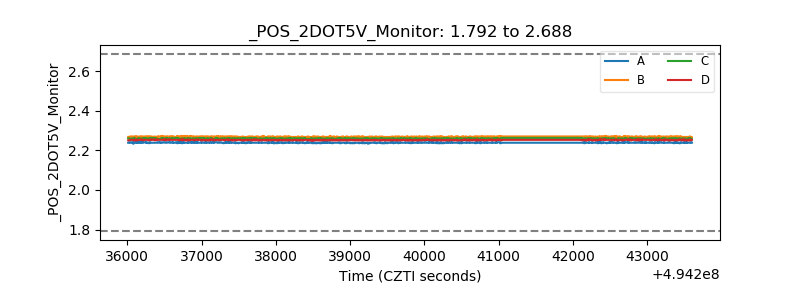 |
| +5 Volts monitor | 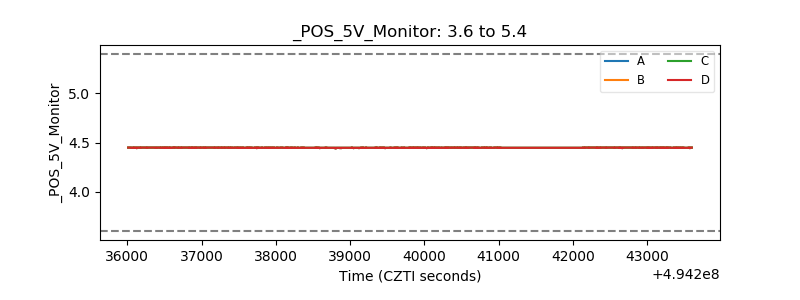 |
| _ROLL_ROT | 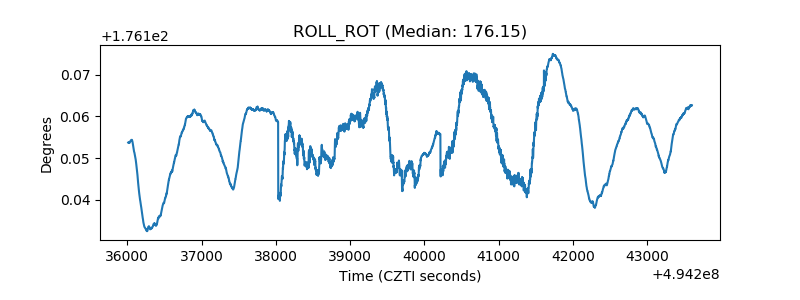 |
| _Roll_DEC | 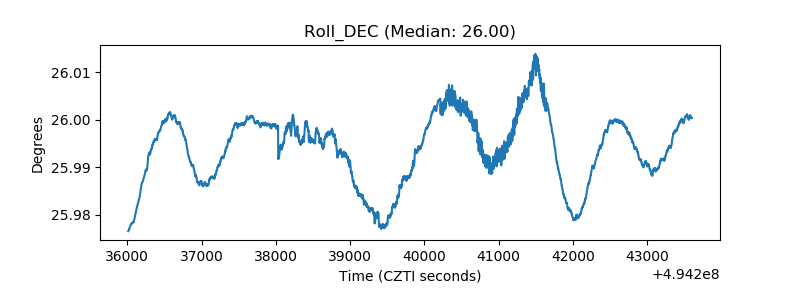 |
| _Roll_RA | 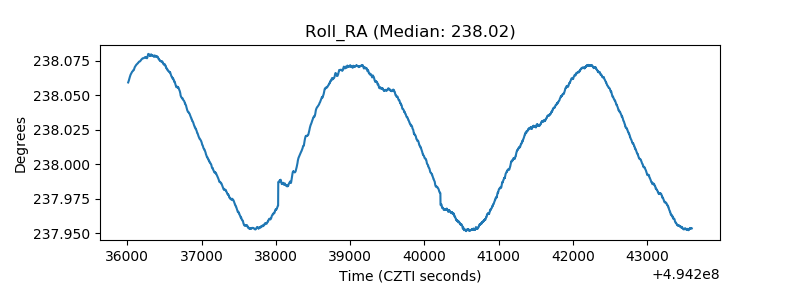 |
| Veto Counter | 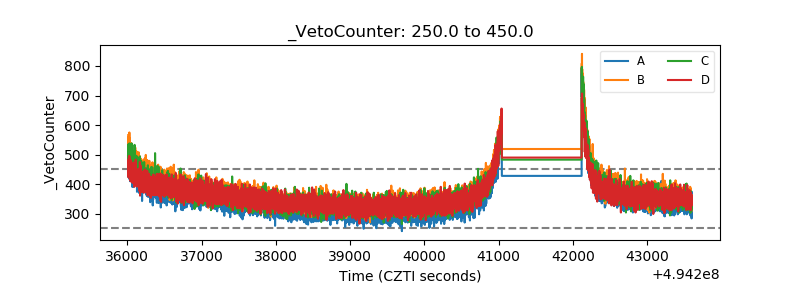 |