| Param | Original file | Final file |
|---|---|---|
| Filename | modeM0/AS1A14_022T05_9000006504_53676cztM0_level2.fits | modeM0/AS1A14_022T05_9000006504_53676cztM0_level2_quad_clean.evt |
| Size (bytes) | 1,194,171,840 | 57,277,440 |
| Size | 1.1 GB | 54.6 MB |
| Events in quadrant A | 12,966,992 | 228,460 |
| Events in quadrant B | 3,864,205 | 650,994 |
| Events in quadrant C | 14,866,752 | 126,526 |
| Events in quadrant D | 12,012,734 | 280,112 |
| Mode SS | |||
|---|---|---|---|
| Quadrant | BADHDUFLAG | Total packets | Discarded packets |
| A | 0 | 132 | 0 |
| B | 0 | 132 | 0 |
| C | 0 | 132 | 0 |
| D | 0 | 132 | 0 |
| Mode M9 | |||
|---|---|---|---|
| Quadrant | BADHDUFLAG | Total packets | Discarded packets |
| A | 0 | 7 | 0 |
| B | 0 | 7 | 0 |
| C | 0 | 7 | 0 |
| D | 0 | 7 | 0 |
| Mode M0 | |||
|---|---|---|---|
| Quadrant | BADHDUFLAG | Total packets | Discarded packets |
| A | 0 | 42949 | 1 |
| B | 0 | 15832 | 1 |
| C | 0 | 48448 | 1 |
| D | 0 | 40187 | 1 |
| Quadrant | Total seconds | Saturated seconds | Saturation percentage |
|---|---|---|---|
| A | 6412 | 4259 | 66.422333% |
| B | 6413 | 255 | 3.976298% |
| C | 6413 | 5271 | 82.192422% |
| D | 6413 | 3454 | 53.859348% |
Noise dominated data is calculated using 1-second bins in cleaned event files. If a bin has >2000 counts, and if more than 50% of those come from <1% of pixels, then it is considered to be noise-dominated and hence unusable.
| Quadrant | # 1 sec bins | Bins with >0 counts | Bins with >2000 counts | High rate bins dominated by noise | Noise dominated (total time) | Noise dominated (detector-on time) | Marked lightcurve |
|---|---|---|---|---|---|---|---|
| A | 7166 | 6411 | 3898 | 3898 | 54.40% | 60.80% | 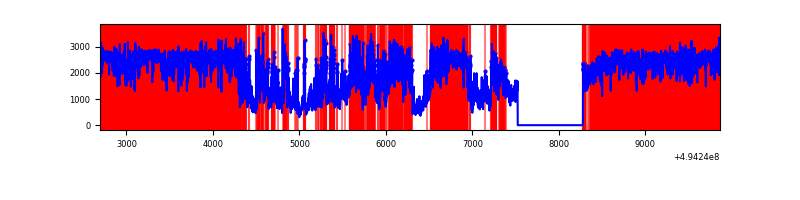 |
| B | 7168 | 6413 | 52 | 52 | 0.73% | 0.81% | 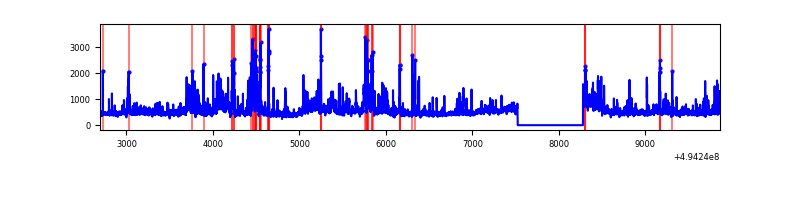 |
| C | 7168 | 6413 | 4875 | 4875 | 68.01% | 76.02% | 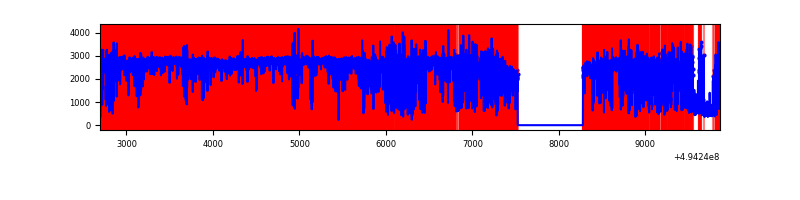 |
| D | 7168 | 6413 | 3172 | 3172 | 44.25% | 49.46% | 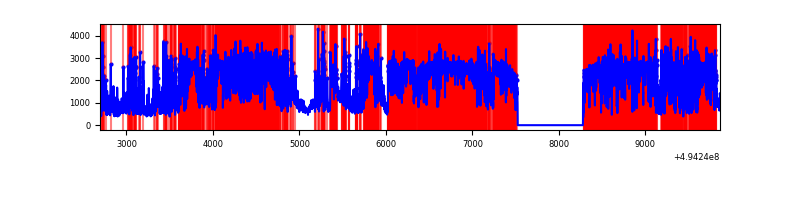 |
Top three noisy pixels from each quadrant. If the there are fewer than three noisy pixels in the level2.evt file, extra rows are filled as -1
| Pixel properties | Quadrant properties | ||||||
|---|---|---|---|---|---|---|---|
| Quadrant | DetID | PixID | Counts | Sigma | Mean | Median | Sigma |
| A | 3 | 63 | 9324880 | 75769.17 | 492 | 480 | 123.1 |
| A | 3 | 78 | 885187 | 7189.04 | 492 | 480 | 123.1 |
| A | 15 | 174 | 438825 | 3561.95 | 492 | 480 | 123.1 |
| B | 7 | 0 | 259652 | 1735.11 | 695 | 671 | 149.3 |
| B | 5 | 185 | 237022 | 1583.49 | 695 | 671 | 149.3 |
| B | 0 | 171 | 125396 | 835.63 | 695 | 671 | 149.3 |
| C | 1 | 241 | 8144522 | 90668.01 | 323 | 320 | 89.8 |
| C | 15 | 224 | 4227880 | 47064.7 | 323 | 320 | 89.8 |
| C | 10 | 22 | 330789 | 3679.05 | 323 | 320 | 89.8 |
| D | 8 | 176 | 5798284 | 42809.28 | 459 | 437 | 135.4 |
| D | 12 | 34 | 3145032 | 23218.59 | 459 | 437 | 135.4 |
| D | 2 | 37 | 253808 | 1870.8 | 459 | 437 | 135.4 |
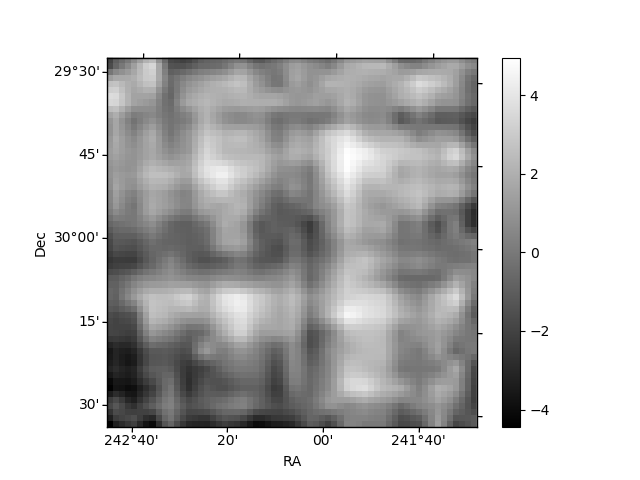
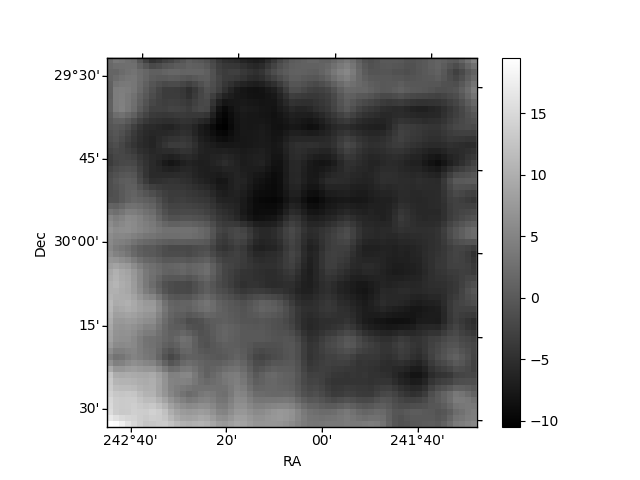
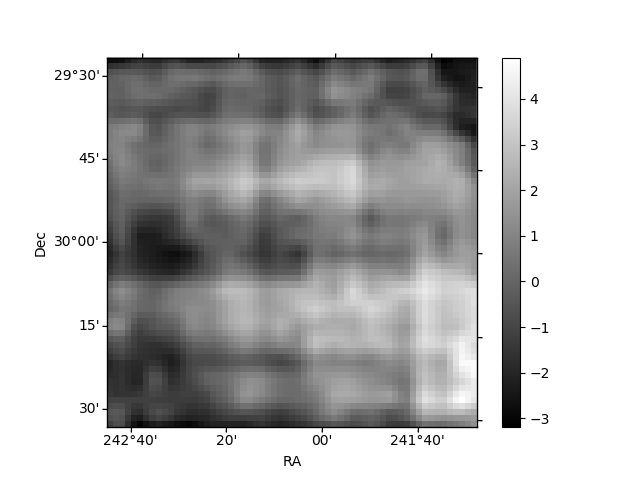
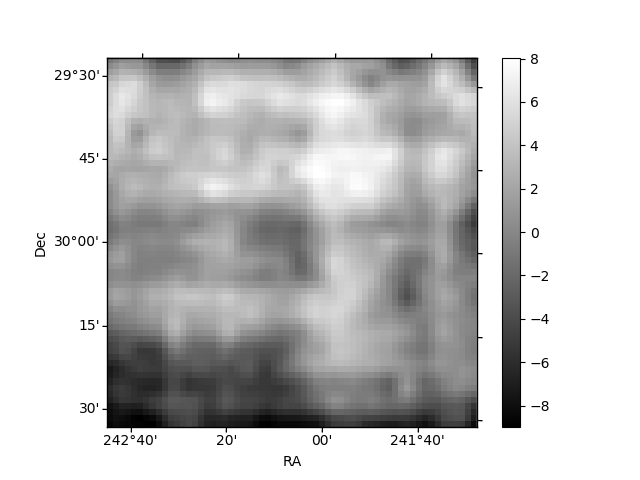
Histogram calculated using DETX and DETY for each event in the final _common_clean file
| Quadrant A | 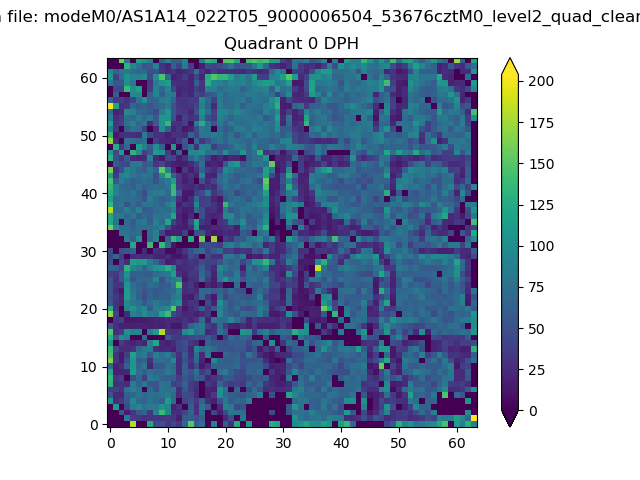 |
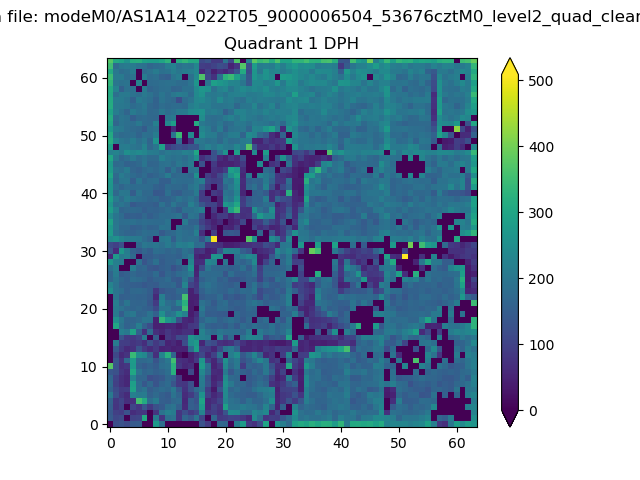 |
Quadrant B |
|---|---|---|---|
| Quadrant D | 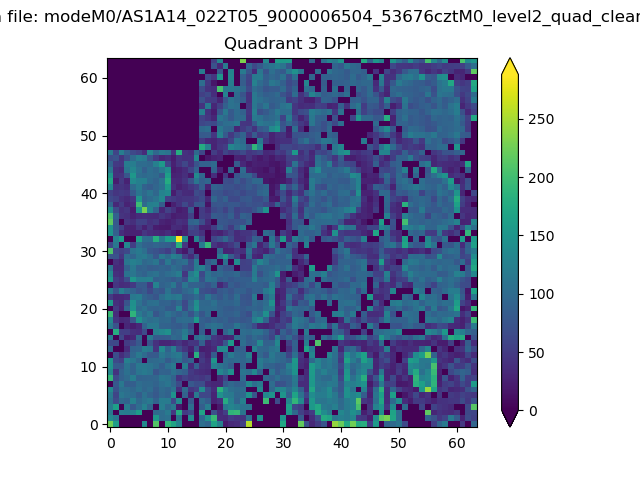 |
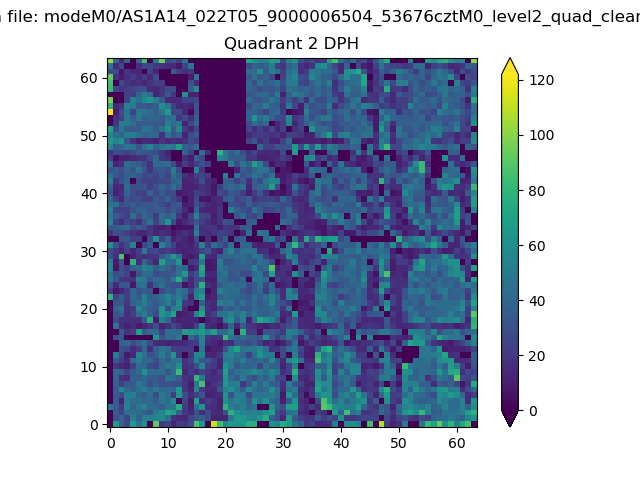 |
Quadrant C |
| Plot type | Count rate plots | Images |
|---|---|---|
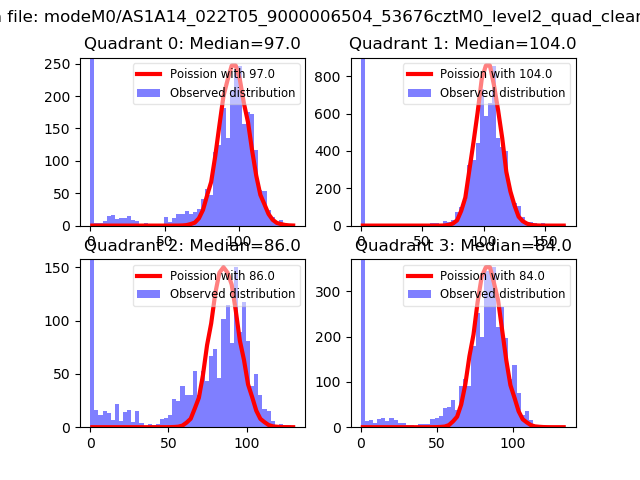
| Comparison with Poisson distribution Blue bars denote a histogram of data divided into 1 sec bins. Red curve is a Poisson curve with rate = median count rate of data. |
 |
 |
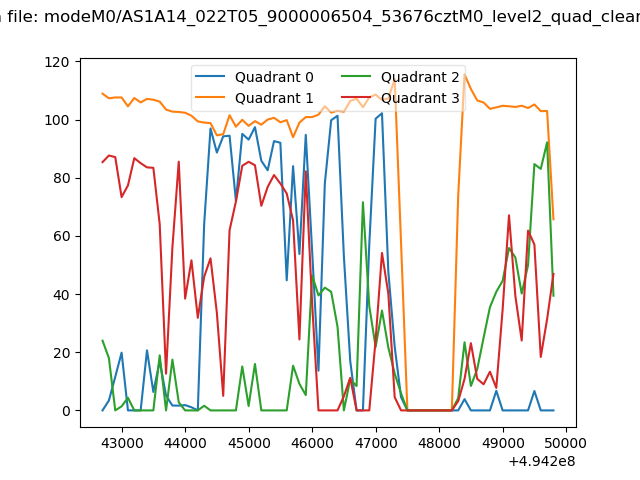
| Quadrant-wise count rates Data is divided into 100 sec bins |
 |
|
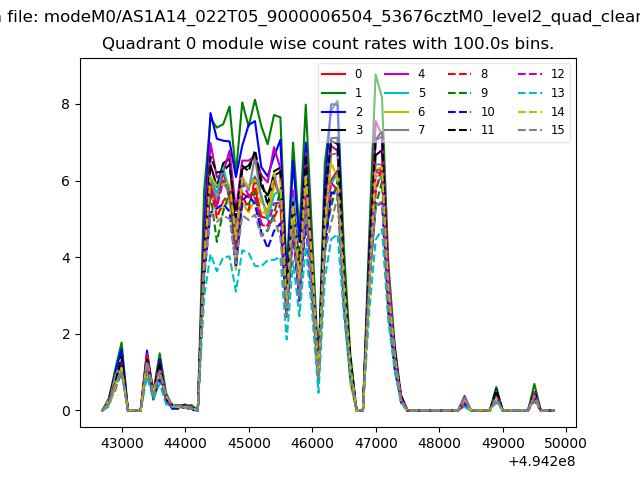
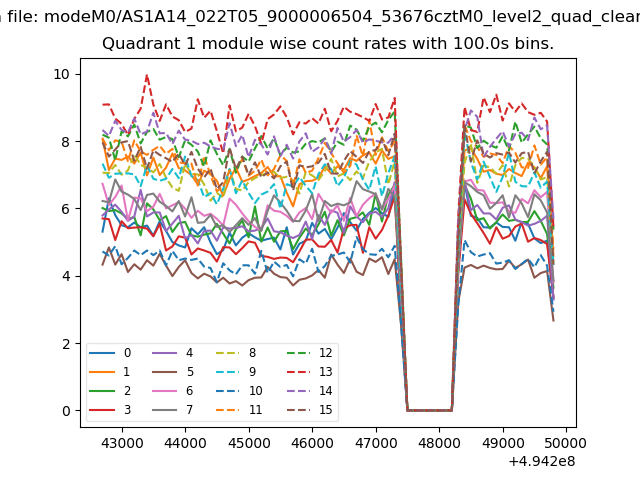
| Module-wise count rates for Quadrant A Data is divided into 100 sec bins |
 |
 |
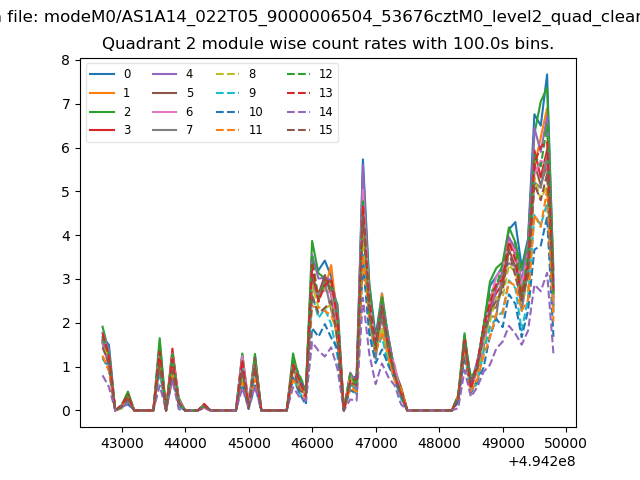
| Module-wise count rates for Quadrant B Data is divided into 100 sec bins |
 |
 |
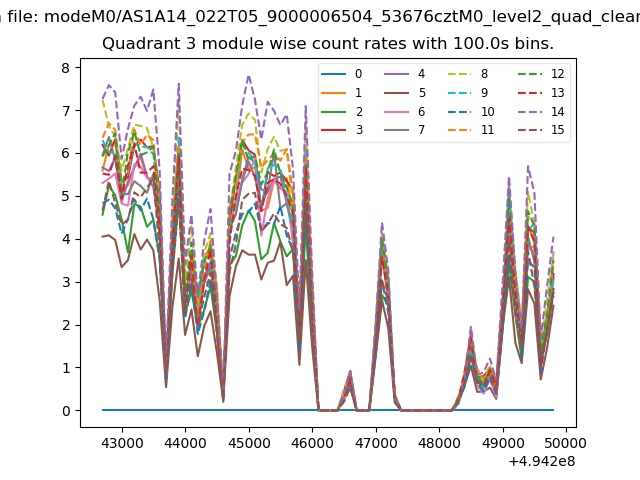
| Module-wise count rates for Quadrant C Data is divided into 100 sec bins |
 |
 |
| Module-wise count rates for Quadrant D Data is divided into 100 sec bins |
 |
 |
| Parameter | Plot |
|---|---|
| CZT HV Monitor | 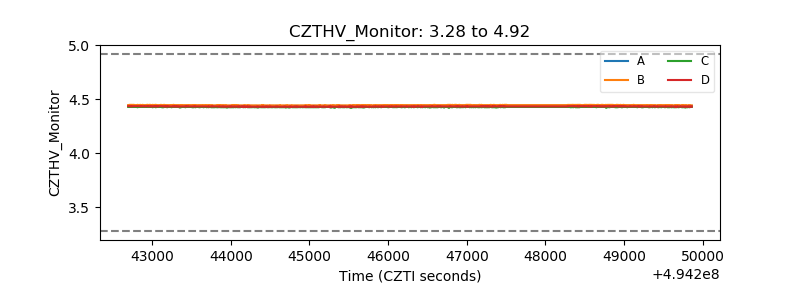 |
| D_VDD | 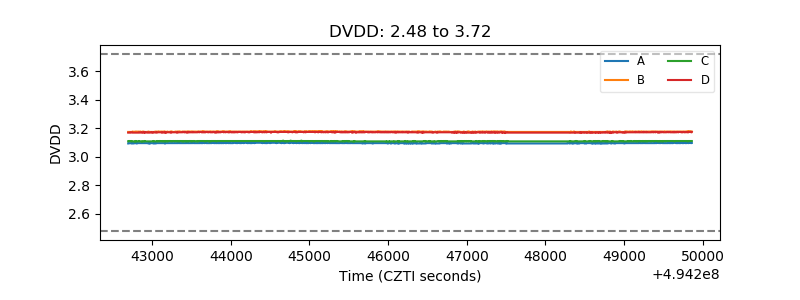 |
| Temperature 1 | 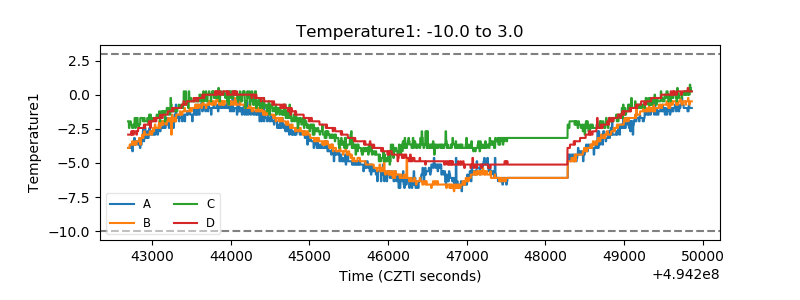 |
| Veto HV Monitor |  |
| Veto LLD | 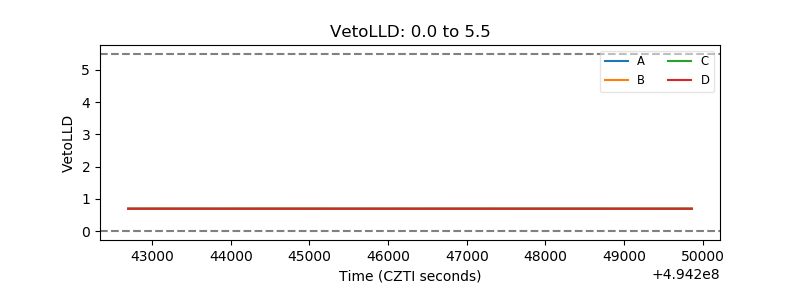 |
| Alpha Counter | 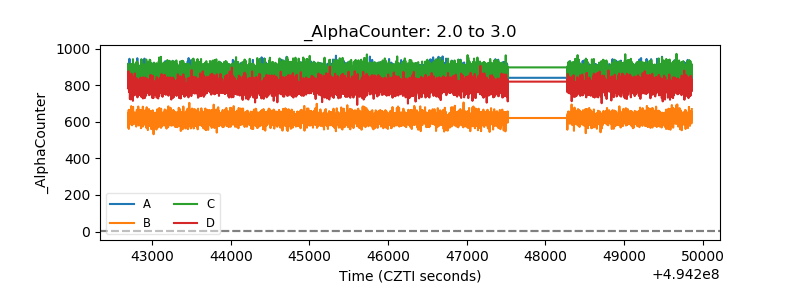 |
| _CPM_Rate |  |
| CZT Counter | 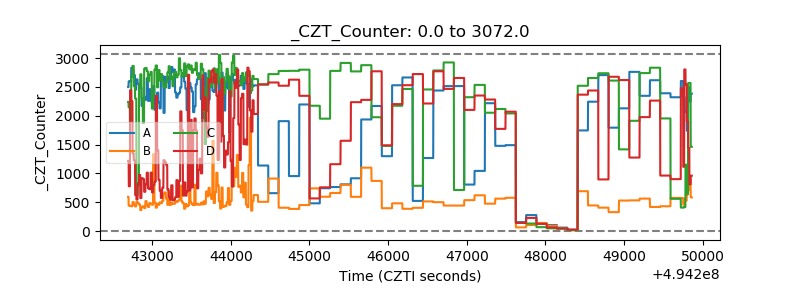 |
| +2.5 Volts monitor |  |
| +5 Volts monitor |  |
| _ROLL_ROT | 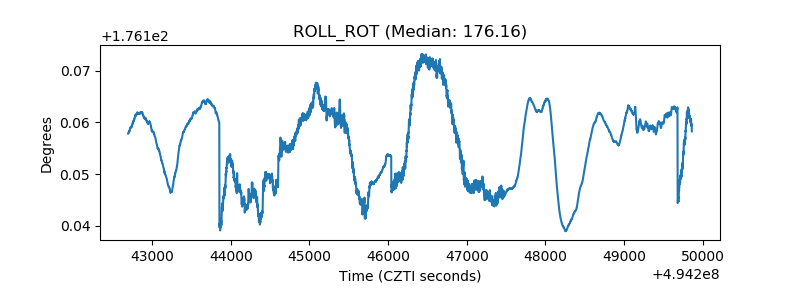 |
| _Roll_DEC | 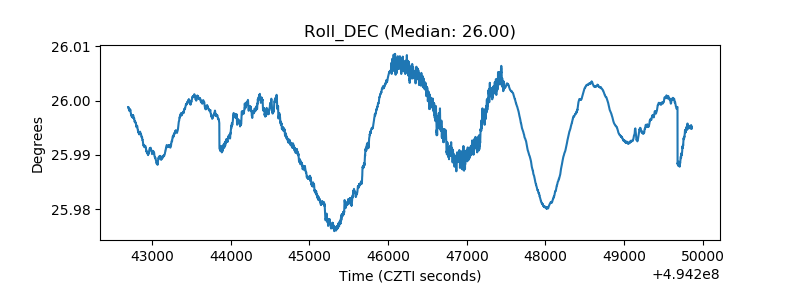 |
| _Roll_RA | 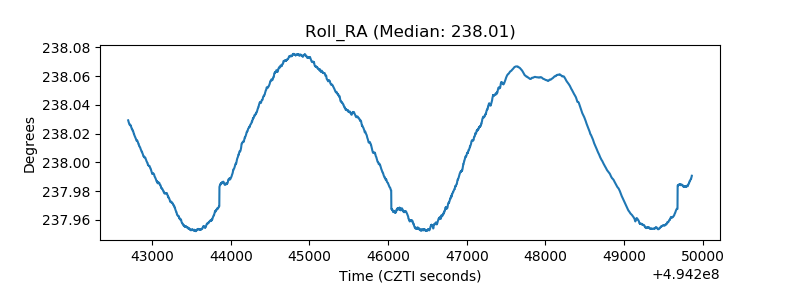 |
| Veto Counter | 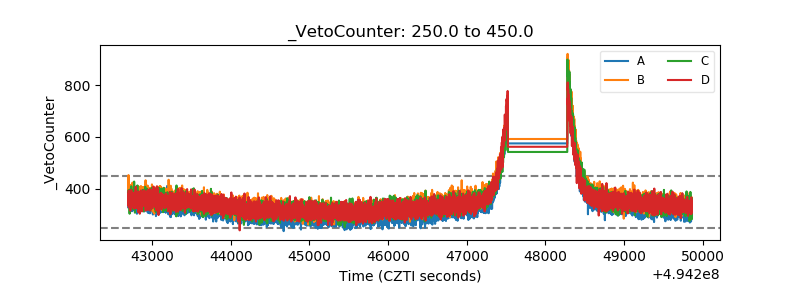 |