| Param | Original file | Final file |
|---|---|---|
| Filename | modeM0/AS1A14_022T05_9000006504_53678cztM0_level2.fits | modeM0/AS1A14_022T05_9000006504_53678cztM0_level2_quad_clean.evt |
| Size (bytes) | 1,109,145,600 | 83,730,240 |
| Size | 1.0 GB | 79.9 MB |
| Events in quadrant A | 14,488,909 | 322,474 |
| Events in quadrant B | 4,870,473 | 754,954 |
| Events in quadrant C | 14,176,977 | 322,955 |
| Events in quadrant D | 6,942,547 | 612,832 |
| Mode SS | |||
|---|---|---|---|
| Quadrant | BADHDUFLAG | Total packets | Discarded packets |
| A | 0 | 150 | 0 |
| B | 0 | 150 | 0 |
| C | 0 | 150 | 0 |
| D | 0 | 150 | 0 |
| Mode M0 | |||
|---|---|---|---|
| Quadrant | BADHDUFLAG | Total packets | Discarded packets |
| A | 0 | 48218 | 7 |
| B | 0 | 19574 | 0 |
| C | 0 | 47265 | 0 |
| D | 0 | 25755 | 0 |
| Quadrant | Total seconds | Saturated seconds | Saturation percentage |
|---|---|---|---|
| A | 7493 | 4441 | 59.268651% |
| B | 7493 | 176 | 2.348859% |
| C | 7493 | 4399 | 58.708128% |
| D | 7493 | 550 | 7.340184% |
Noise dominated data is calculated using 1-second bins in cleaned event files. If a bin has >2000 counts, and if more than 50% of those come from <1% of pixels, then it is considered to be noise-dominated and hence unusable.
| Quadrant | # 1 sec bins | Bins with >0 counts | Bins with >2000 counts | High rate bins dominated by noise | Noise dominated (total time) | Noise dominated (detector-on time) | Marked lightcurve |
|---|---|---|---|---|---|---|---|
| A | 7492 | 7492 | 4209 | 4209 | 56.18% | 56.18% | 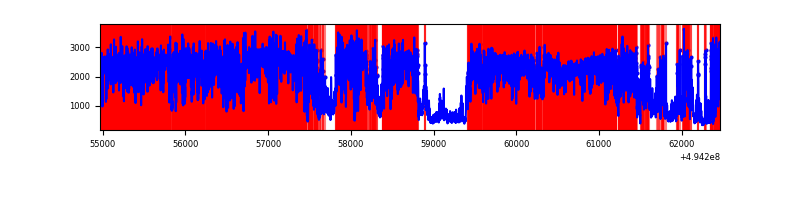 |
| B | 7493 | 7493 | 95 | 95 | 1.27% | 1.27% | 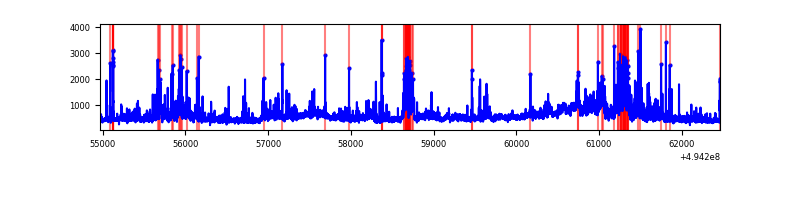 |
| C | 7492 | 7492 | 3933 | 3933 | 52.50% | 52.50% | 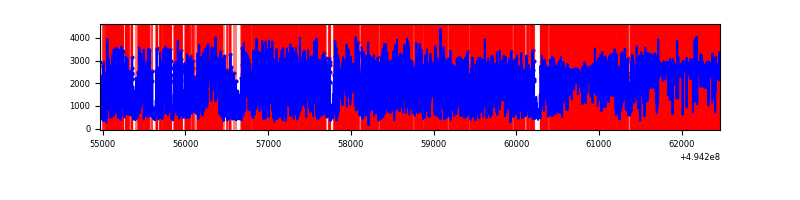 |
| D | 7493 | 7493 | 575 | 575 | 7.67% | 7.67% | 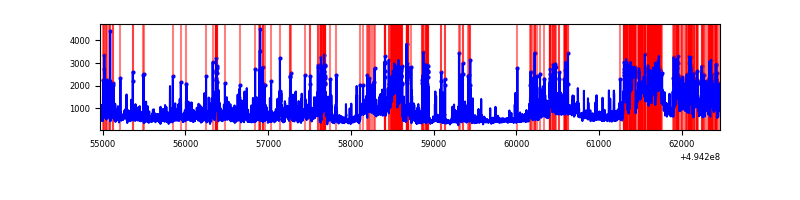 |
Top three noisy pixels from each quadrant. If the there are fewer than three noisy pixels in the level2.evt file, extra rows are filled as -1
| Pixel properties | Quadrant properties | ||||||
|---|---|---|---|---|---|---|---|
| Quadrant | DetID | PixID | Counts | Sigma | Mean | Median | Sigma |
| A | 3 | 63 | 9423577 | 60487.71 | 612 | 596 | 155.8 |
| A | 3 | 78 | 811633 | 5206.18 | 612 | 596 | 155.8 |
| A | 14 | 254 | 715198 | 4587.15 | 612 | 596 | 155.8 |
| B | 7 | 0 | 664593 | 3870.94 | 802 | 775 | 171.5 |
| B | 5 | 185 | 399326 | 2324.08 | 802 | 775 | 171.5 |
| B | 0 | 171 | 184991 | 1074.22 | 802 | 775 | 171.5 |
| C | 15 | 224 | 7374449 | 47568.67 | 554 | 549 | 155.0 |
| C | 1 | 241 | 1578305 | 10178.03 | 554 | 549 | 155.0 |
| C | 2 | 12 | 915216 | 5900.47 | 554 | 549 | 155.0 |
| D | 12 | 34 | 1577120 | 7034.78 | 774 | 738 | 224.1 |
| D | 10 | 172 | 1244878 | 5552.12 | 774 | 738 | 224.1 |
| D | 7 | 70 | 373479 | 1663.4 | 774 | 738 | 224.1 |
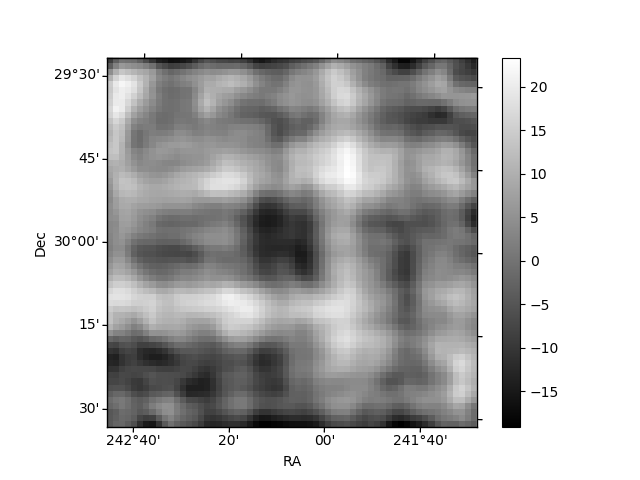
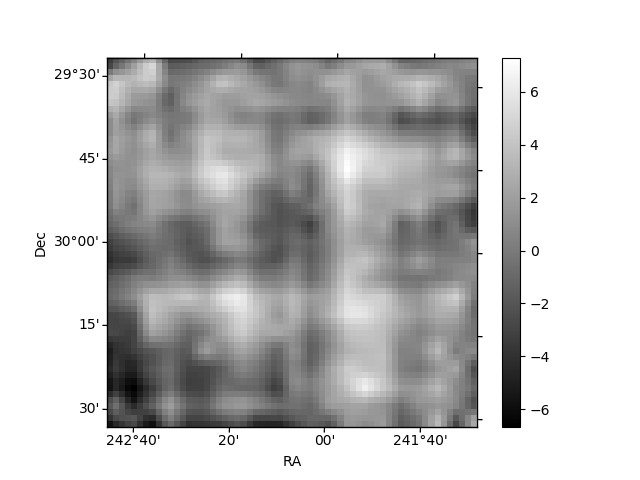
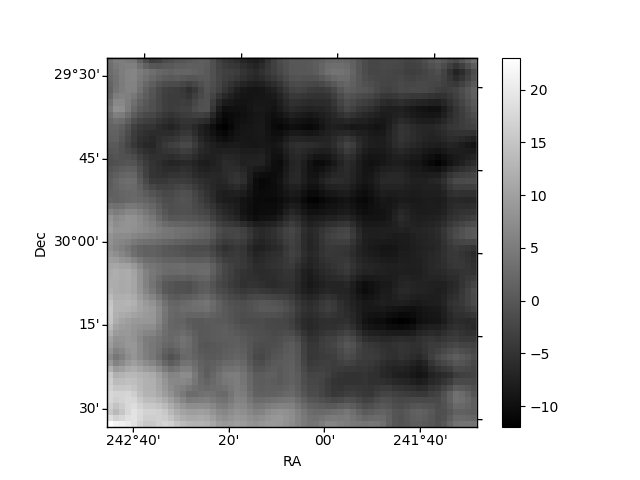
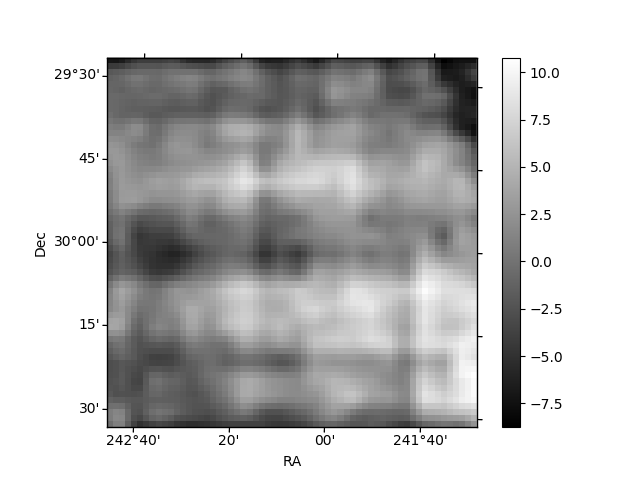
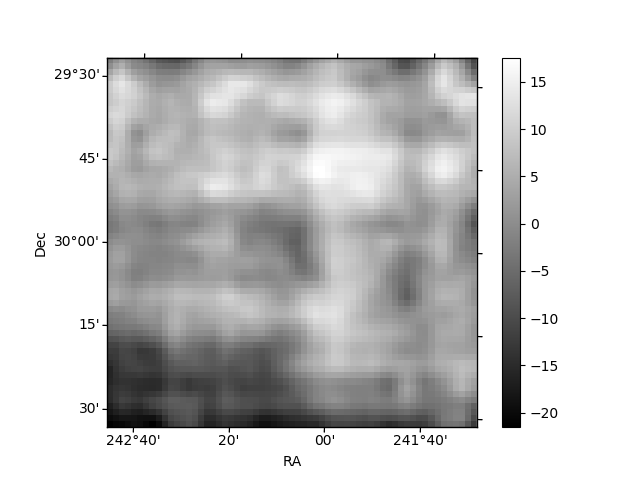
Histogram calculated using DETX and DETY for each event in the final _common_clean file
| Quadrant A | 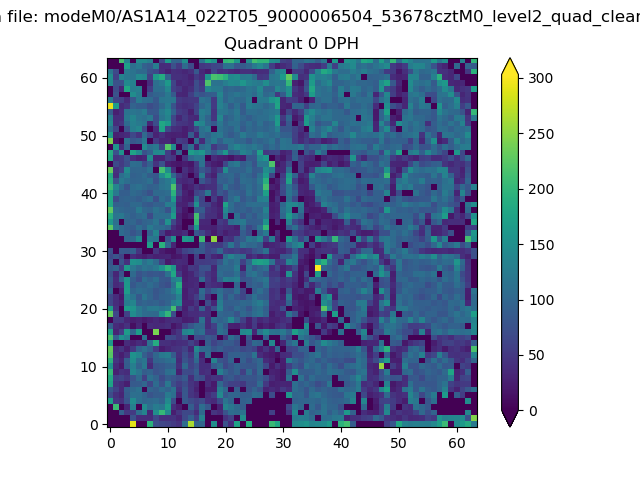 |
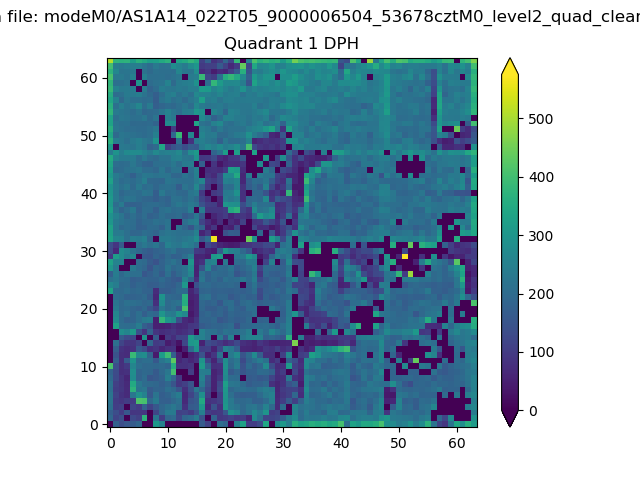 |
Quadrant B |
|---|---|---|---|
| Quadrant D | 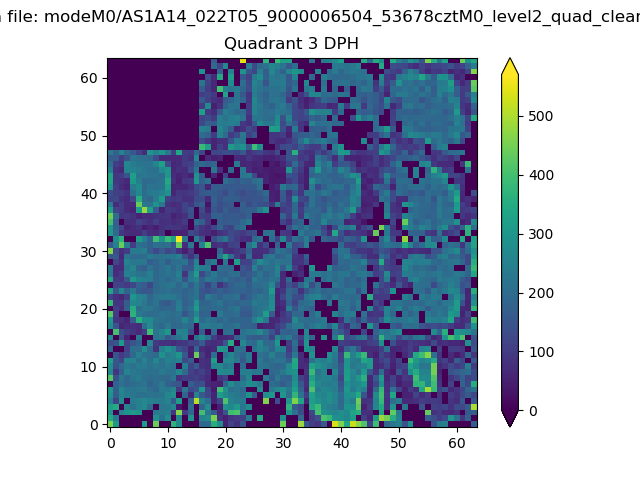 |
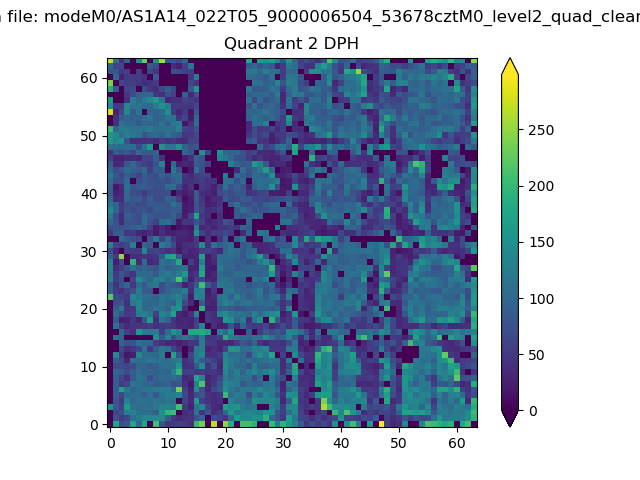 |
Quadrant C |
| Plot type | Count rate plots | Images |
|---|---|---|
| Comparison with Poisson distribution Blue bars denote a histogram of data divided into 1 sec bins. Red curve is a Poisson curve with rate = median count rate of data. |
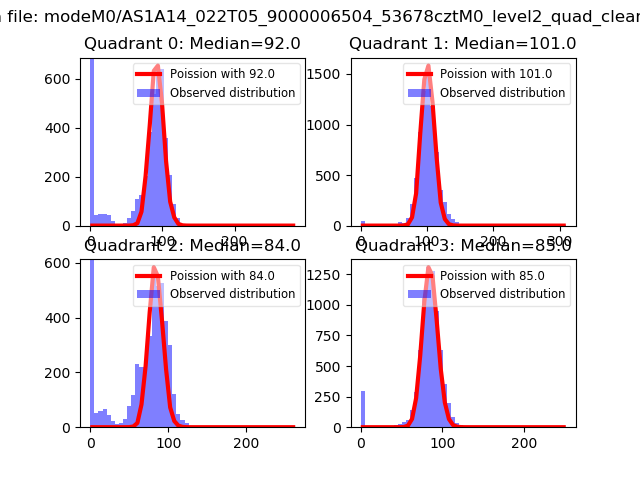 |
 |
| Quadrant-wise count rates Data is divided into 100 sec bins |
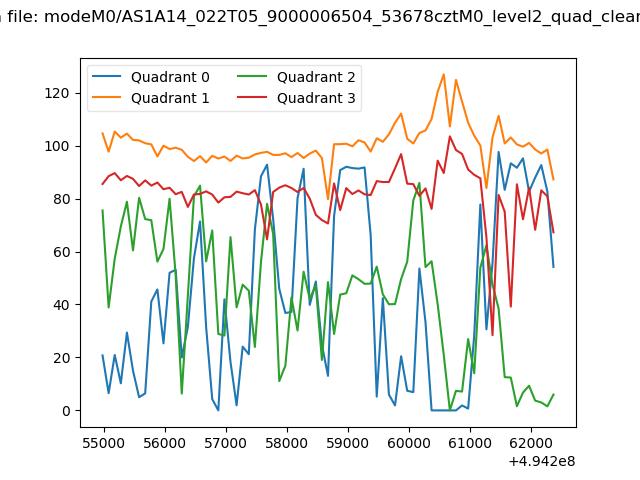 |
|
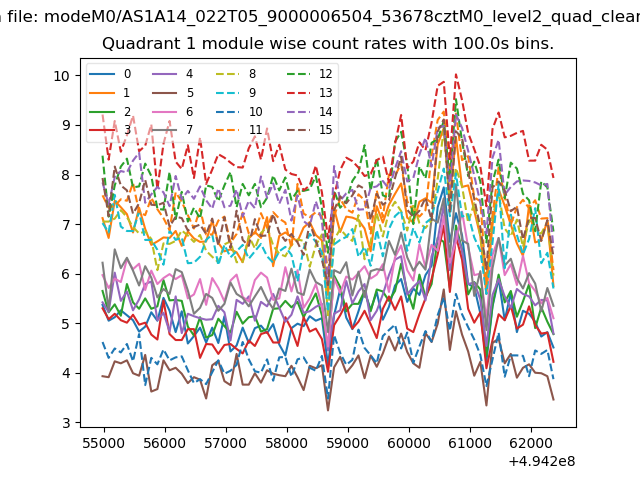
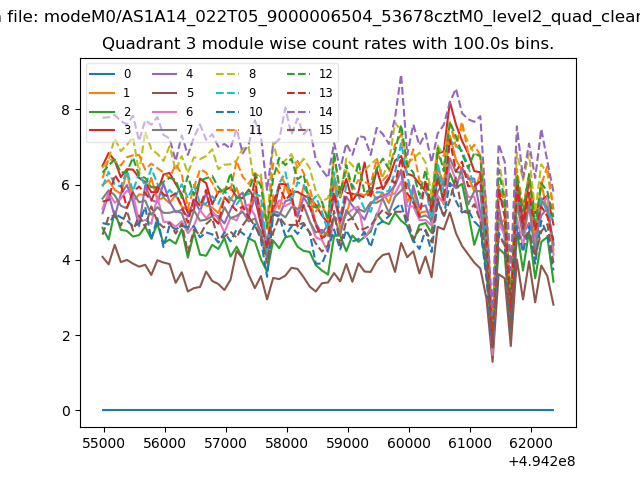
| Module-wise count rates for Quadrant A Data is divided into 100 sec bins |
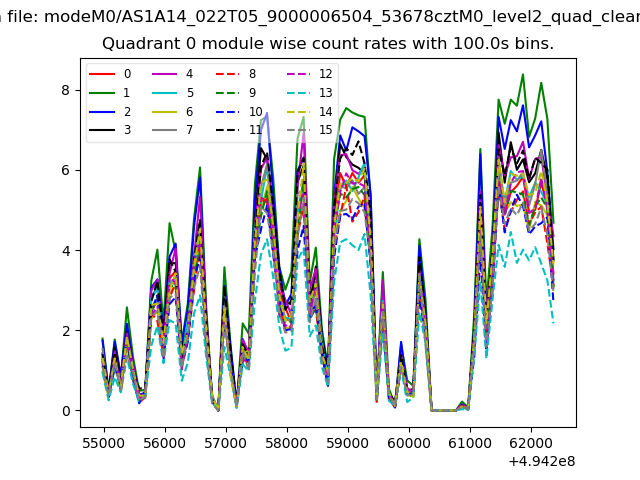 |
 |
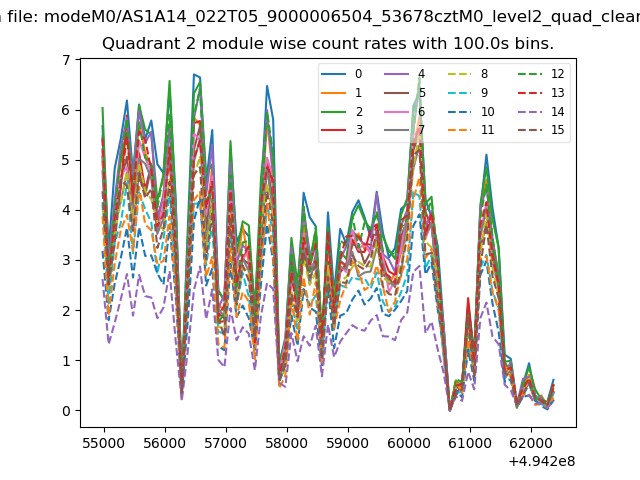
| Module-wise count rates for Quadrant B Data is divided into 100 sec bins |
 |
 |
| Module-wise count rates for Quadrant C Data is divided into 100 sec bins |
 |
 |
| Module-wise count rates for Quadrant D Data is divided into 100 sec bins |
 |
 |
| Parameter | Plot |
|---|---|
| CZT HV Monitor | 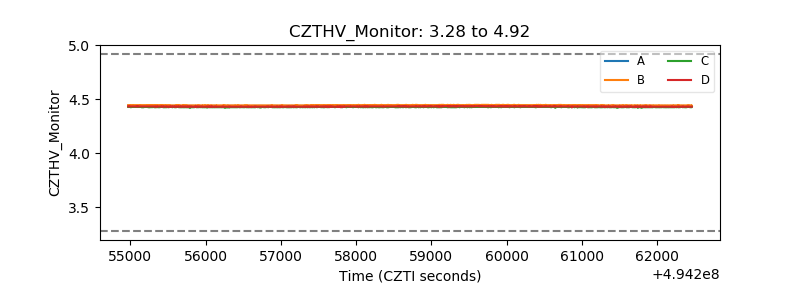 |
| D_VDD | 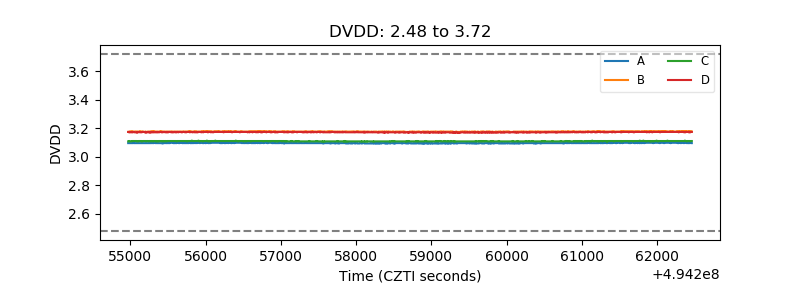 |
| Temperature 1 | 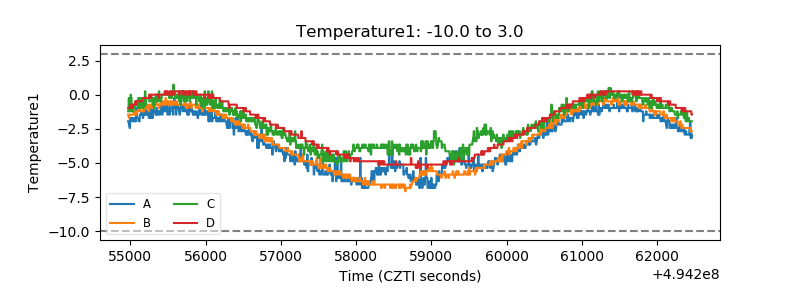 |
| Veto HV Monitor | 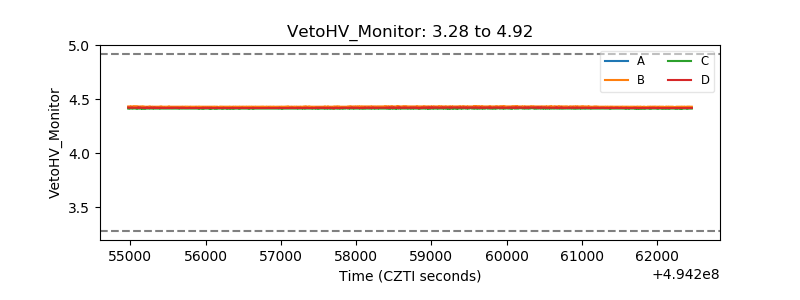 |
| Veto LLD | 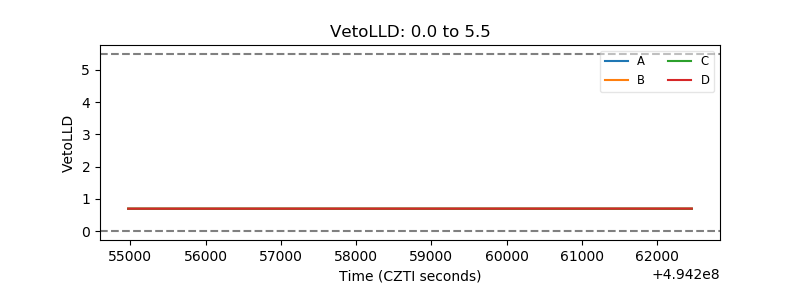 |
| Alpha Counter | 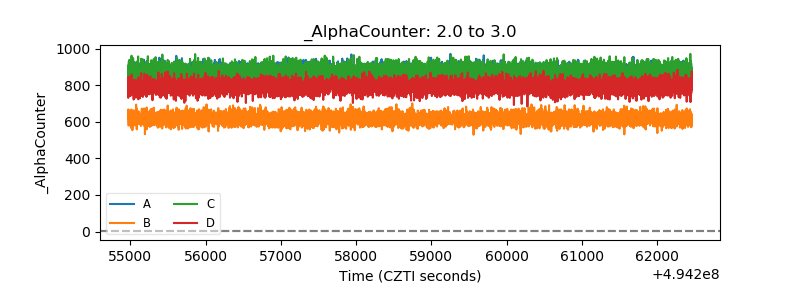 |
| _CPM_Rate | 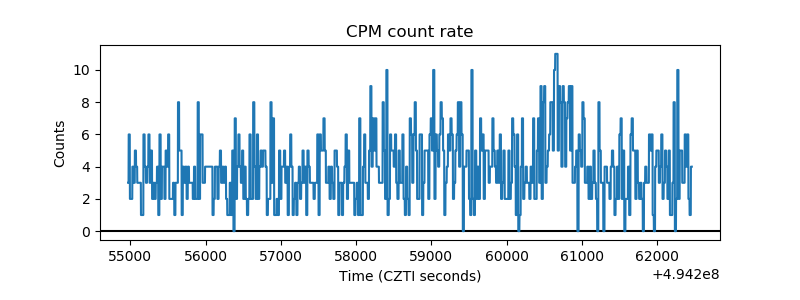 |
| CZT Counter | 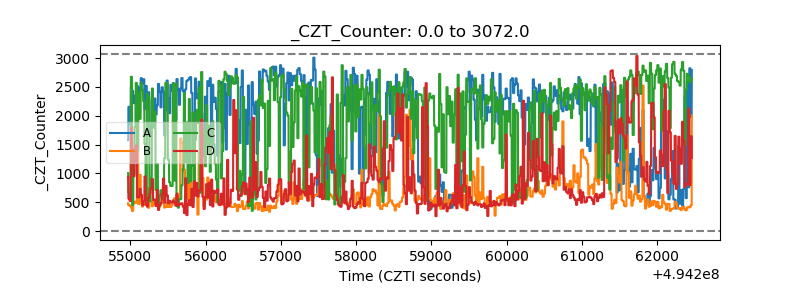 |
| +2.5 Volts monitor | 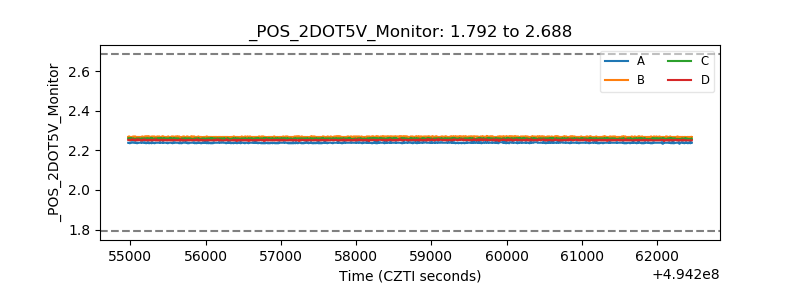 |
| +5 Volts monitor | 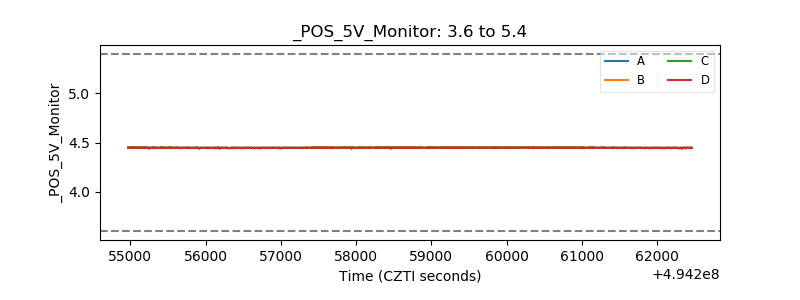 |
| _ROLL_ROT | 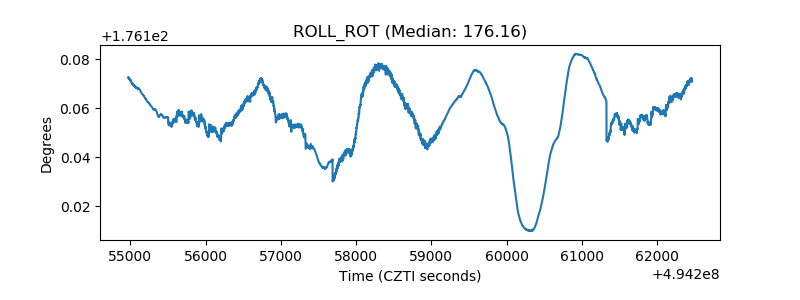 |
| _Roll_DEC | 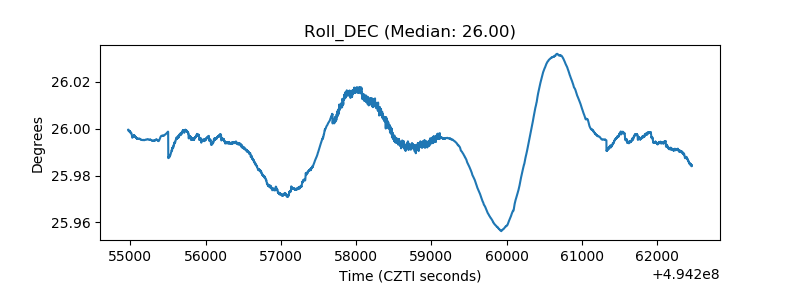 |
| _Roll_RA | 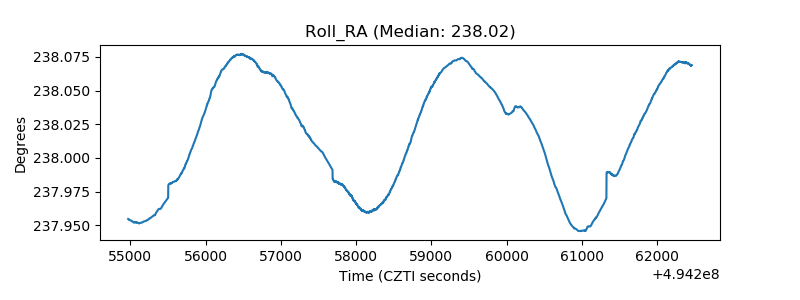 |
| Veto Counter | 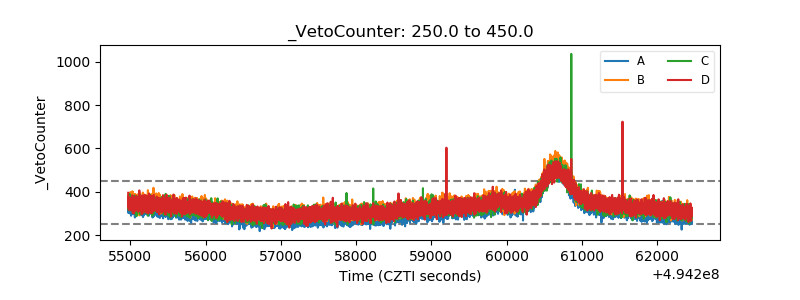 |