| Param | Original file | Final file |
|---|---|---|
| Filename | modeM0/AS1A14_022T05_9000006504_53679cztM0_level2.fits | modeM0/AS1A14_022T05_9000006504_53679cztM0_level2_quad_clean.evt |
| Size (bytes) | 1,171,886,400 | 79,430,400 |
| Size | 1.1 GB | 75.8 MB |
| Events in quadrant A | 13,187,651 | 387,104 |
| Events in quadrant B | 4,687,449 | 758,181 |
| Events in quadrant C | 17,337,473 | 145,221 |
| Events in quadrant D | 7,589,488 | 593,001 |
| Mode SS | |||
|---|---|---|---|
| Quadrant | BADHDUFLAG | Total packets | Discarded packets |
| A | 0 | 150 | 0 |
| B | 0 | 150 | 0 |
| C | 0 | 150 | 0 |
| D | 0 | 150 | 0 |
| Mode M0 | |||
|---|---|---|---|
| Quadrant | BADHDUFLAG | Total packets | Discarded packets |
| A | 0 | 44422 | 0 |
| B | 0 | 19056 | 0 |
| C | 0 | 56579 | 0 |
| D | 0 | 27753 | 0 |
| Quadrant | Total seconds | Saturated seconds | Saturation percentage |
|---|---|---|---|
| A | 7487 | 3786 | 50.567651% |
| B | 7488 | 106 | 1.415598% |
| C | 7488 | 6137 | 81.957799% |
| D | 7488 | 771 | 10.296474% |
Noise dominated data is calculated using 1-second bins in cleaned event files. If a bin has >2000 counts, and if more than 50% of those come from <1% of pixels, then it is considered to be noise-dominated and hence unusable.
| Quadrant | # 1 sec bins | Bins with >0 counts | Bins with >2000 counts | High rate bins dominated by noise | Noise dominated (total time) | Noise dominated (detector-on time) | Marked lightcurve |
|---|---|---|---|---|---|---|---|
| A | 7486 | 7486 | 3448 | 3448 | 46.06% | 46.06% | 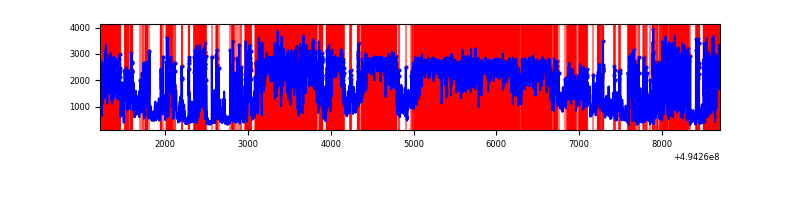 |
| B | 7488 | 7488 | 63 | 63 | 0.84% | 0.84% | 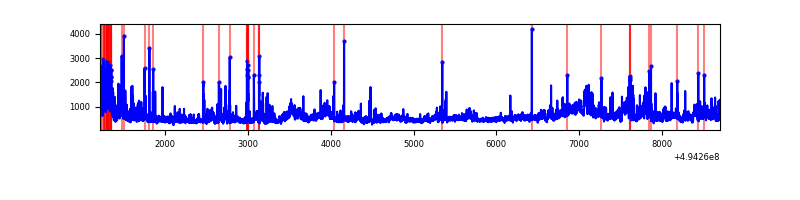 |
| C | 7487 | 7487 | 5674 | 5674 | 75.78% | 75.78% | 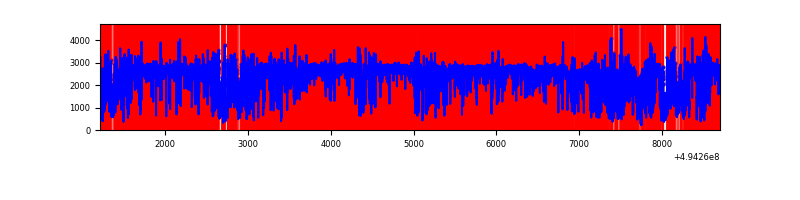 |
| D | 7488 | 7488 | 802 | 802 | 10.71% | 10.71% | 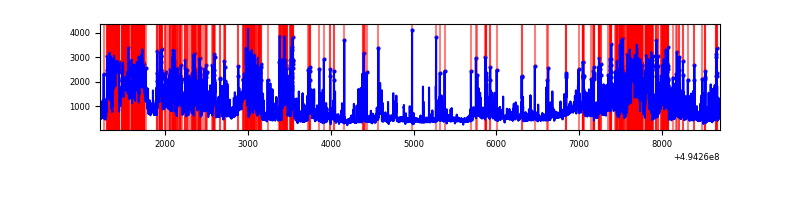 |
Top three noisy pixels from each quadrant. If the there are fewer than three noisy pixels in the level2.evt file, extra rows are filled as -1
| Pixel properties | Quadrant properties | ||||||
|---|---|---|---|---|---|---|---|
| Quadrant | DetID | PixID | Counts | Sigma | Mean | Median | Sigma |
| A | 3 | 63 | 7653771 | 48015.8 | 634 | 620 | 159.4 |
| A | 14 | 254 | 1382103 | 8667.41 | 634 | 620 | 159.4 |
| A | 3 | 78 | 829349 | 5199.44 | 634 | 620 | 159.4 |
| B | 7 | 0 | 874515 | 5132.36 | 790 | 762 | 170.2 |
| B | 5 | 185 | 176227 | 1030.67 | 790 | 762 | 170.2 |
| B | 7 | 252 | 95127 | 554.29 | 790 | 762 | 170.2 |
| C | 1 | 241 | 8688286 | 83760.72 | 370 | 368 | 103.7 |
| C | 15 | 224 | 4970073 | 47913.21 | 370 | 368 | 103.7 |
| C | 13 | 3 | 775147 | 7469.69 | 370 | 368 | 103.7 |
| D | 10 | 172 | 1827328 | 8410.03 | 753 | 720 | 217.2 |
| D | 12 | 34 | 1607409 | 7397.48 | 753 | 720 | 217.2 |
| D | 7 | 70 | 425218 | 1954.46 | 753 | 720 | 217.2 |
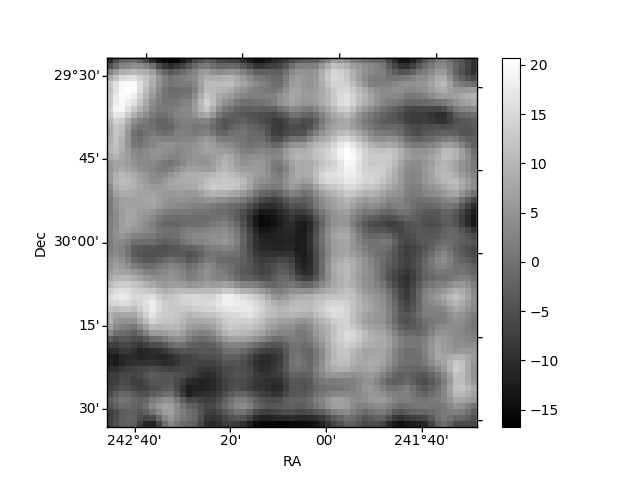
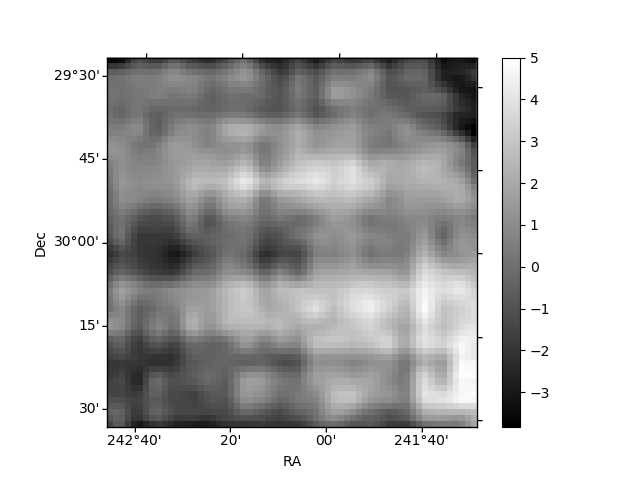
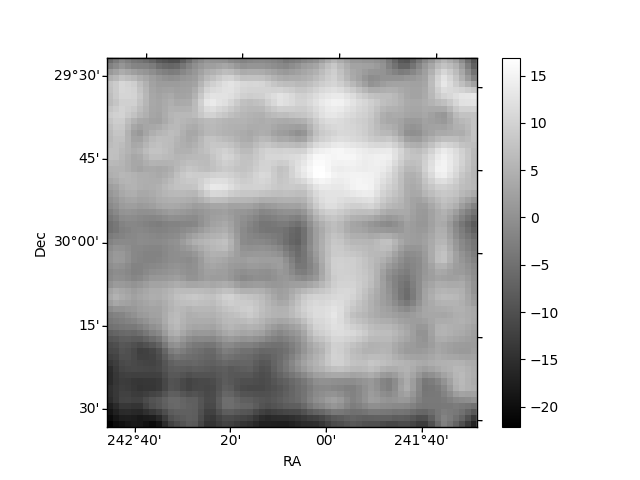
Histogram calculated using DETX and DETY for each event in the final _common_clean file
| Quadrant A | 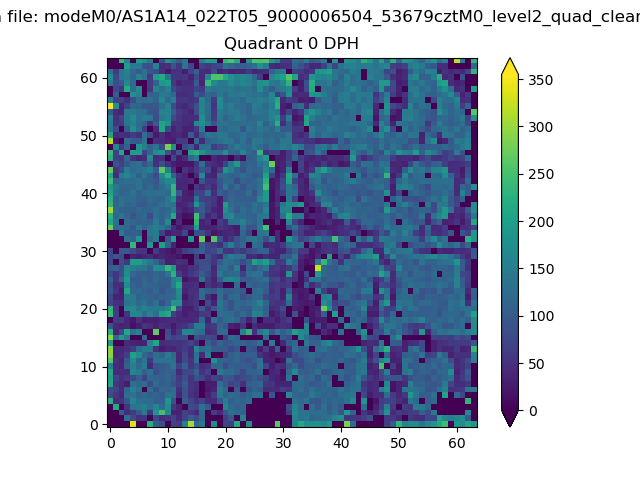 |
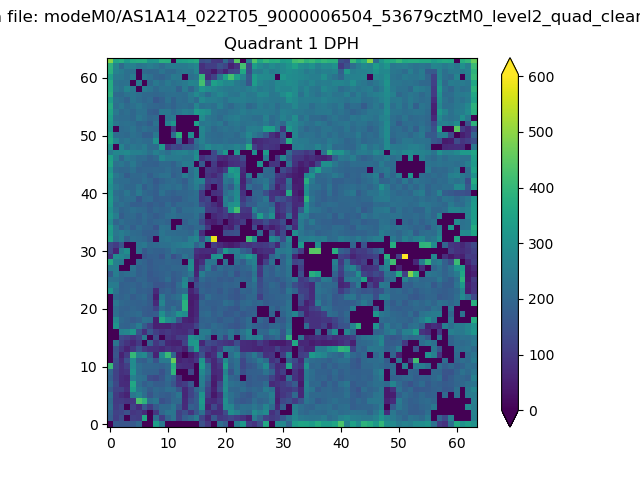 |
Quadrant B |
|---|---|---|---|
| Quadrant D | 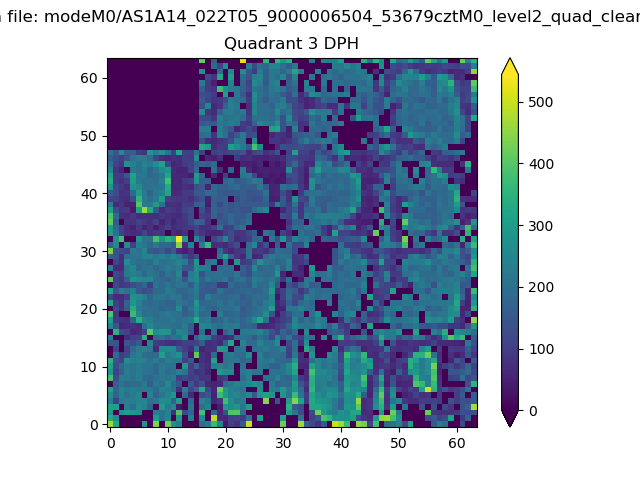 |
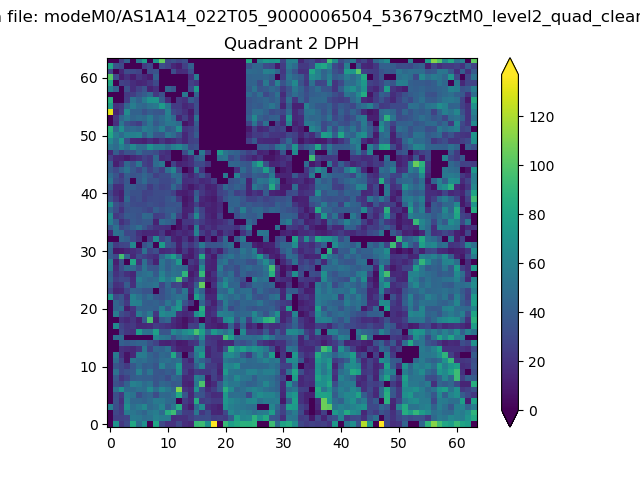 |
Quadrant C |
| Plot type | Count rate plots | Images |
|---|---|---|
| Comparison with Poisson distribution Blue bars denote a histogram of data divided into 1 sec bins. Red curve is a Poisson curve with rate = median count rate of data. |
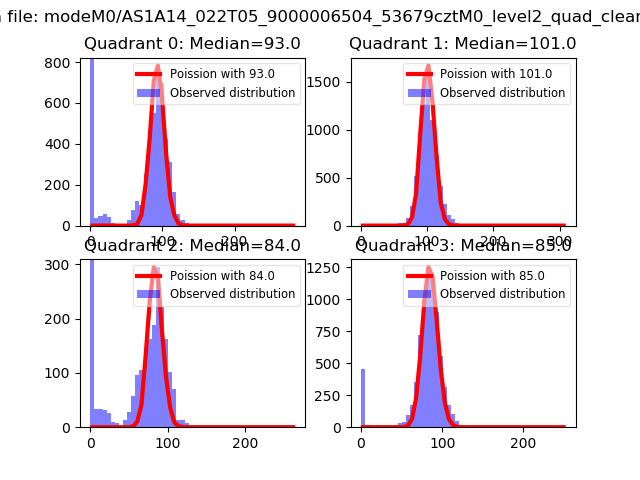 |
 |
| Quadrant-wise count rates Data is divided into 100 sec bins |
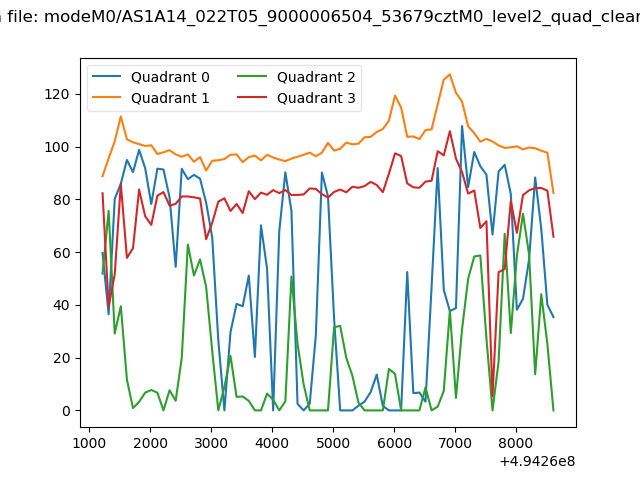 |
|
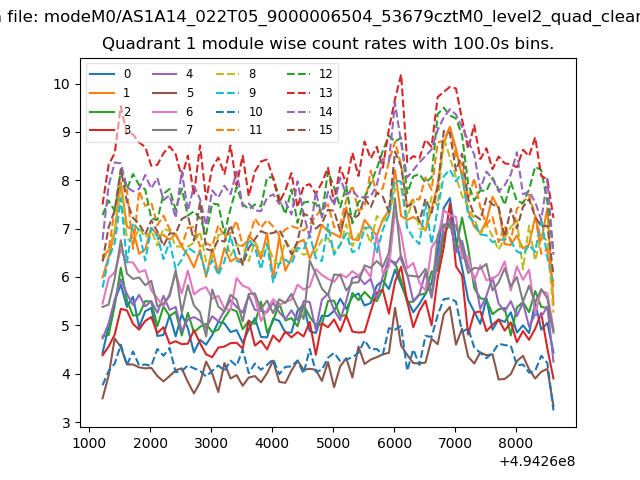
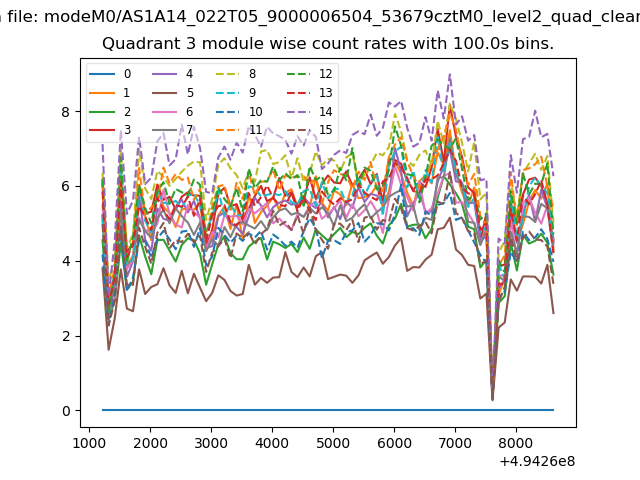
| Module-wise count rates for Quadrant A Data is divided into 100 sec bins |
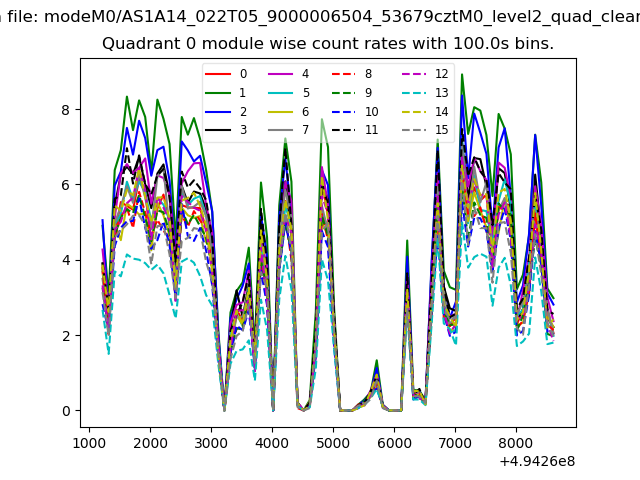 |
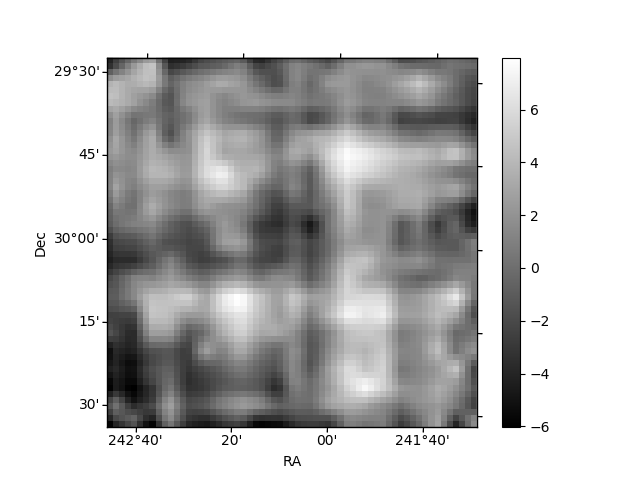 |
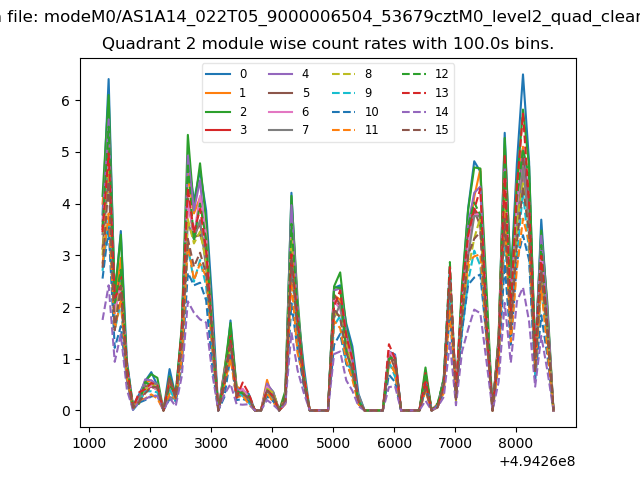
| Module-wise count rates for Quadrant B Data is divided into 100 sec bins |
 |
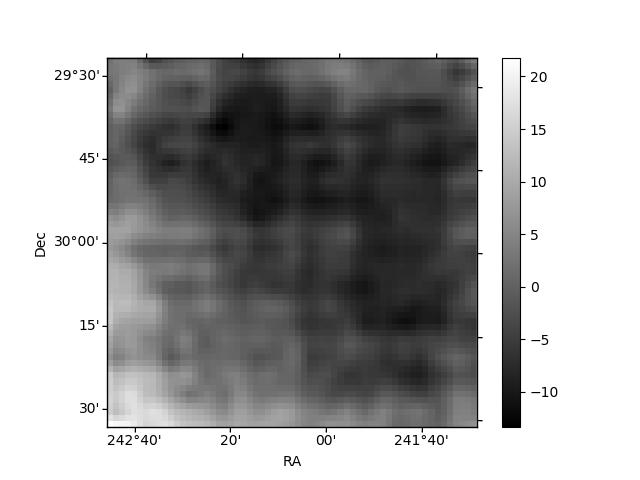 |
| Module-wise count rates for Quadrant C Data is divided into 100 sec bins |
 |
 |
| Module-wise count rates for Quadrant D Data is divided into 100 sec bins |
 |
 |
| Parameter | Plot |
|---|---|
| CZT HV Monitor | 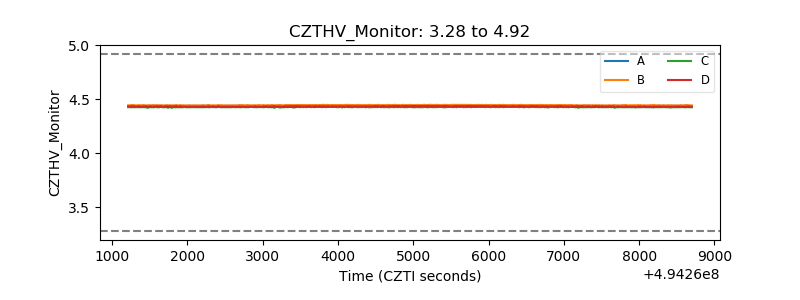 |
| D_VDD | 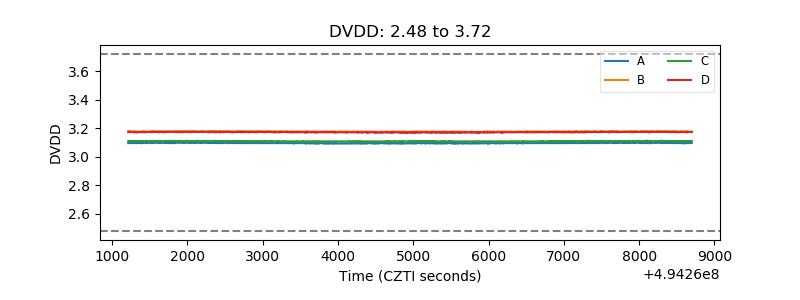 |
| Temperature 1 | 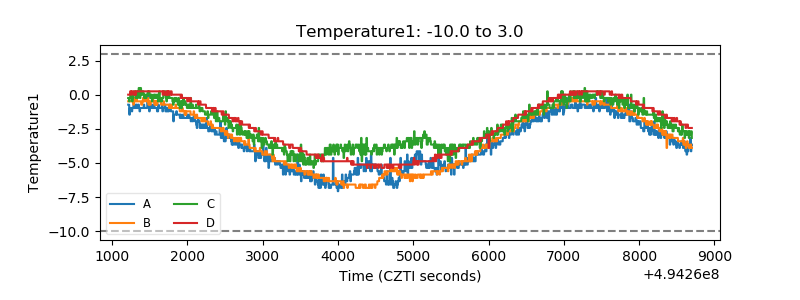 |
| Veto HV Monitor | 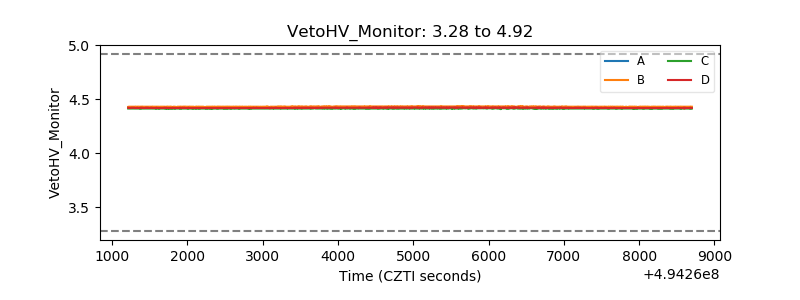 |
| Veto LLD | 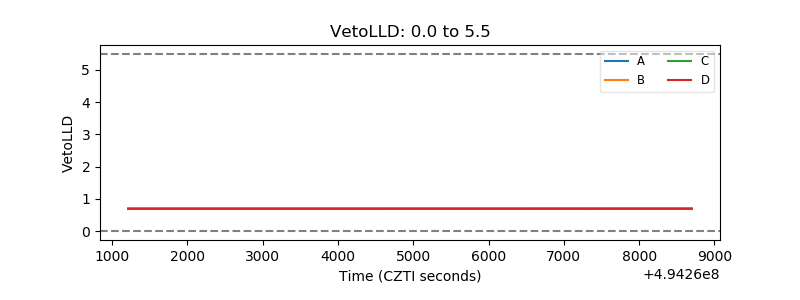 |
| Alpha Counter | 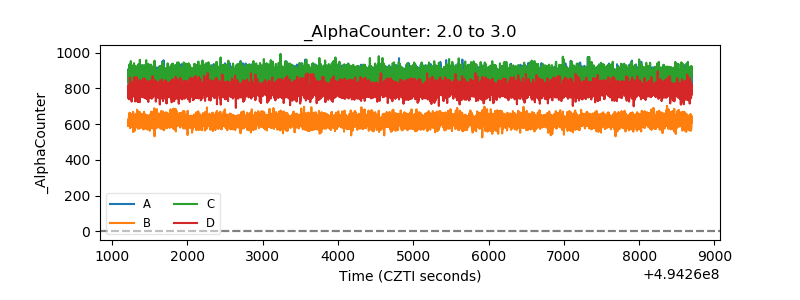 |
| _CPM_Rate | 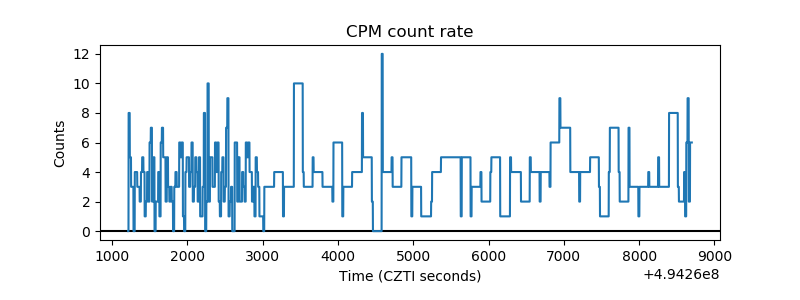 |
| CZT Counter | 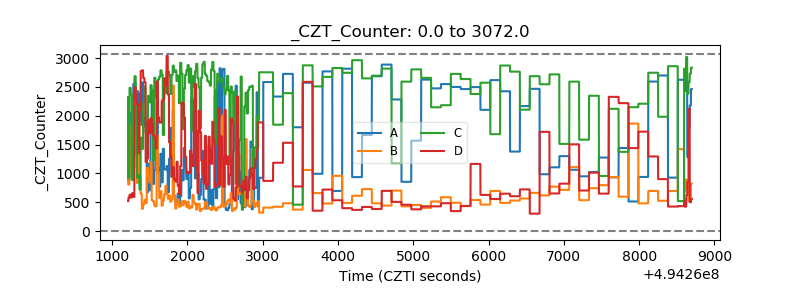 |
| +2.5 Volts monitor |  |
| +5 Volts monitor | 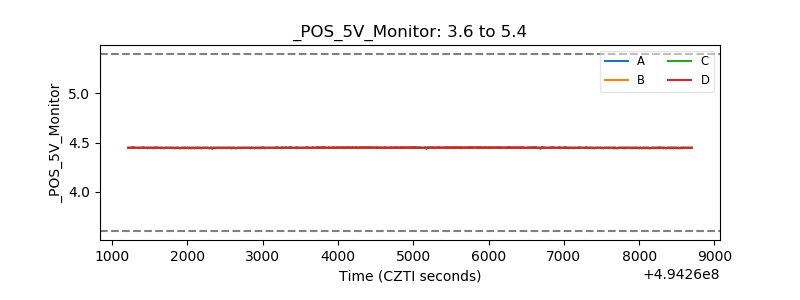 |
| _ROLL_ROT | 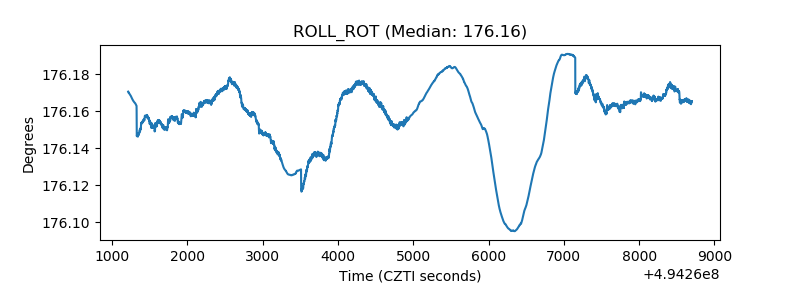 |
| _Roll_DEC | 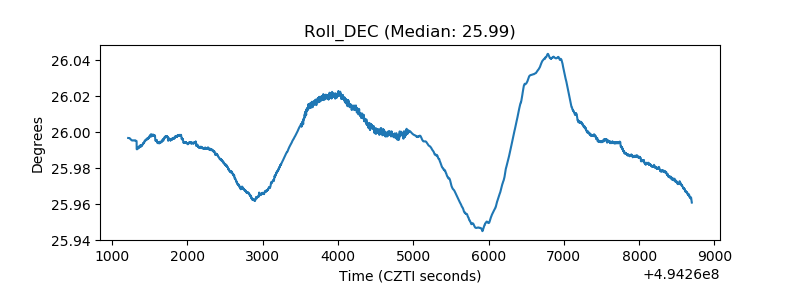 |
| _Roll_RA | 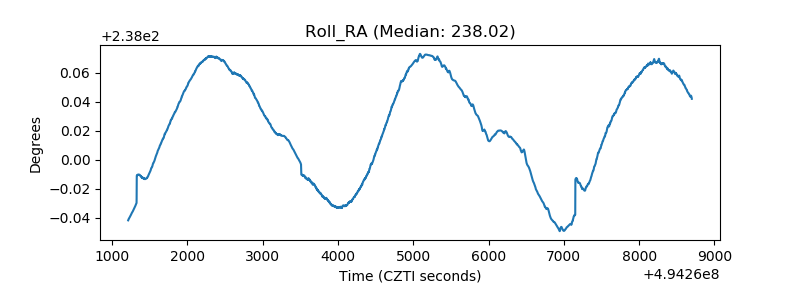 |
| Veto Counter |  |