| Param | Original file | Final file |
|---|---|---|
| Filename | modeM0/AS1A14_022T05_9000006504_53682cztM0_level2.fits | modeM0/AS1A14_022T05_9000006504_53682cztM0_level2_quad_clean.evt |
| Size (bytes) | 2,460,908,160 | 153,181,440 |
| Size | 2.3 GB | 146.1 MB |
| Events in quadrant A | 29,519,983 | 684,379 |
| Events in quadrant B | 11,291,030 | 1,437,696 |
| Events in quadrant C | 34,465,886 | 319,954 |
| Events in quadrant D | 14,655,290 | 1,149,828 |
| Mode SS | |||
|---|---|---|---|
| Quadrant | BADHDUFLAG | Total packets | Discarded packets |
| A | 0 | 306 | 0 |
| B | 0 | 306 | 0 |
| C | 0 | 306 | 0 |
| D | 0 | 306 | 0 |
| Mode M9 | |||
|---|---|---|---|
| Quadrant | BADHDUFLAG | Total packets | Discarded packets |
| A | 0 | 6 | 0 |
| B | 0 | 6 | 0 |
| C | 0 | 6 | 0 |
| D | 0 | 6 | 0 |
| Mode M0 | |||
|---|---|---|---|
| Quadrant | BADHDUFLAG | Total packets | Discarded packets |
| A | 0 | 98138 | 2 |
| B | 0 | 44055 | 2 |
| C | 0 | 112699 | 2 |
| D | 0 | 54171 | 3 |
| Quadrant | Total seconds | Saturated seconds | Saturation percentage |
|---|---|---|---|
| A | 15140 | 8422 | 55.627477% |
| B | 15141 | 795 | 5.250644% |
| C | 15141 | 12051 | 79.591837% |
| D | 15140 | 1711 | 11.301189% |
Noise dominated data is calculated using 1-second bins in cleaned event files. If a bin has >2000 counts, and if more than 50% of those come from <1% of pixels, then it is considered to be noise-dominated and hence unusable.
| Quadrant | # 1 sec bins | Bins with >0 counts | Bins with >2000 counts | High rate bins dominated by noise | Noise dominated (total time) | Noise dominated (detector-on time) | Marked lightcurve |
|---|---|---|---|---|---|---|---|
| A | 15710 | 15141 | 8108 | 8108 | 51.61% | 53.55% | 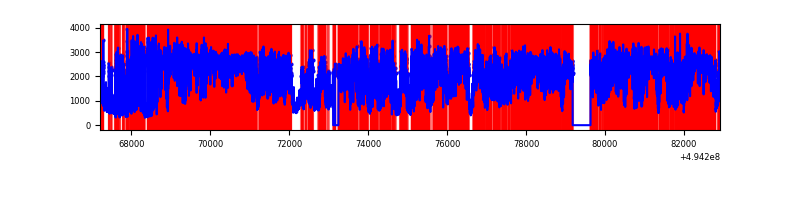 |
| B | 15711 | 15144 | 465 | 465 | 2.96% | 3.07% | 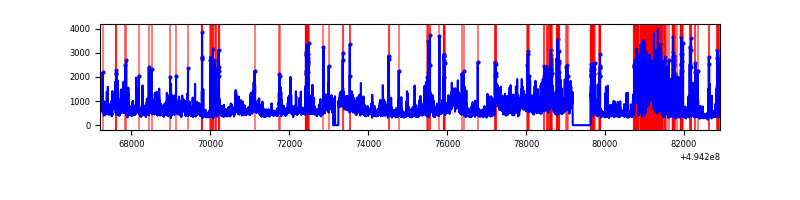 |
| C | 15711 | 15141 | 11345 | 11345 | 72.21% | 74.93% | 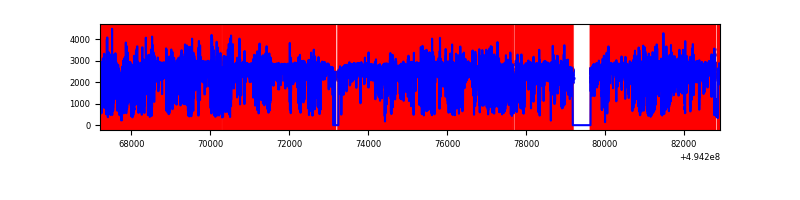 |
| D | 15710 | 15142 | 1664 | 1664 | 10.59% | 10.99% | 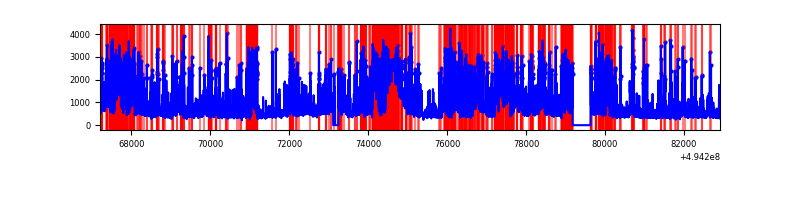 |
Top three noisy pixels from each quadrant. If the there are fewer than three noisy pixels in the level2.evt file, extra rows are filled as -1
| Pixel properties | Quadrant properties | ||||||
|---|---|---|---|---|---|---|---|
| Quadrant | DetID | PixID | Counts | Sigma | Mean | Median | Sigma |
| A | 3 | 63 | 21477296 | 68859.94 | 1257 | 1230 | 311.9 |
| A | 14 | 254 | 991296 | 3174.51 | 1257 | 1230 | 311.9 |
| A | 15 | 174 | 512640 | 1639.76 | 1257 | 1230 | 311.9 |
| B | 7 | 0 | 2146783 | 6516.1 | 1552 | 1497 | 329.2 |
| B | 5 | 185 | 1863283 | 5655.0 | 1552 | 1497 | 329.2 |
| B | 4 | 216 | 224298 | 676.74 | 1552 | 1497 | 329.2 |
| C | 1 | 241 | 16919403 | 78459.18 | 770 | 765 | 215.6 |
| C | 15 | 224 | 9466821 | 43898.27 | 770 | 765 | 215.6 |
| C | 7 | 64 | 2040910 | 9461.05 | 770 | 765 | 215.6 |
| D | 10 | 172 | 3249828 | 7546.25 | 1488 | 1420 | 430.5 |
| D | 12 | 34 | 1808783 | 4198.61 | 1488 | 1420 | 430.5 |
| D | 7 | 70 | 909832 | 2110.3 | 1488 | 1420 | 430.5 |
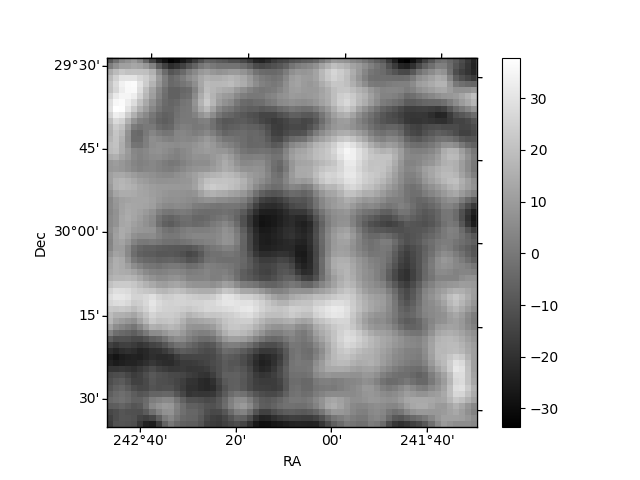
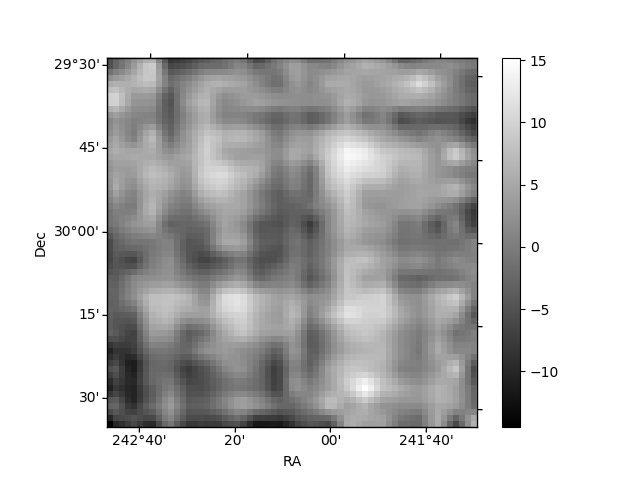
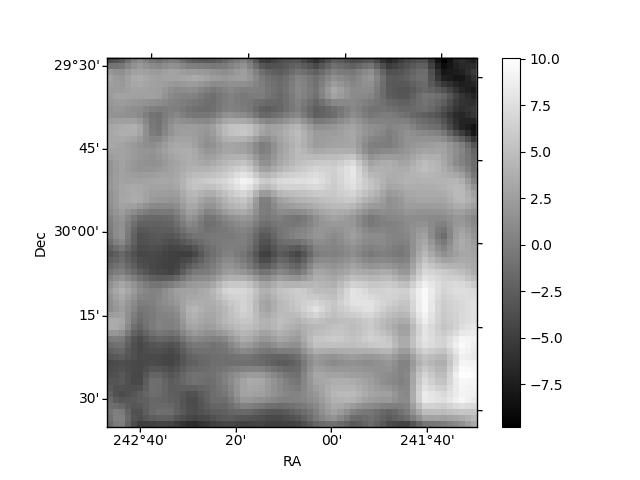
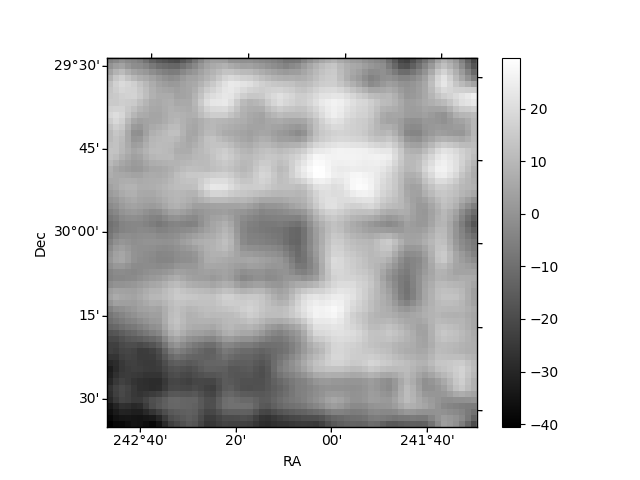
Histogram calculated using DETX and DETY for each event in the final _common_clean file
| Quadrant A | 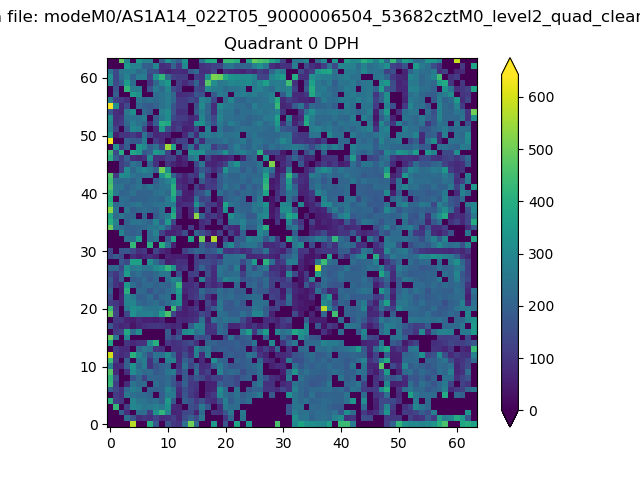 |
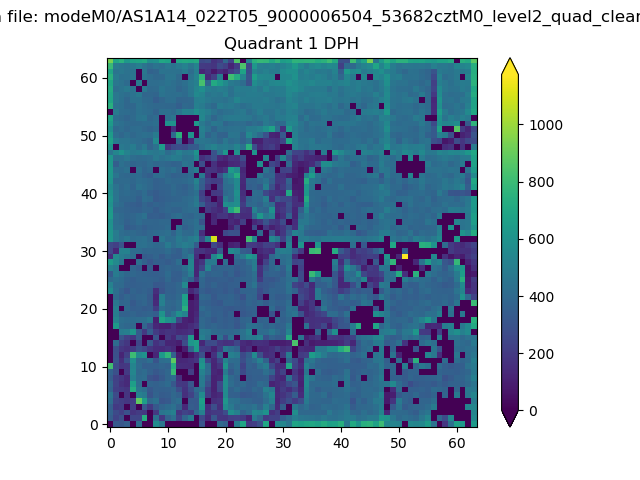 |
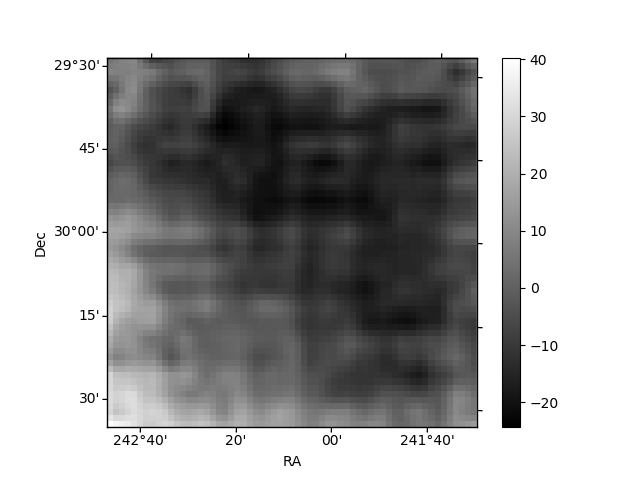
Quadrant B |
|---|---|---|---|
| Quadrant D | 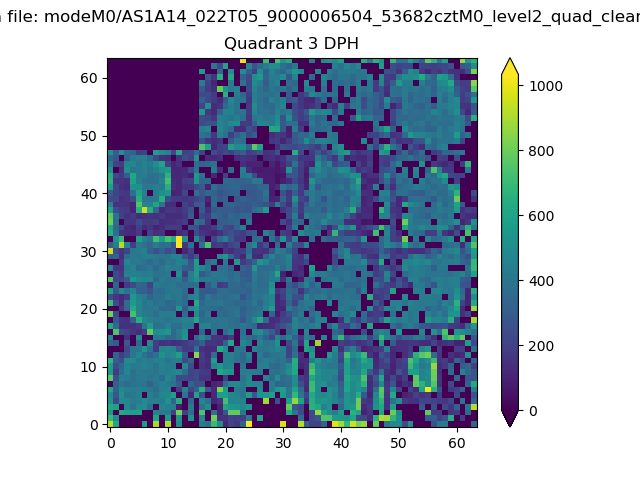 |
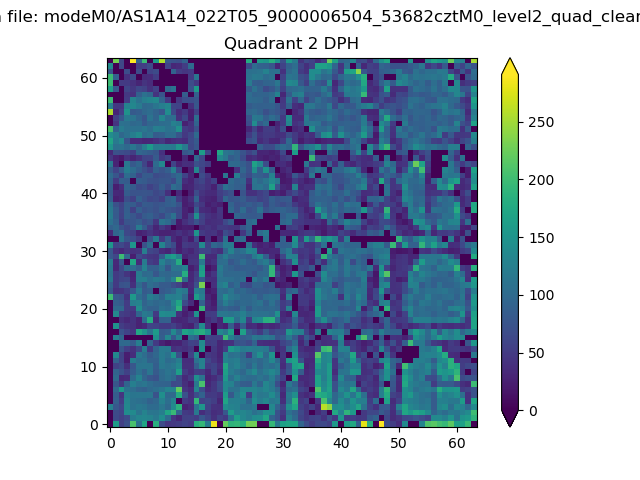 |
Quadrant C |
| Plot type | Count rate plots | Images |
|---|---|---|
| Comparison with Poisson distribution Blue bars denote a histogram of data divided into 1 sec bins. Red curve is a Poisson curve with rate = median count rate of data. |
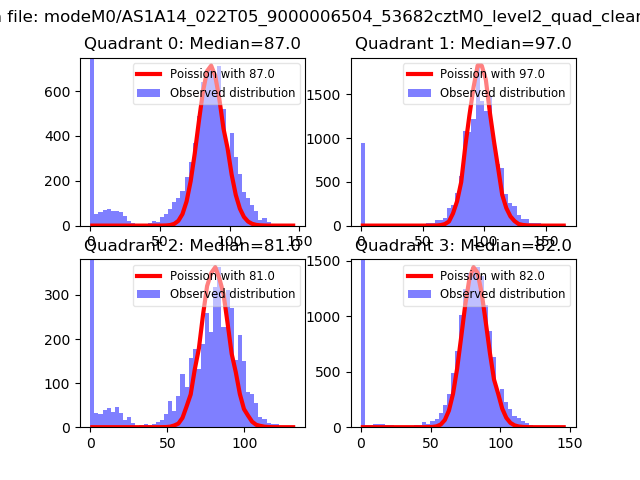 |
 |
| Quadrant-wise count rates Data is divided into 100 sec bins |
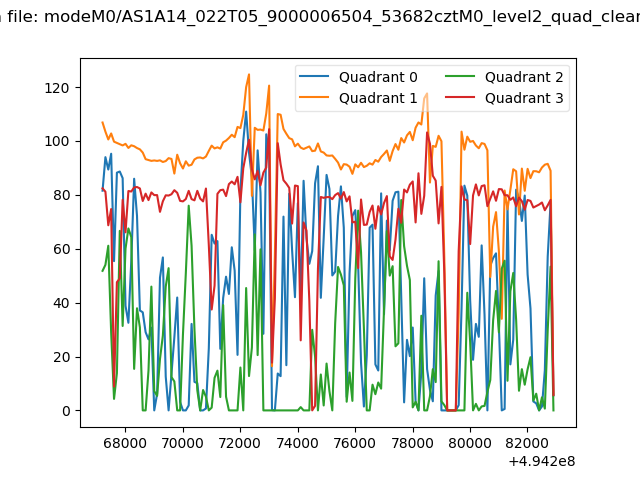 |
|
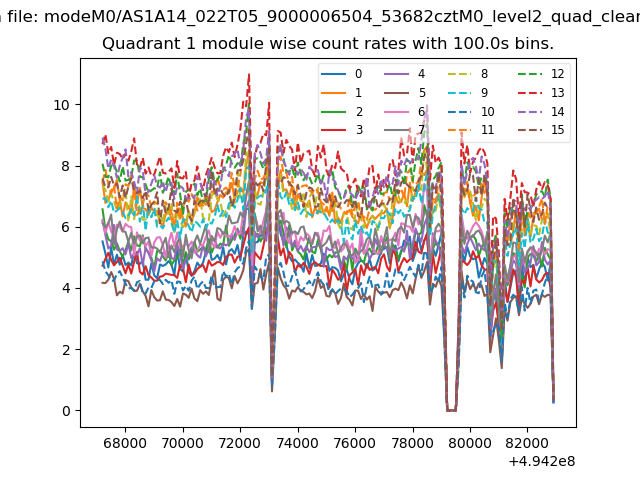
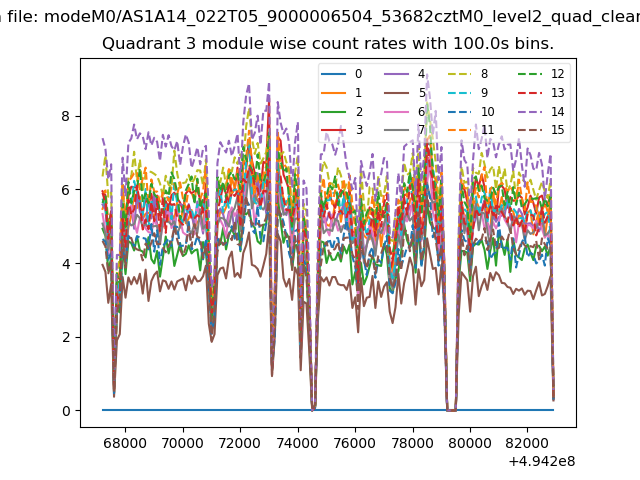
| Module-wise count rates for Quadrant A Data is divided into 100 sec bins |
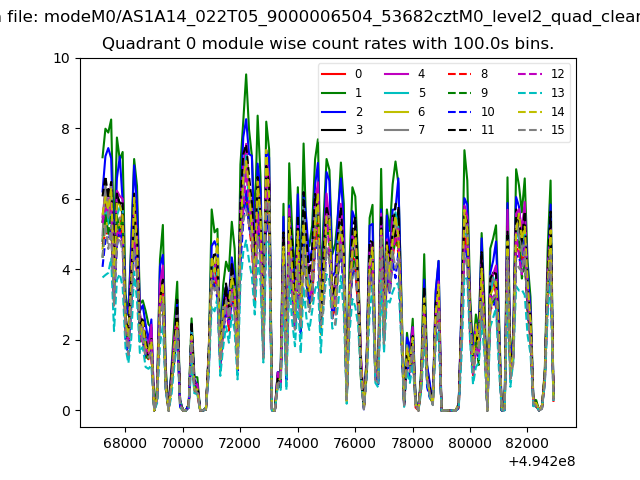 |
 |
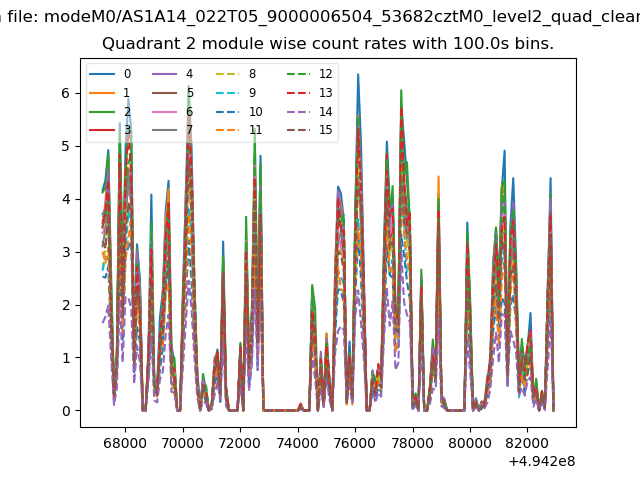
| Module-wise count rates for Quadrant B Data is divided into 100 sec bins |
 |
 |
| Module-wise count rates for Quadrant C Data is divided into 100 sec bins |
 |
 |
| Module-wise count rates for Quadrant D Data is divided into 100 sec bins |
 |
 |
| Parameter | Plot |
|---|---|
| CZT HV Monitor | 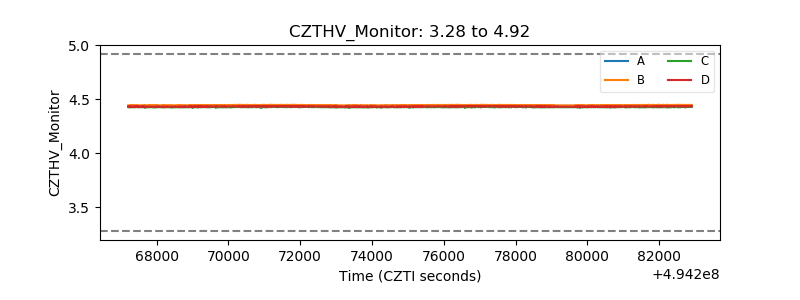 |
| D_VDD | 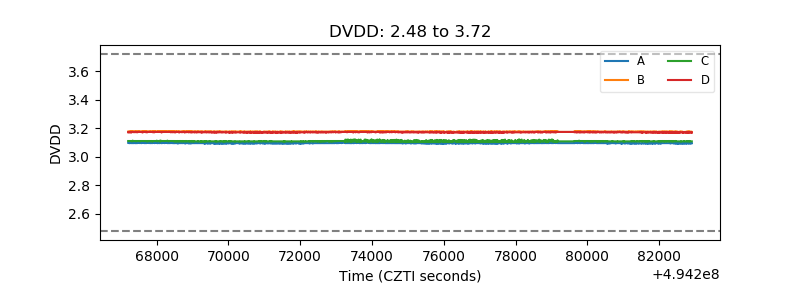 |
| Temperature 1 | 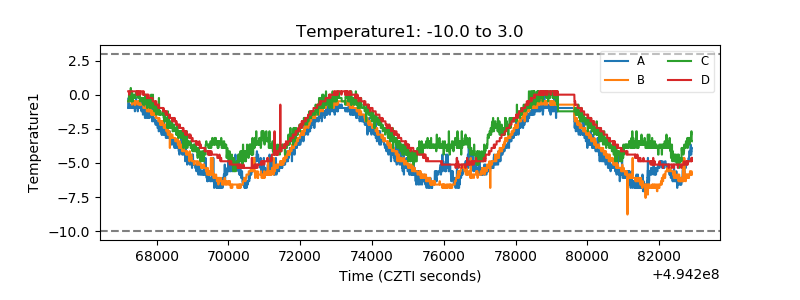 |
| Veto HV Monitor | 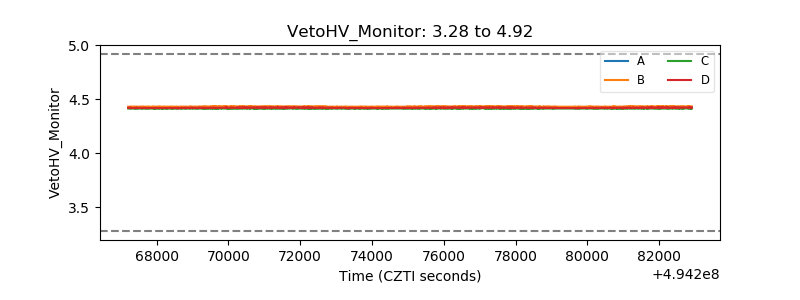 |
| Veto LLD | 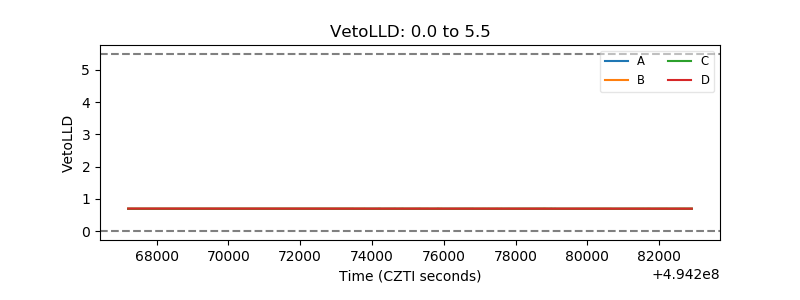 |
| Alpha Counter | 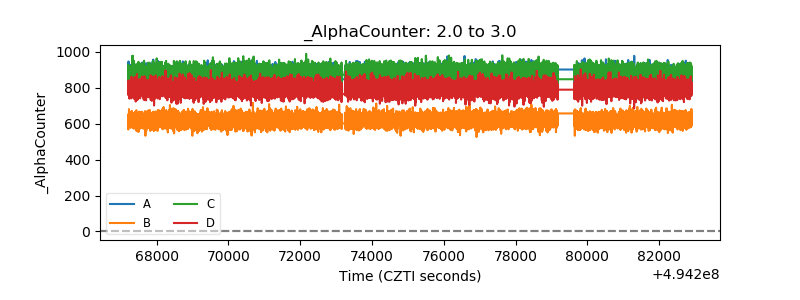 |
| _CPM_Rate | 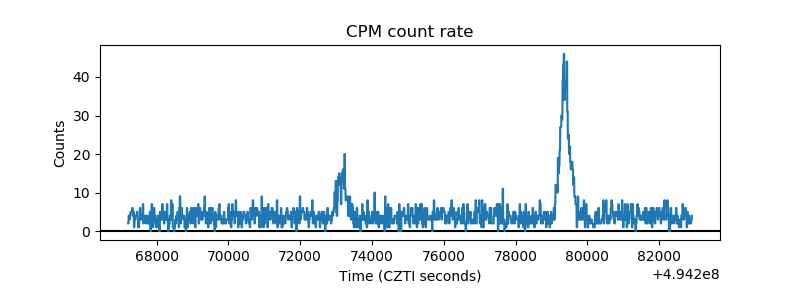 |
| CZT Counter | 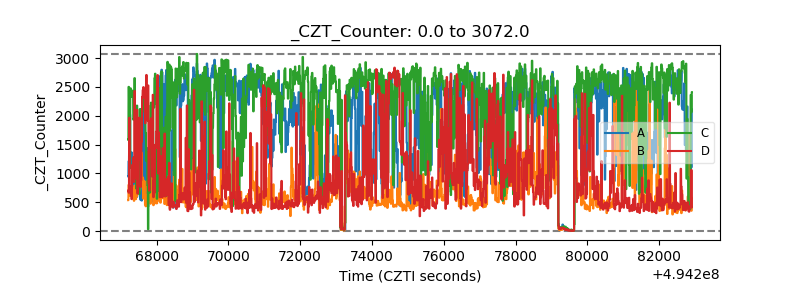 |
| +2.5 Volts monitor | 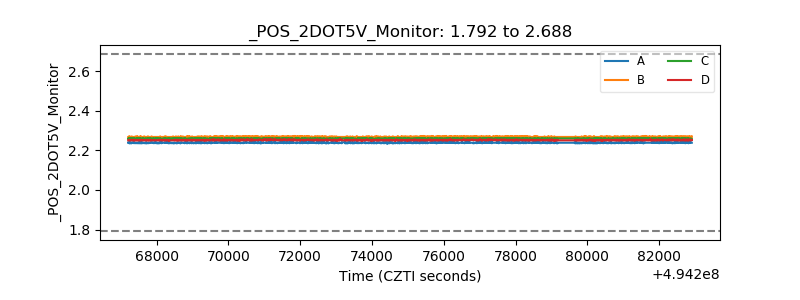 |
| +5 Volts monitor |  |
| _ROLL_ROT | 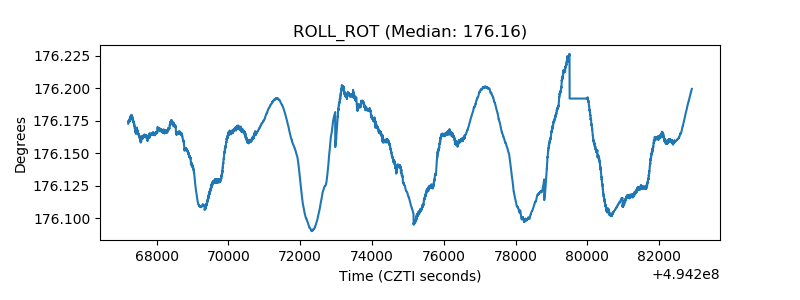 |
| _Roll_DEC | 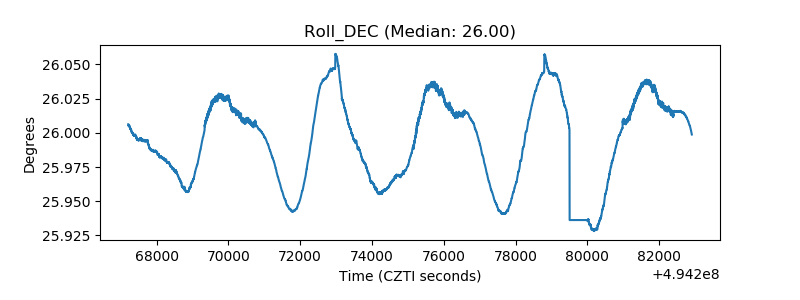 |
| _Roll_RA | 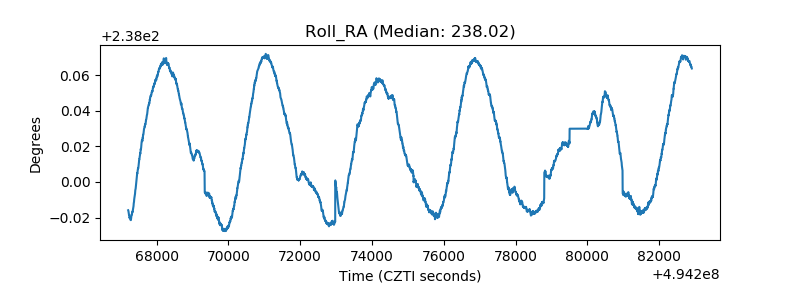 |
| Veto Counter | 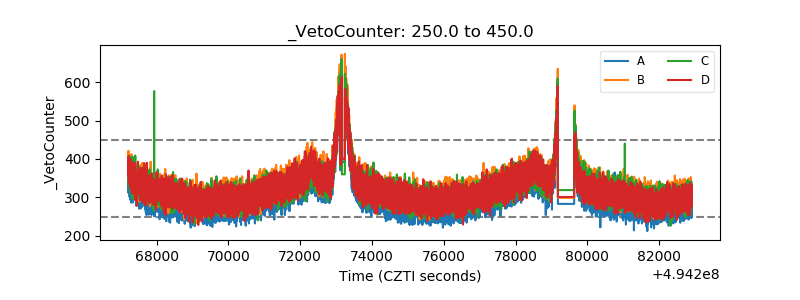 |