| Param | Original file | Final file |
|---|---|---|
| Filename | modeM0/AS1A14_022T05_9000006504_53683cztM0_level2.fits | modeM0/AS1A14_022T05_9000006504_53683cztM0_level2_quad_clean.evt |
| Size (bytes) | 1,406,430,720 | 108,495,360 |
| Size | 1.3 GB | 103.5 MB |
| Events in quadrant A | 20,997,416 | 354,071 |
| Events in quadrant B | 5,246,278 | 983,108 |
| Events in quadrant C | 18,303,638 | 443,744 |
| Events in quadrant D | 6,753,598 | 819,946 |
| Mode SS | |||
|---|---|---|---|
| Quadrant | BADHDUFLAG | Total packets | Discarded packets |
| A | 0 | 200 | 0 |
| B | 0 | 200 | 0 |
| C | 0 | 200 | 0 |
| D | 0 | 200 | 0 |
| Mode M9 | |||
|---|---|---|---|
| Quadrant | BADHDUFLAG | Total packets | Discarded packets |
| A | 0 | 15 | 0 |
| B | 0 | 15 | 0 |
| C | 0 | 15 | 0 |
| D | 0 | 15 | 0 |
| Mode M0 | |||
|---|---|---|---|
| Quadrant | BADHDUFLAG | Total packets | Discarded packets |
| A | 0 | 69184 | 2 |
| B | 0 | 22690 | 3 |
| C | 0 | 61115 | 2 |
| D | 0 | 26999 | 2 |
| Quadrant | Total seconds | Saturated seconds | Saturation percentage |
|---|---|---|---|
| A | 9862 | 6647 | 67.400122% |
| B | 9862 | 131 | 1.328331% |
| C | 9862 | 5386 | 54.613669% |
| D | 9862 | 358 | 3.630095% |
Noise dominated data is calculated using 1-second bins in cleaned event files. If a bin has >2000 counts, and if more than 50% of those come from <1% of pixels, then it is considered to be noise-dominated and hence unusable.
| Quadrant | # 1 sec bins | Bins with >0 counts | Bins with >2000 counts | High rate bins dominated by noise | Noise dominated (total time) | Noise dominated (detector-on time) | Marked lightcurve |
|---|---|---|---|---|---|---|---|
| A | 11366 | 9862 | 6426 | 6426 | 56.54% | 65.16% | 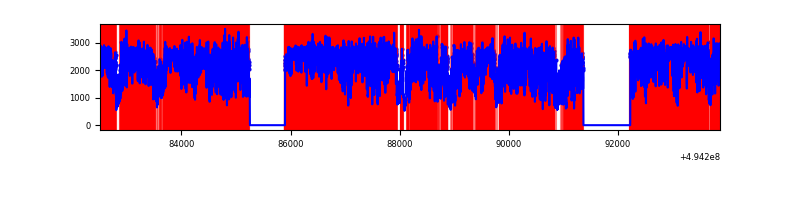 |
| B | 11367 | 9864 | 79 | 79 | 0.69% | 0.80% | 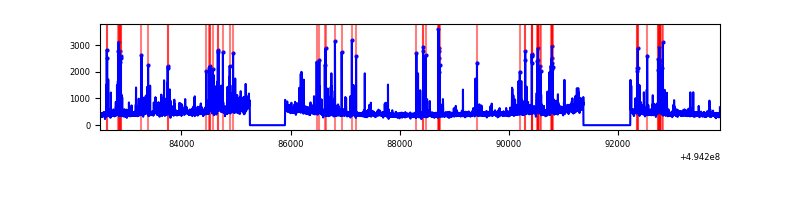 |
| C | 11366 | 9862 | 5004 | 5004 | 44.03% | 50.74% | 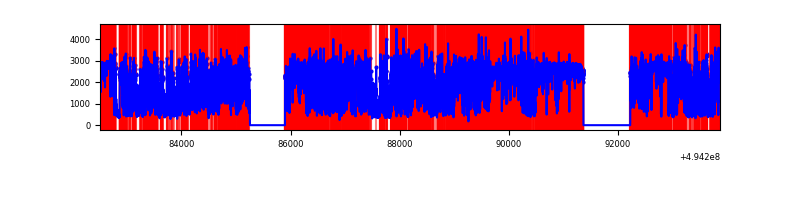 |
| D | 11367 | 9864 | 351 | 351 | 3.09% | 3.56% | 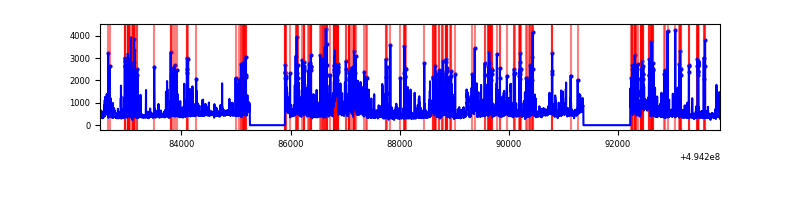 |
Top three noisy pixels from each quadrant. If the there are fewer than three noisy pixels in the level2.evt file, extra rows are filled as -1
| Pixel properties | Quadrant properties | ||||||
|---|---|---|---|---|---|---|---|
| Quadrant | DetID | PixID | Counts | Sigma | Mean | Median | Sigma |
| A | 3 | 63 | 15341486 | 78333.62 | 784 | 766 | 195.8 |
| A | 3 | 78 | 721600 | 3680.76 | 784 | 766 | 195.8 |
| A | 3 | 94 | 362655 | 1847.9 | 784 | 766 | 195.8 |
| B | 5 | 185 | 597072 | 2668.17 | 1041 | 1004 | 223.4 |
| B | 7 | 0 | 206588 | 920.25 | 1041 | 1004 | 223.4 |
| B | 10 | 247 | 50967 | 223.65 | 1041 | 1004 | 223.4 |
| C | 15 | 224 | 6444729 | 32290.21 | 720 | 716 | 199.6 |
| C | 1 | 241 | 5017231 | 25137.18 | 720 | 716 | 199.6 |
| C | 7 | 64 | 1598651 | 8007.07 | 720 | 716 | 199.6 |
| D | 10 | 172 | 1035085 | 3541.82 | 1011 | 965 | 292.0 |
| D | 7 | 70 | 513899 | 1756.78 | 1011 | 965 | 292.0 |
| D | 2 | 37 | 194863 | 664.09 | 1011 | 965 | 292.0 |
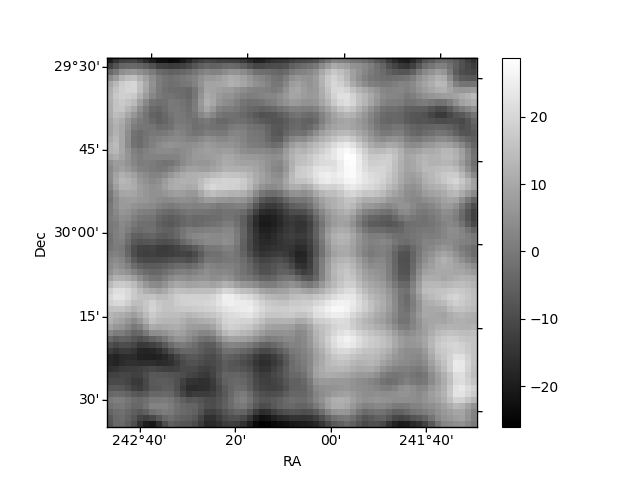
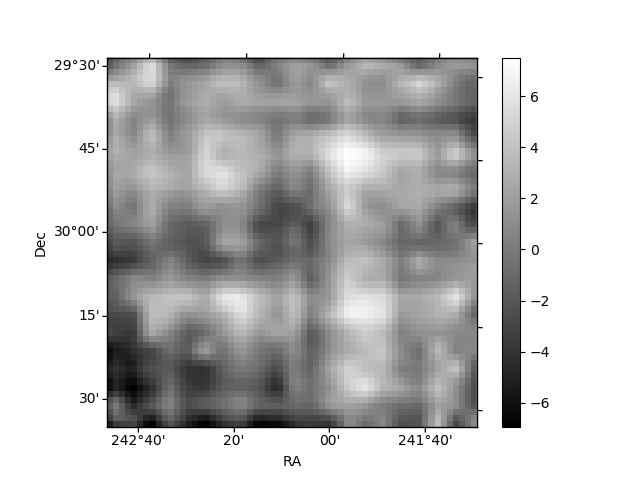
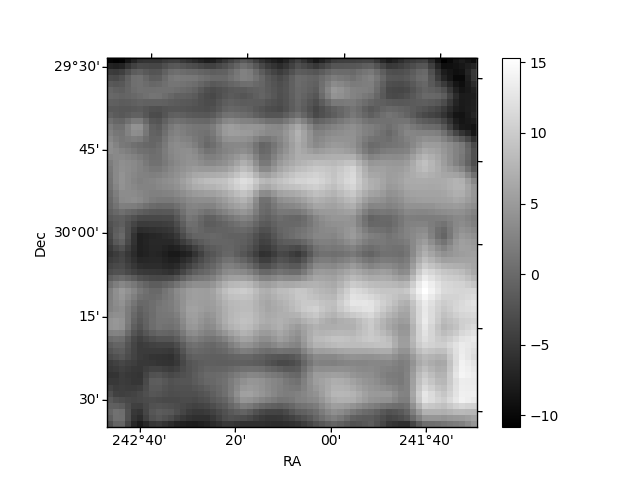
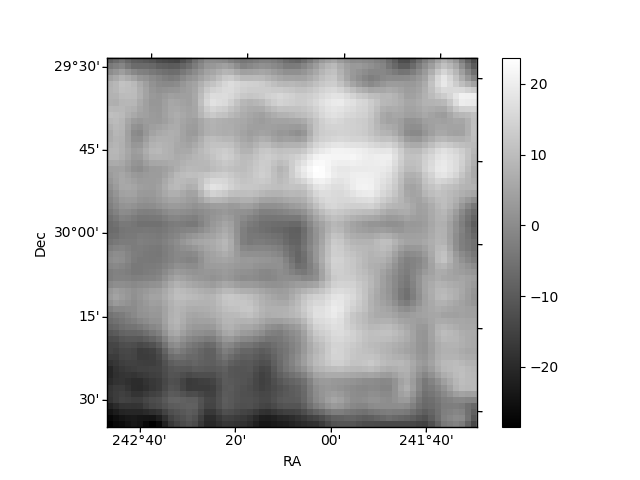
Histogram calculated using DETX and DETY for each event in the final _common_clean file
| Quadrant A | 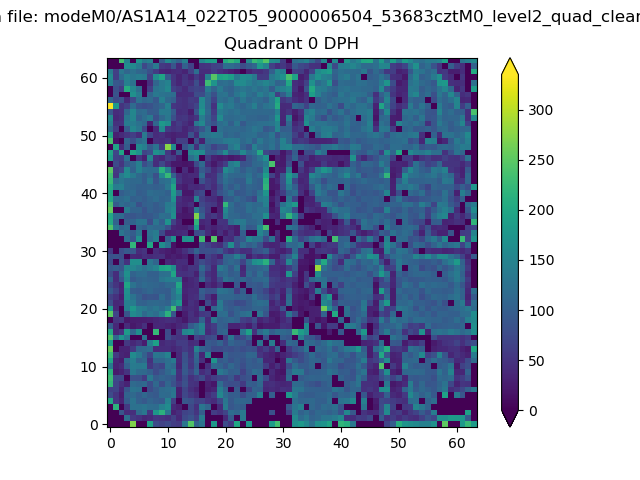 |
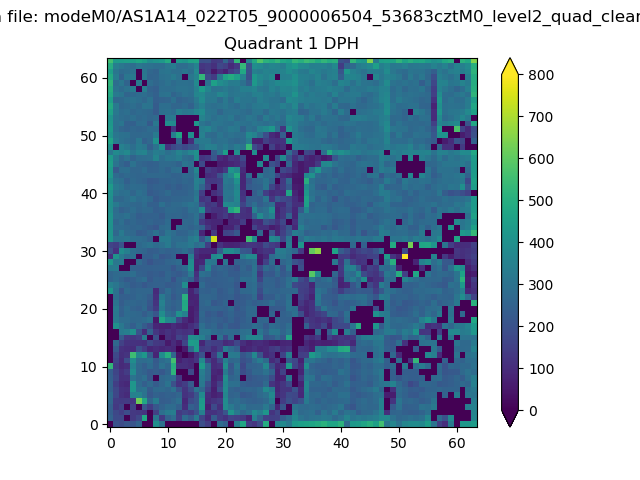 |
Quadrant B |
|---|---|---|---|
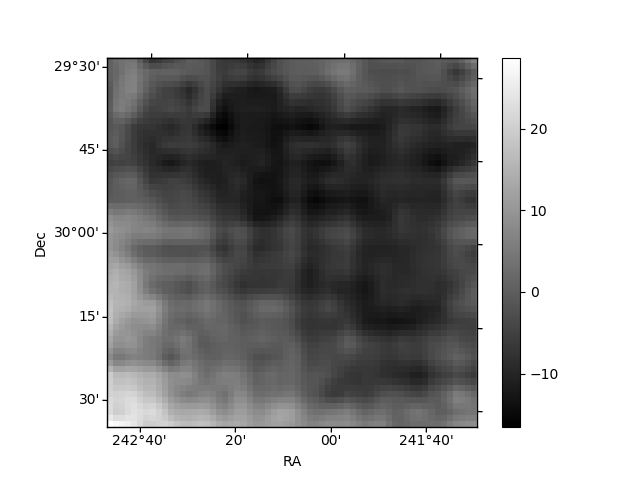
| Quadrant D | 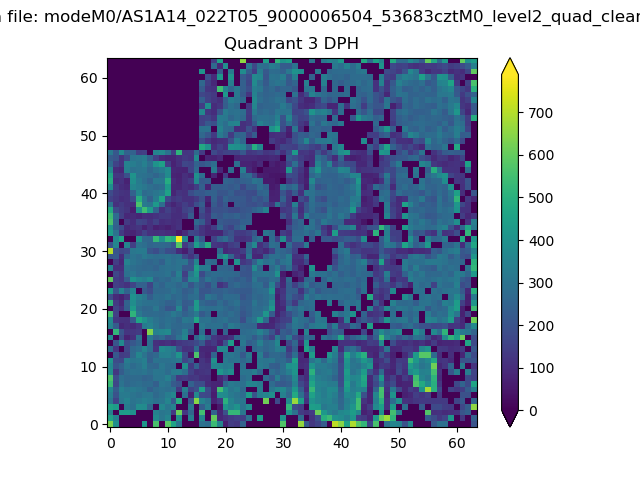 |
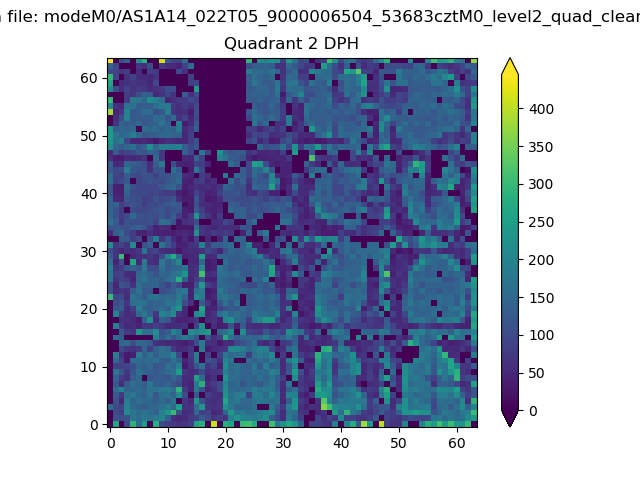 |
Quadrant C |
| Plot type | Count rate plots | Images |
|---|---|---|
| Comparison with Poisson distribution Blue bars denote a histogram of data divided into 1 sec bins. Red curve is a Poisson curve with rate = median count rate of data. |
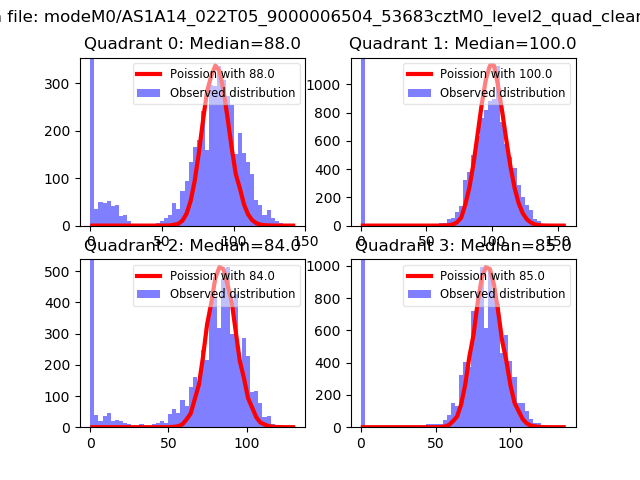 |
 |
| Quadrant-wise count rates Data is divided into 100 sec bins |
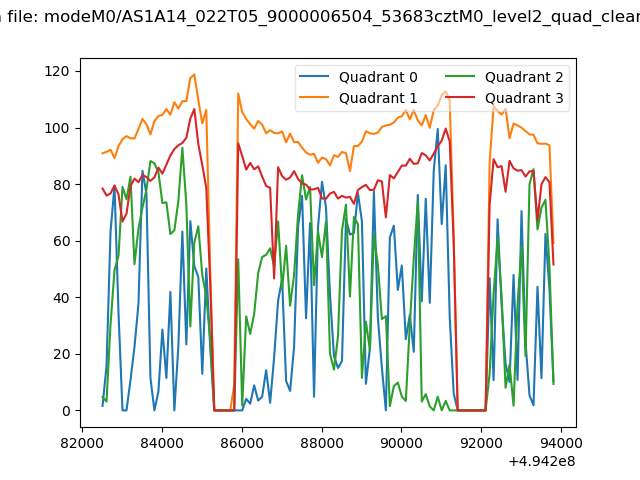 |
|
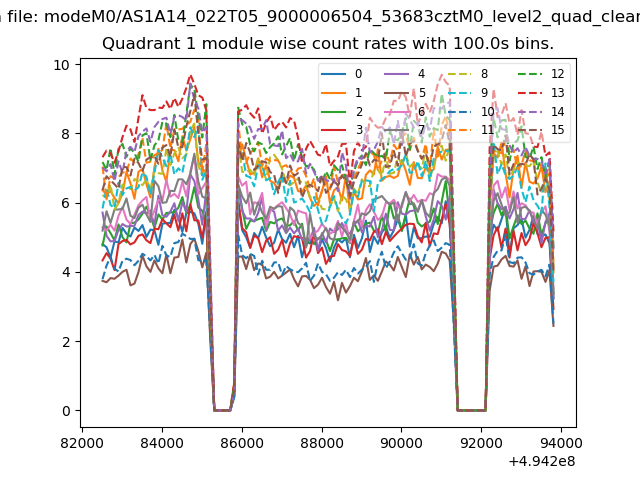
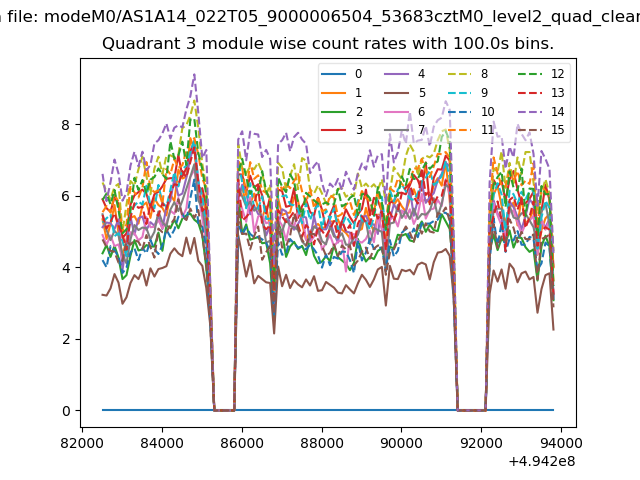
| Module-wise count rates for Quadrant A Data is divided into 100 sec bins |
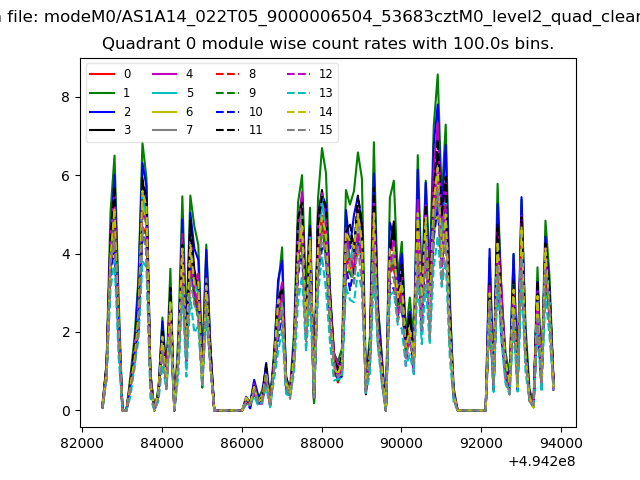 |
 |
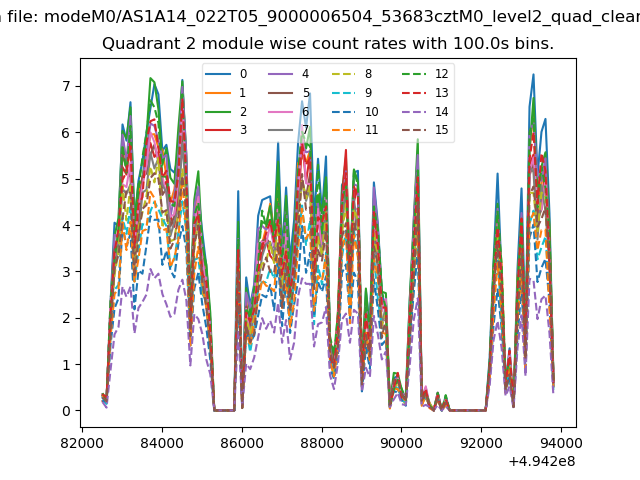
| Module-wise count rates for Quadrant B Data is divided into 100 sec bins |
 |
 |
| Module-wise count rates for Quadrant C Data is divided into 100 sec bins |
 |
 |
| Module-wise count rates for Quadrant D Data is divided into 100 sec bins |
 |
 |
| Parameter | Plot |
|---|---|
| CZT HV Monitor |  |
| D_VDD | 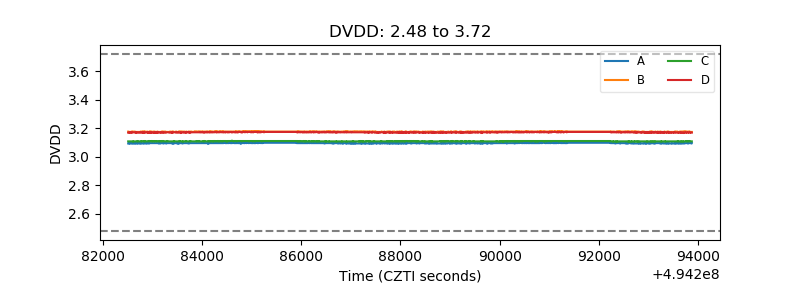 |
| Temperature 1 | 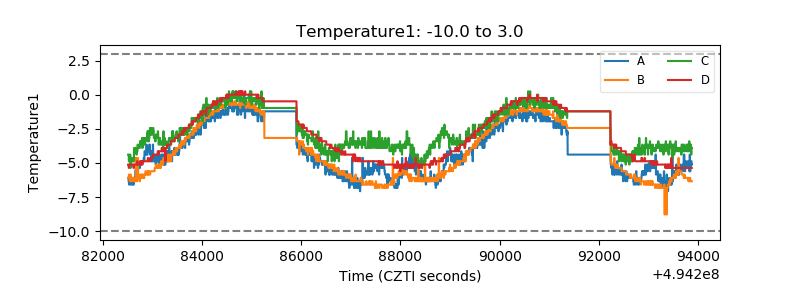 |
| Veto HV Monitor | 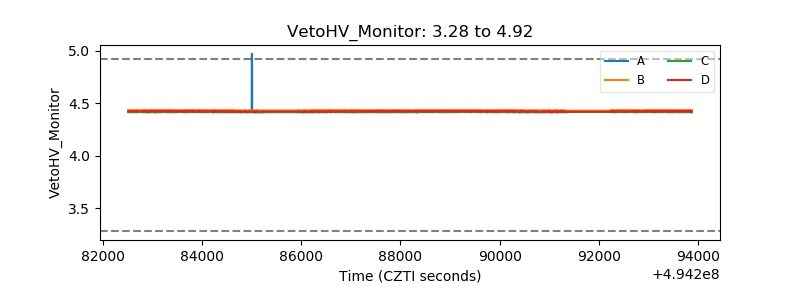 |
| Veto LLD | 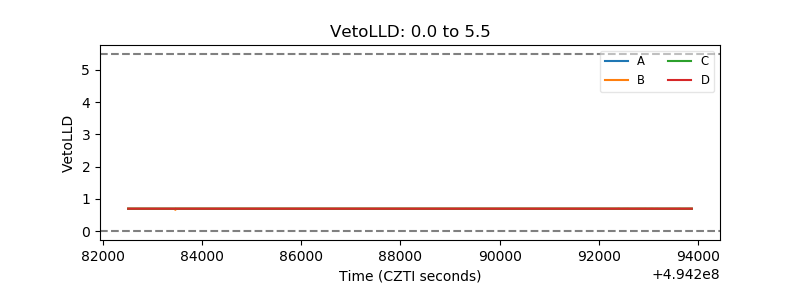 |
| Alpha Counter | 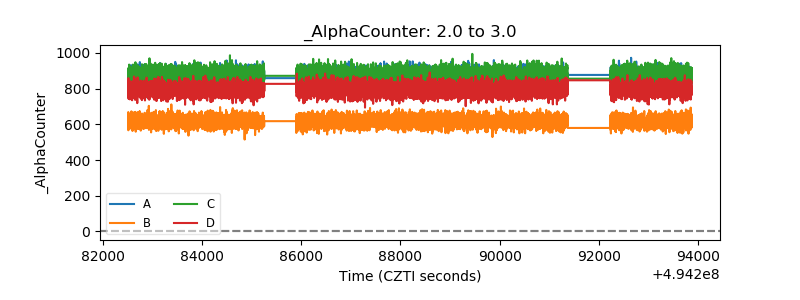 |
| _CPM_Rate | 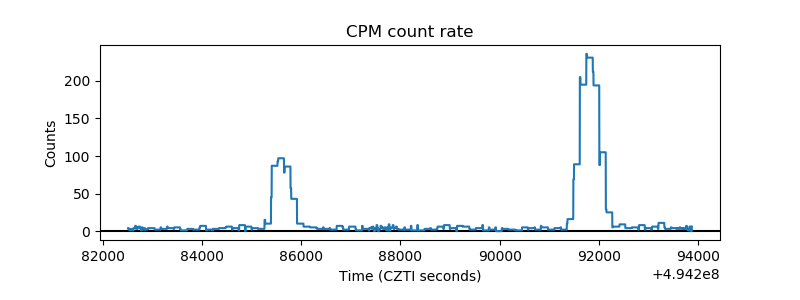 |
| CZT Counter | 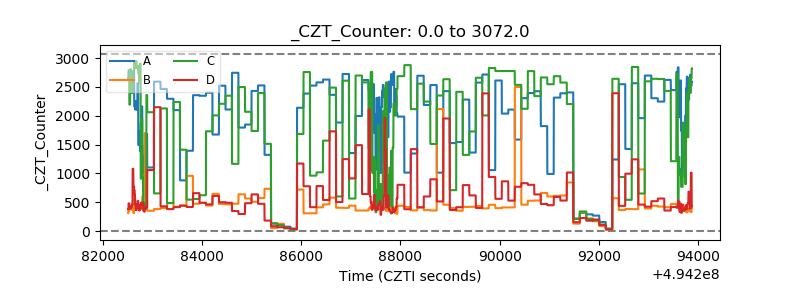 |
| +2.5 Volts monitor |  |
| +5 Volts monitor |  |
| _ROLL_ROT | 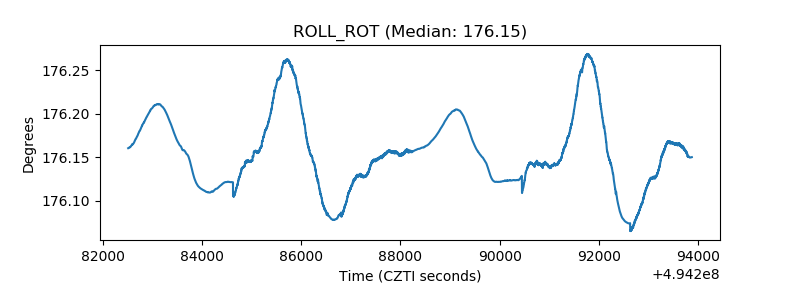 |
| _Roll_DEC | 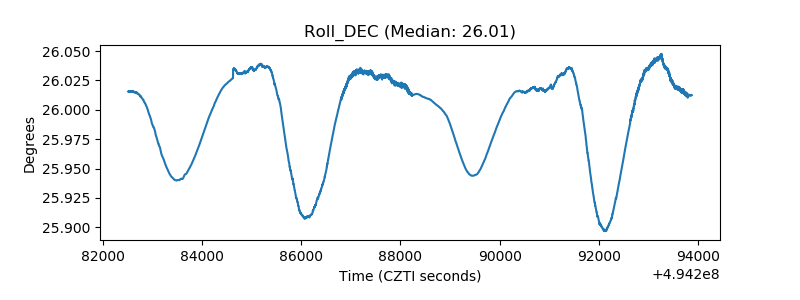 |
| _Roll_RA | 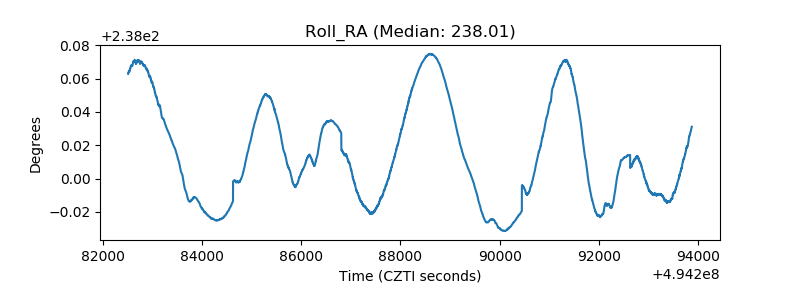 |
| Veto Counter | 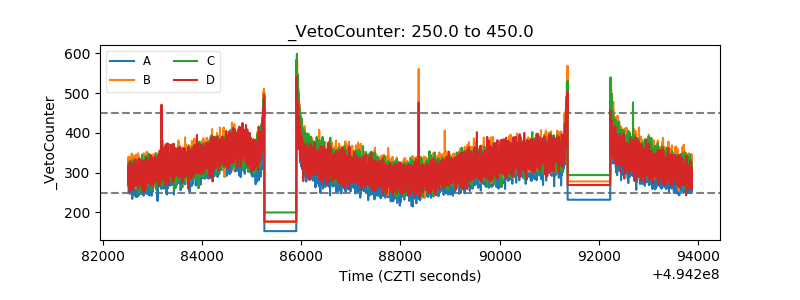 |