| Param | Original file | Final file |
|---|---|---|
| Filename | modeM0/AS1A14_022T05_9000006504_53686cztM0_level2.fits | modeM0/AS1A14_022T05_9000006504_53686cztM0_level2_quad_clean.evt |
| Size (bytes) | 1,011,381,120 | 73,293,120 |
| Size | 964.5 MB | 69.9 MB |
| Events in quadrant A | 14,368,647 | 241,737 |
| Events in quadrant B | 4,678,304 | 651,573 |
| Events in quadrant C | 13,155,961 | 290,112 |
| Events in quadrant D | 4,723,416 | 573,603 |
| Mode SS | |||
|---|---|---|---|
| Quadrant | BADHDUFLAG | Total packets | Discarded packets |
| A | 0 | 134 | 0 |
| B | 0 | 134 | 0 |
| C | 0 | 134 | 0 |
| D | 0 | 134 | 0 |
| Mode M9 | |||
|---|---|---|---|
| Quadrant | BADHDUFLAG | Total packets | Discarded packets |
| A | 0 | 14 | 0 |
| B | 0 | 15 | 0 |
| C | 0 | 15 | 0 |
| D | 0 | 15 | 0 |
| Mode M0 | |||
|---|---|---|---|
| Quadrant | BADHDUFLAG | Total packets | Discarded packets |
| A | 0 | 47224 | 2 |
| B | 0 | 18469 | 2 |
| C | 0 | 43590 | 2 |
| D | 0 | 18772 | 2 |
| Quadrant | Total seconds | Saturated seconds | Saturation percentage |
|---|---|---|---|
| A | 6626 | 4521 | 68.231210% |
| B | 6626 | 632 | 9.538183% |
| C | 6626 | 3933 | 59.357078% |
| D | 6626 | 203 | 3.063688% |
Noise dominated data is calculated using 1-second bins in cleaned event files. If a bin has >2000 counts, and if more than 50% of those come from <1% of pixels, then it is considered to be noise-dominated and hence unusable.
| Quadrant | # 1 sec bins | Bins with >0 counts | Bins with >2000 counts | High rate bins dominated by noise | Noise dominated (total time) | Noise dominated (detector-on time) | Marked lightcurve |
|---|---|---|---|---|---|---|---|
| A | 7686 | 6626 | 4516 | 4516 | 58.76% | 68.16% | 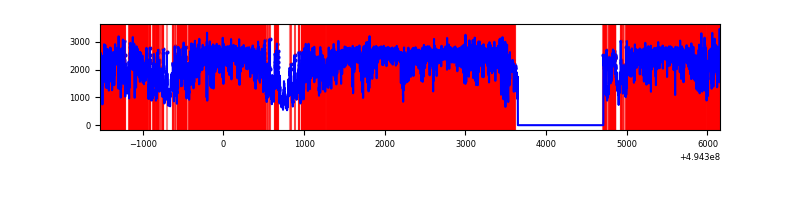 |
| B | 7686 | 6626 | 431 | 431 | 5.61% | 6.50% | 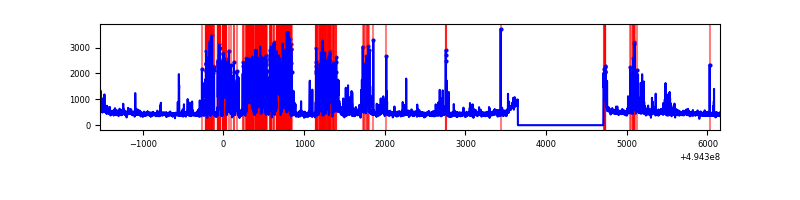 |
| C | 7686 | 6626 | 3780 | 3780 | 49.18% | 57.05% | 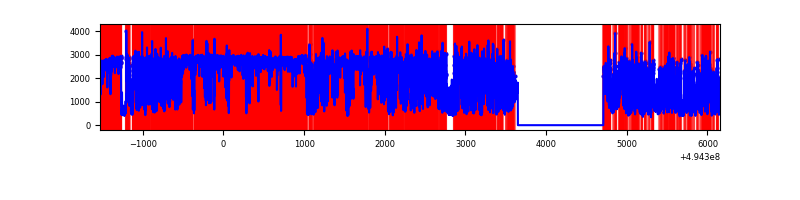 |
| D | 7686 | 6626 | 172 | 172 | 2.24% | 2.60% | 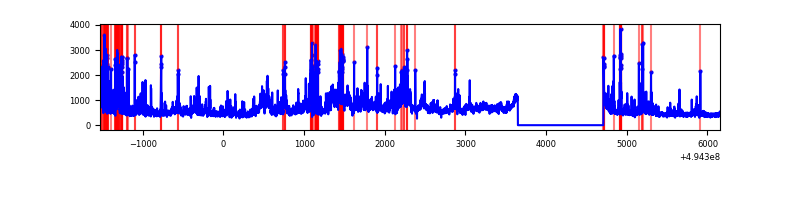 |
Top three noisy pixels from each quadrant. If the there are fewer than three noisy pixels in the level2.evt file, extra rows are filled as -1
| Pixel properties | Quadrant properties | ||||||
|---|---|---|---|---|---|---|---|
| Quadrant | DetID | PixID | Counts | Sigma | Mean | Median | Sigma |
| A | 3 | 63 | 11065412 | 82942.68 | 533 | 520 | 133.4 |
| A | 3 | 78 | 482011 | 3609.27 | 533 | 520 | 133.4 |
| A | 12 | 17 | 374418 | 2802.75 | 533 | 520 | 133.4 |
| B | 5 | 185 | 1710946 | 11213.02 | 703 | 678 | 152.5 |
| B | 10 | 254 | 64422 | 417.92 | 703 | 678 | 152.5 |
| B | 10 | 247 | 25992 | 165.96 | 703 | 678 | 152.5 |
| C | 1 | 241 | 5571749 | 42220.34 | 474 | 469 | 132.0 |
| C | 15 | 224 | 4523132 | 34273.7 | 474 | 469 | 132.0 |
| C | 2 | 12 | 643966 | 4876.55 | 474 | 469 | 132.0 |
| D | 10 | 172 | 1066643 | 5378.3 | 696 | 666 | 198.2 |
| D | 2 | 153 | 188848 | 949.46 | 696 | 666 | 198.2 |
| D | 7 | 70 | 141468 | 710.4 | 696 | 666 | 198.2 |
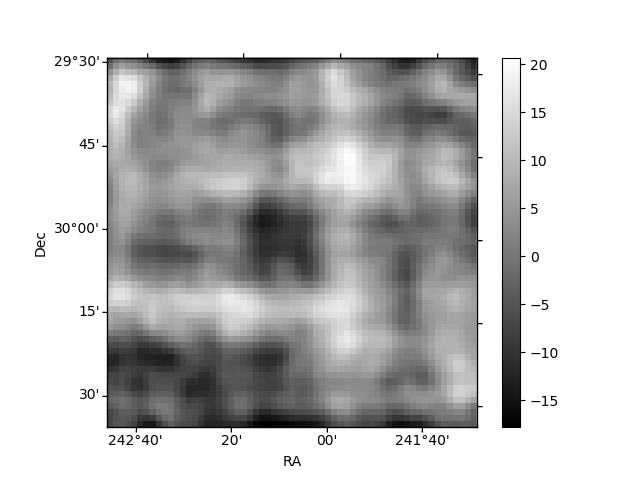
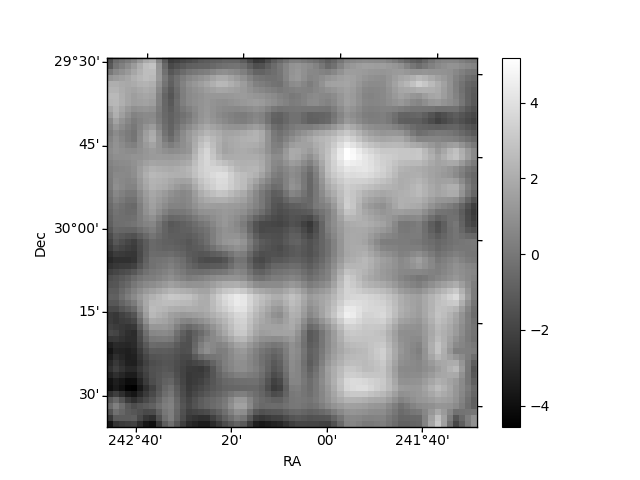
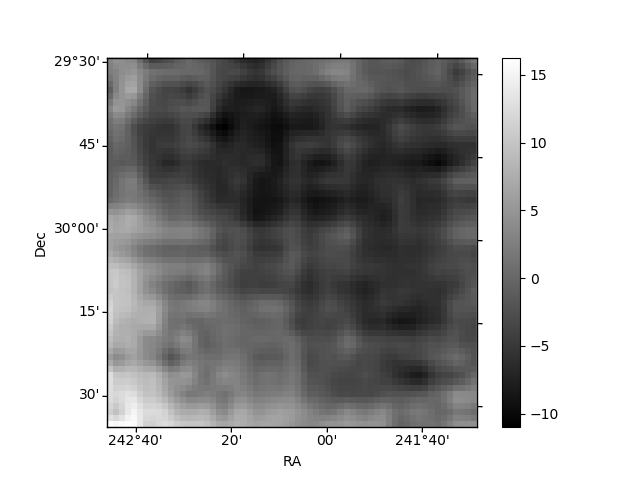
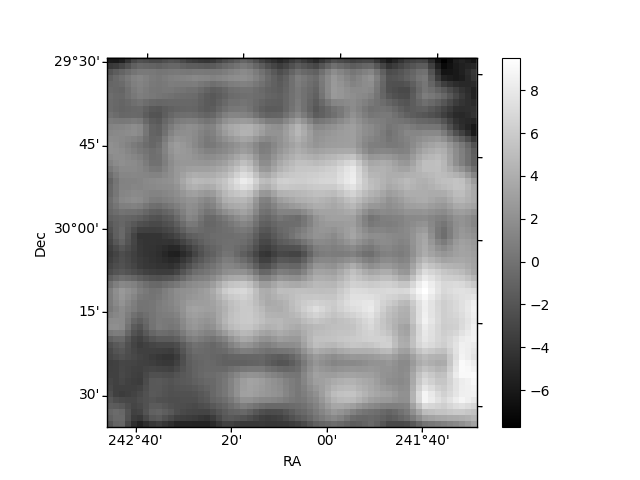
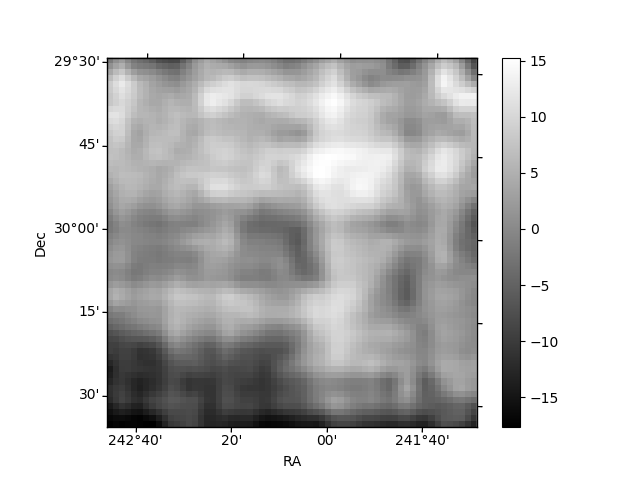
Histogram calculated using DETX and DETY for each event in the final _common_clean file
| Quadrant A | 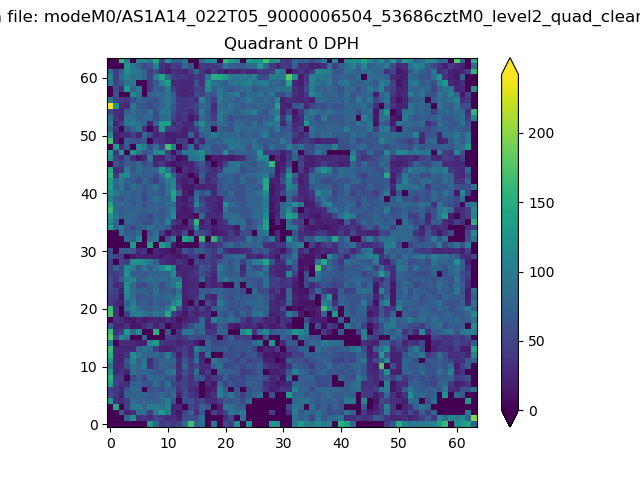 |
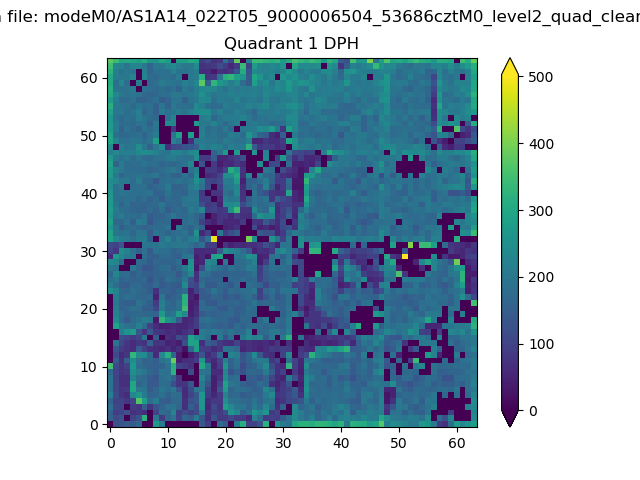 |
Quadrant B |
|---|---|---|---|
| Quadrant D | 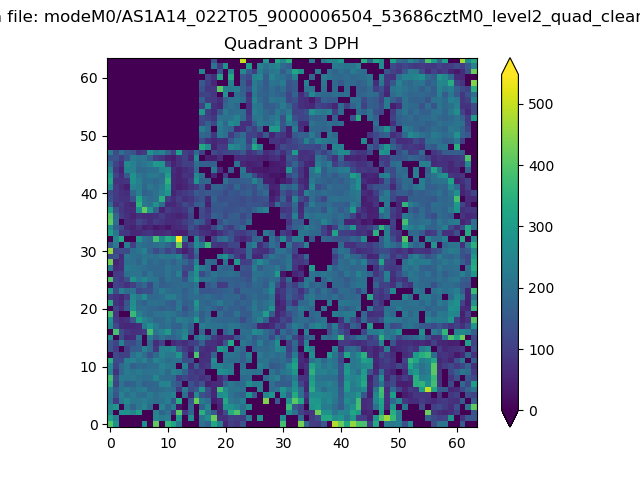 |
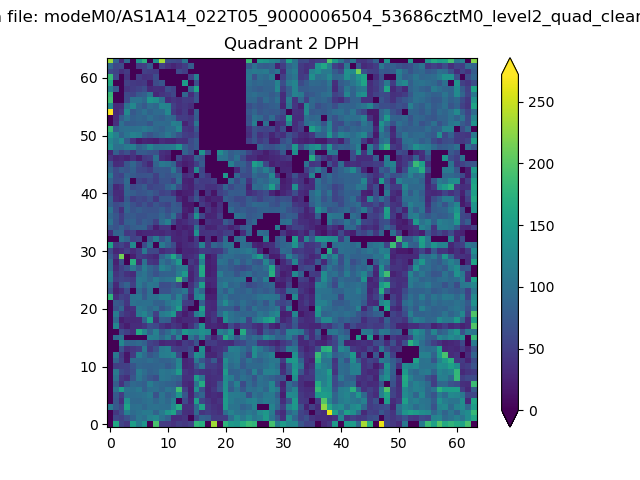 |
Quadrant C |
| Plot type | Count rate plots | Images |
|---|---|---|
| Comparison with Poisson distribution Blue bars denote a histogram of data divided into 1 sec bins. Red curve is a Poisson curve with rate = median count rate of data. |
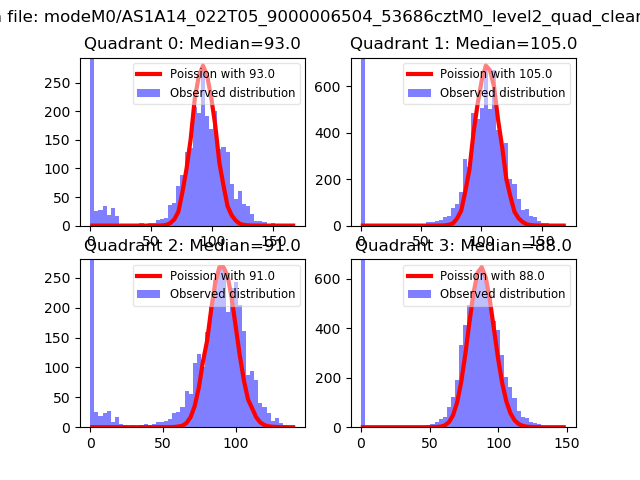 |
 |
| Quadrant-wise count rates Data is divided into 100 sec bins |
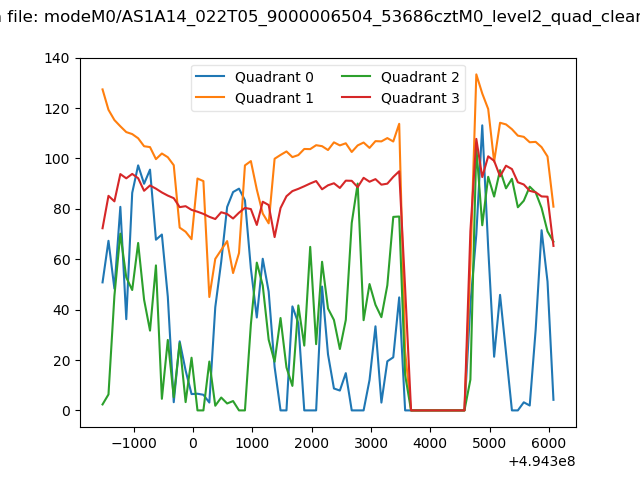 |
|
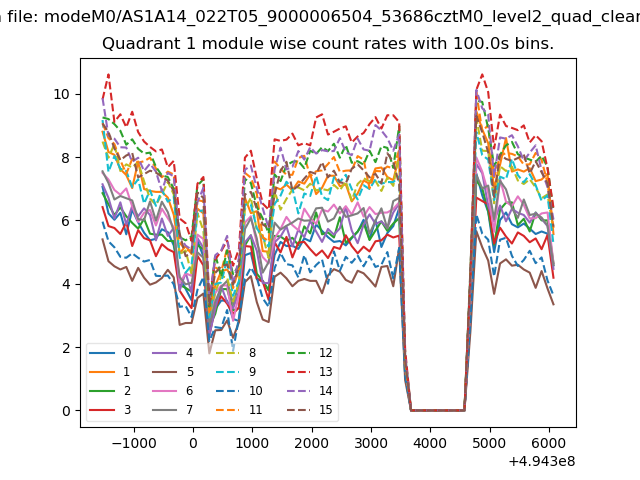
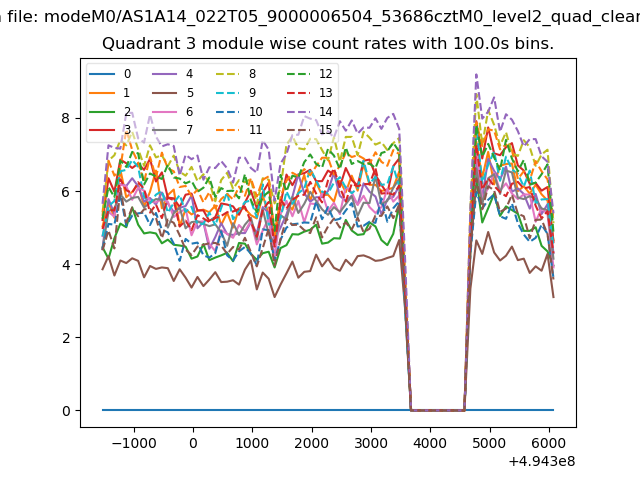
| Module-wise count rates for Quadrant A Data is divided into 100 sec bins |
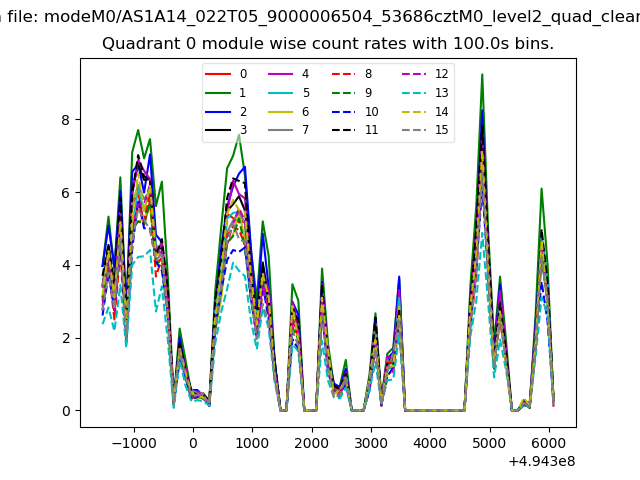 |
 |
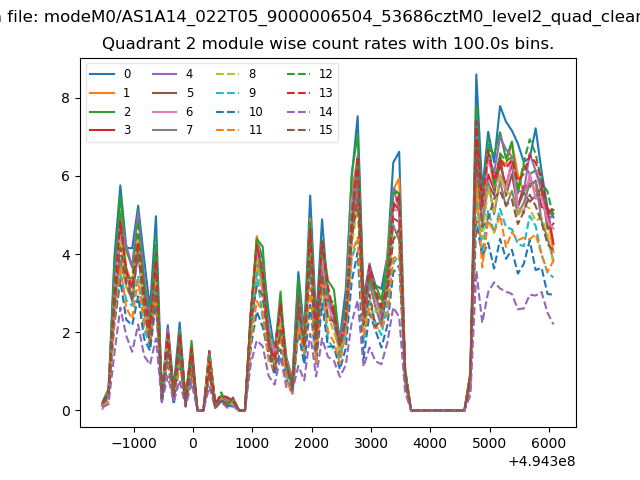
| Module-wise count rates for Quadrant B Data is divided into 100 sec bins |
 |
 |
| Module-wise count rates for Quadrant C Data is divided into 100 sec bins |
 |
 |
| Module-wise count rates for Quadrant D Data is divided into 100 sec bins |
 |
 |
| Parameter | Plot |
|---|---|
| CZT HV Monitor | 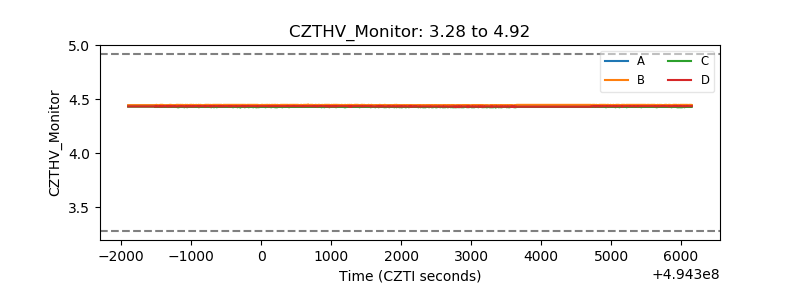 |
| D_VDD | 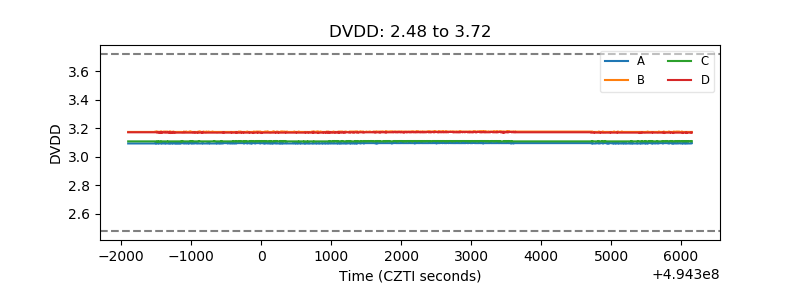 |
| Temperature 1 | 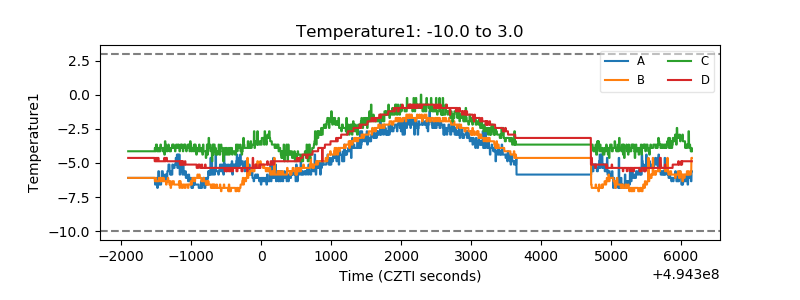 |
| Veto HV Monitor | 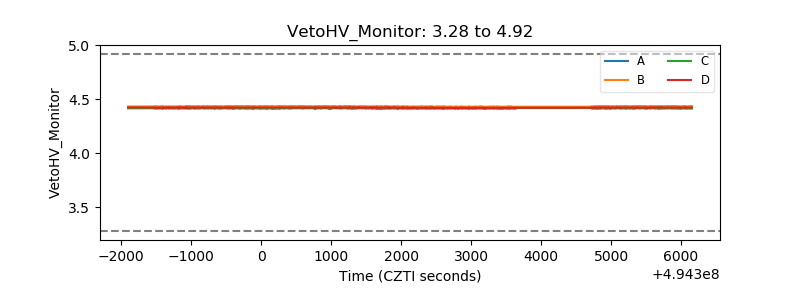 |
| Veto LLD | 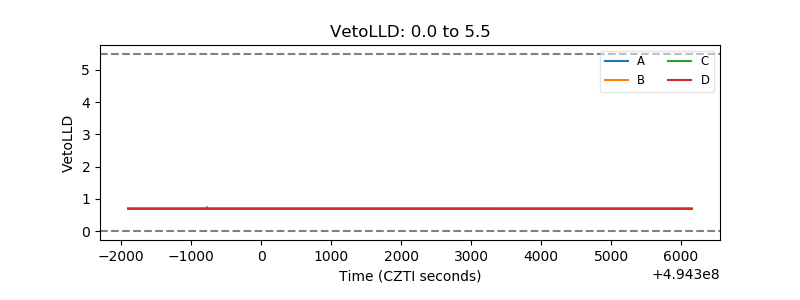 |
| Alpha Counter | 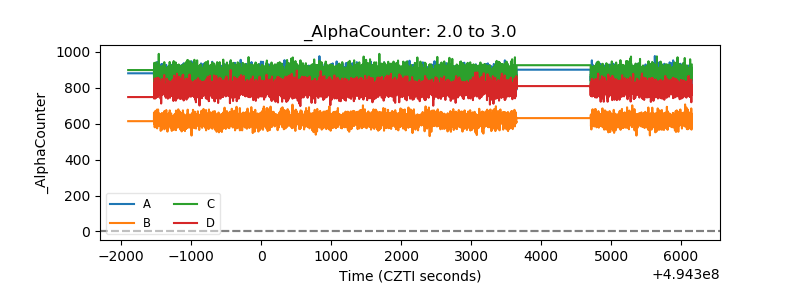 |
| _CPM_Rate | 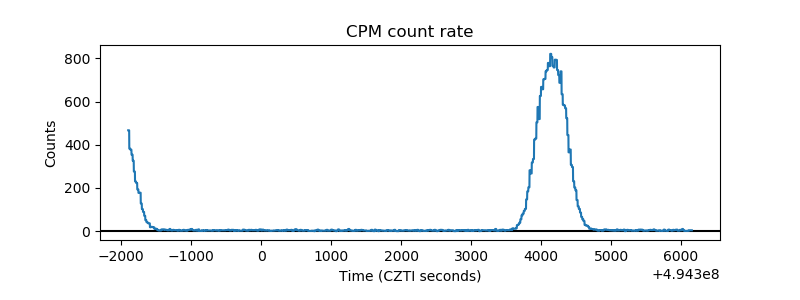 |
| CZT Counter | 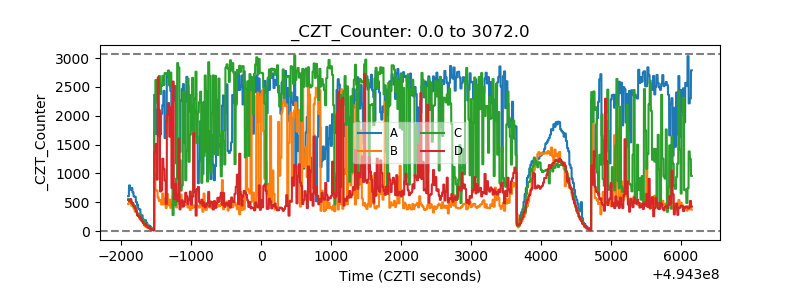 |
| +2.5 Volts monitor |  |
| +5 Volts monitor |  |
| _ROLL_ROT | 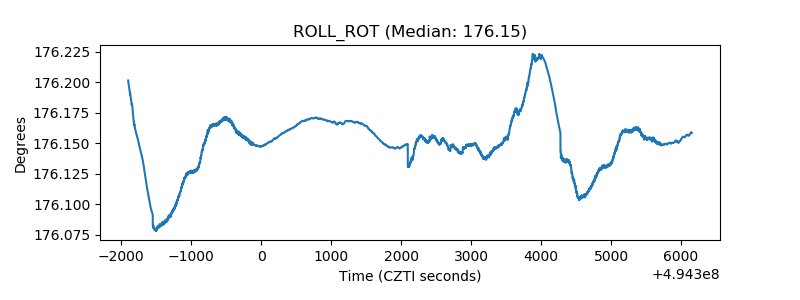 |
| _Roll_DEC | 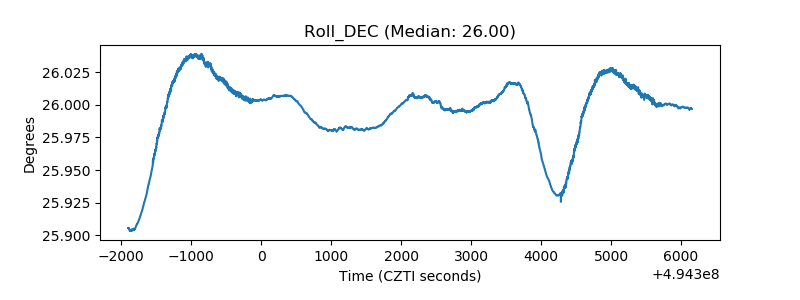 |
| _Roll_RA | 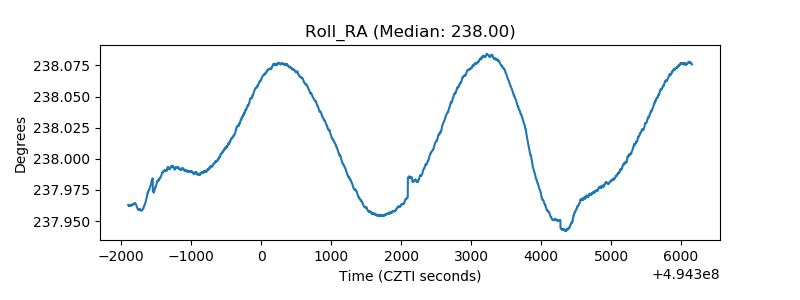 |
| Veto Counter | 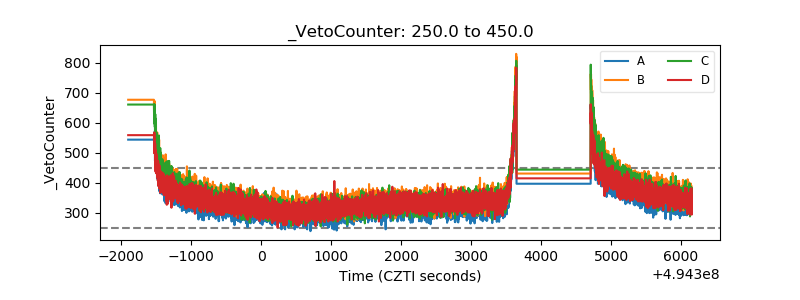 |