| Param | Original file | Final file |
|---|---|---|
| Filename | modeM0/AS1A14_022T05_9000006504_53687cztM0_level2.fits | modeM0/AS1A14_022T05_9000006504_53687cztM0_level2_quad_clean.evt |
| Size (bytes) | 814,677,120 | 73,969,920 |
| Size | 776.9 MB | 70.5 MB |
| Events in quadrant A | 14,094,247 | 146,100 |
| Events in quadrant B | 3,250,624 | 659,319 |
| Events in quadrant C | 8,177,953 | 470,873 |
| Events in quadrant D | 4,157,645 | 534,328 |
| Mode SS | |||
|---|---|---|---|
| Quadrant | BADHDUFLAG | Total packets | Discarded packets |
| A | 0 | 124 | 0 |
| B | 0 | 124 | 0 |
| C | 0 | 124 | 0 |
| D | 0 | 124 | 0 |
| Mode M9 | |||
|---|---|---|---|
| Quadrant | BADHDUFLAG | Total packets | Discarded packets |
| A | 0 | 12 | 0 |
| B | 0 | 12 | 0 |
| C | 0 | 12 | 0 |
| D | 0 | 12 | 0 |
| Mode M0 | |||
|---|---|---|---|
| Quadrant | BADHDUFLAG | Total packets | Discarded packets |
| A | 0 | 46129 | 1 |
| B | 0 | 13919 | 1 |
| C | 0 | 28591 | 3 |
| D | 0 | 16801 | 1 |
| Quadrant | Total seconds | Saturated seconds | Saturation percentage |
|---|---|---|---|
| A | 6146 | 4943 | 80.426294% |
| B | 6146 | 130 | 2.115197% |
| C | 6145 | 1620 | 26.362897% |
| D | 6145 | 251 | 4.084622% |
Noise dominated data is calculated using 1-second bins in cleaned event files. If a bin has >2000 counts, and if more than 50% of those come from <1% of pixels, then it is considered to be noise-dominated and hence unusable.
| Quadrant | # 1 sec bins | Bins with >0 counts | Bins with >2000 counts | High rate bins dominated by noise | Noise dominated (total time) | Noise dominated (detector-on time) | Marked lightcurve |
|---|---|---|---|---|---|---|---|
| A | 7295 | 6145 | 4736 | 4736 | 64.92% | 77.07% | 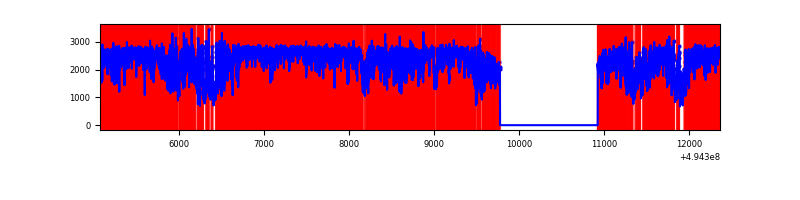 |
| B | 7296 | 6146 | 37 | 37 | 0.51% | 0.60% | 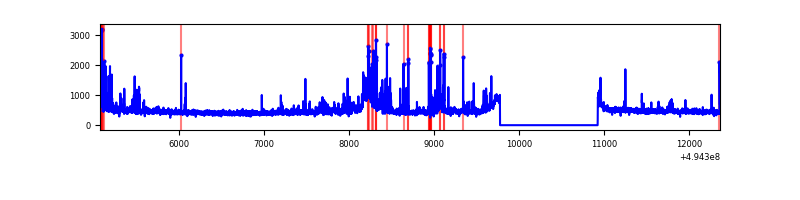 |
| C | 7295 | 6146 | 1473 | 1473 | 20.19% | 23.97% | 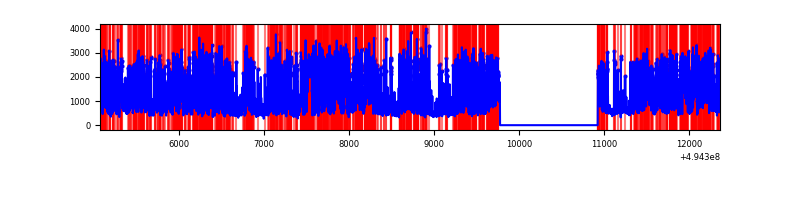 |
| D | 7295 | 6145 | 200 | 200 | 2.74% | 3.25% | 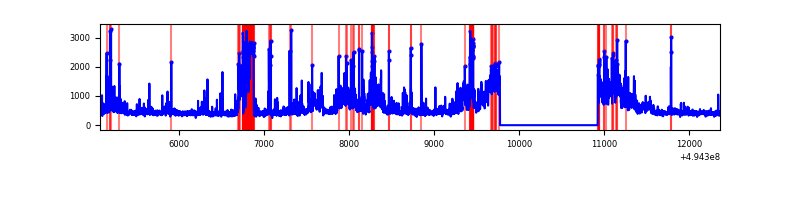 |
Top three noisy pixels from each quadrant. If the there are fewer than three noisy pixels in the level2.evt file, extra rows are filled as -1
| Pixel properties | Quadrant properties | ||||||
|---|---|---|---|---|---|---|---|
| Quadrant | DetID | PixID | Counts | Sigma | Mean | Median | Sigma |
| A | 3 | 63 | 9305287 | 86866.4 | 431 | 421 | 107.1 |
| A | 3 | 78 | 2211420 | 20640.98 | 431 | 421 | 107.1 |
| A | 12 | 17 | 590873 | 5512.22 | 431 | 421 | 107.1 |
| B | 5 | 185 | 332857 | 2259.67 | 680 | 657 | 147.0 |
| B | 7 | 0 | 83792 | 565.49 | 680 | 657 | 147.0 |
| B | 10 | 254 | 53638 | 360.38 | 680 | 657 | 147.0 |
| C | 15 | 224 | 4591990 | 27955.54 | 591 | 587 | 164.2 |
| C | 2 | 12 | 436552 | 2654.45 | 591 | 587 | 164.2 |
| C | 15 | 158 | 232966 | 1414.88 | 591 | 587 | 164.2 |
| D | 10 | 172 | 805146 | 4330.68 | 651 | 622 | 185.8 |
| D | 13 | 153 | 461997 | 2483.54 | 651 | 622 | 185.8 |
| D | 2 | 153 | 76821 | 410.17 | 651 | 622 | 185.8 |
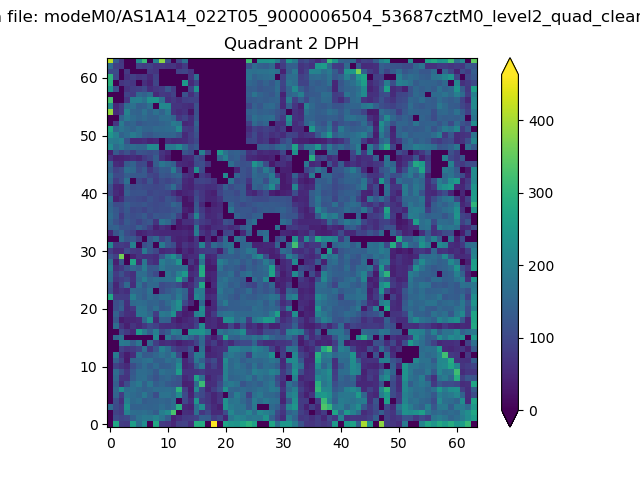
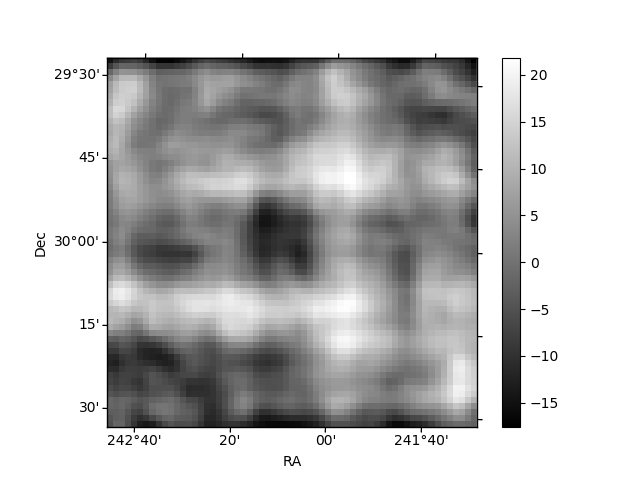
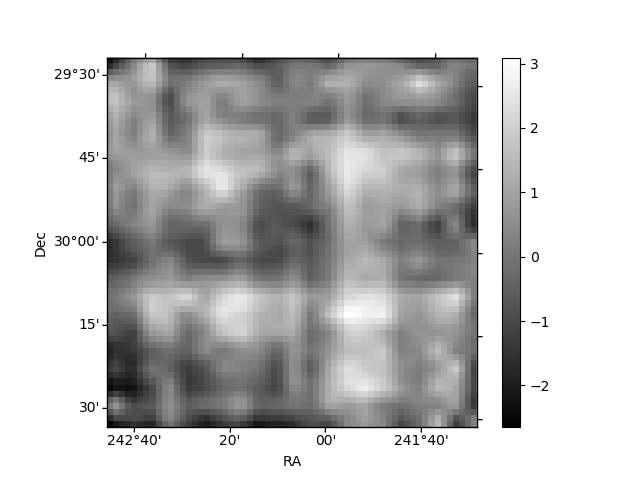
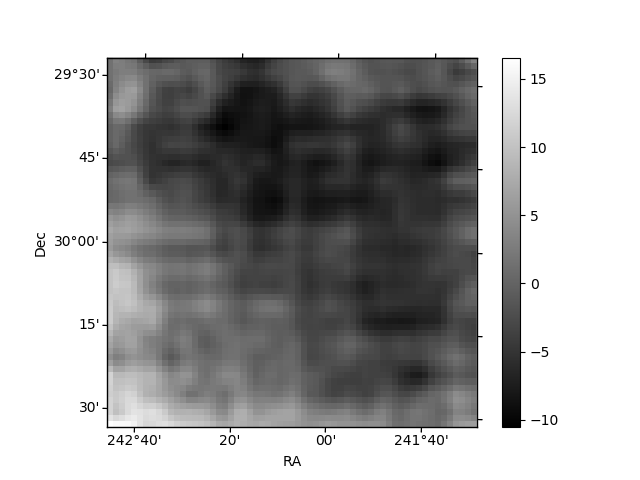
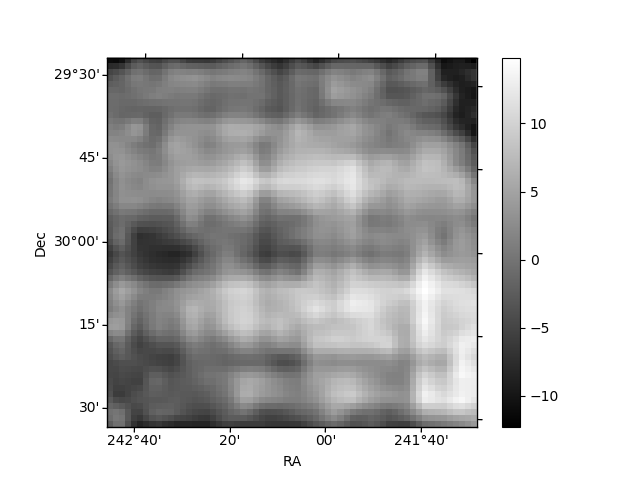
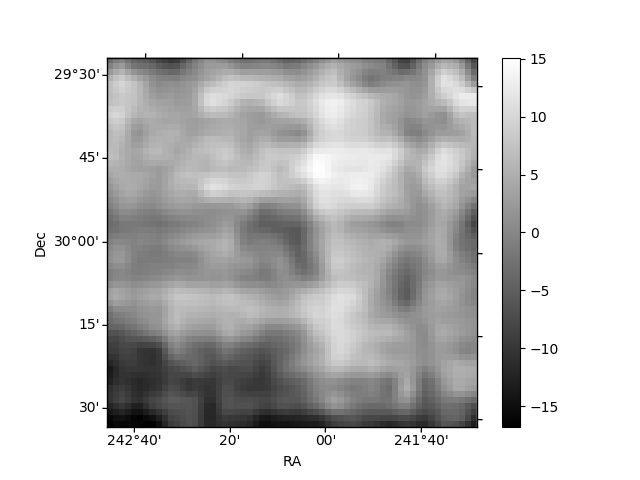
Histogram calculated using DETX and DETY for each event in the final _common_clean file
| Quadrant A | 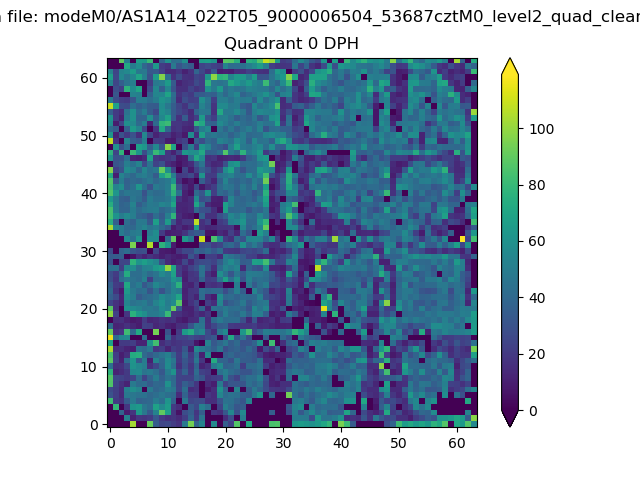 |
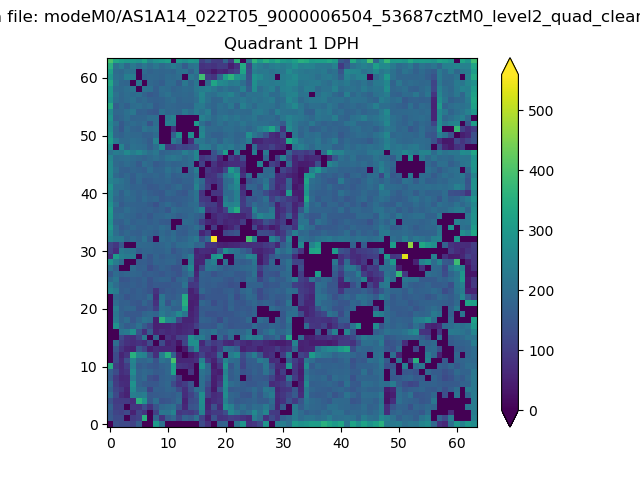 |
Quadrant B |
|---|---|---|---|
| Quadrant D | 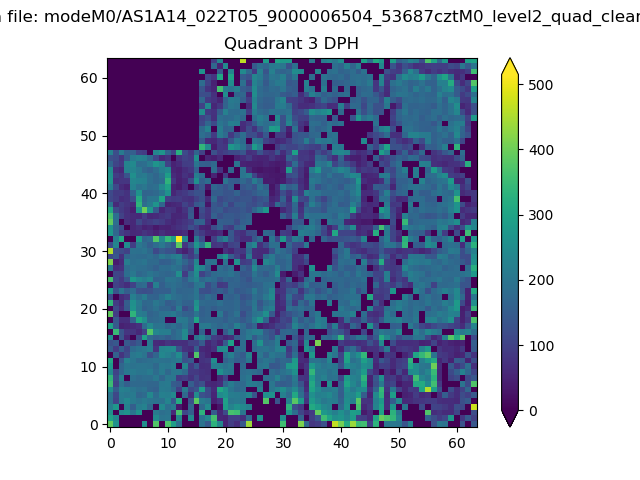 |
 |
Quadrant C |
| Plot type | Count rate plots | Images |
|---|---|---|
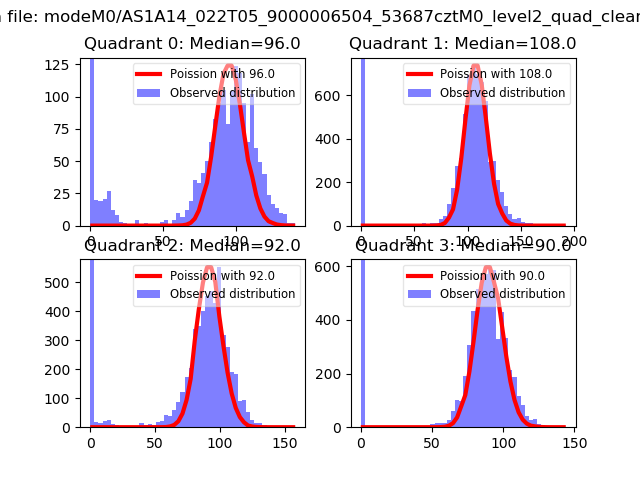
| Comparison with Poisson distribution Blue bars denote a histogram of data divided into 1 sec bins. Red curve is a Poisson curve with rate = median count rate of data. |
 |
 |
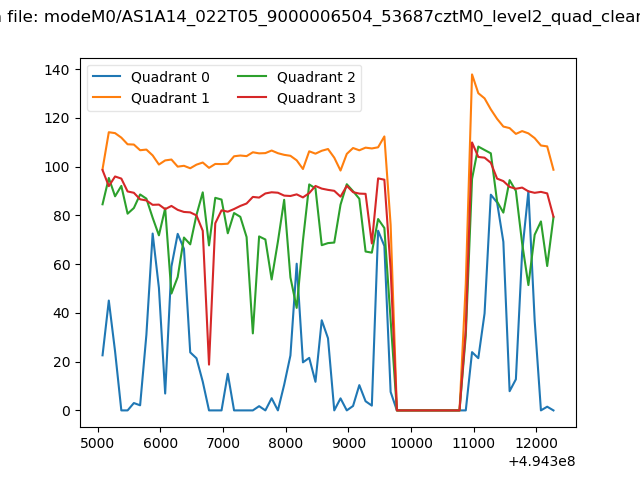
| Quadrant-wise count rates Data is divided into 100 sec bins |
 |
|
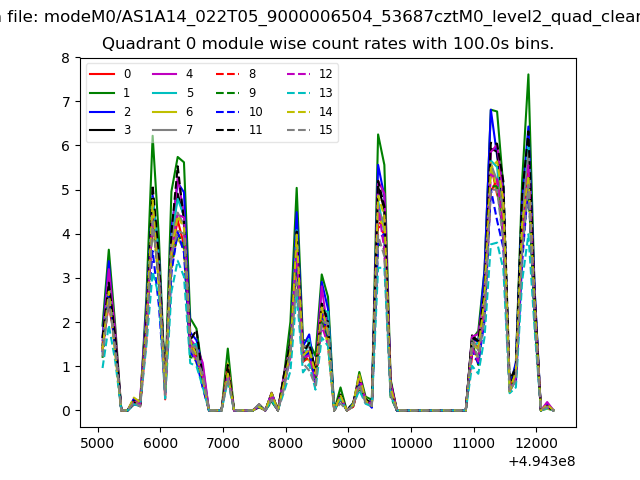
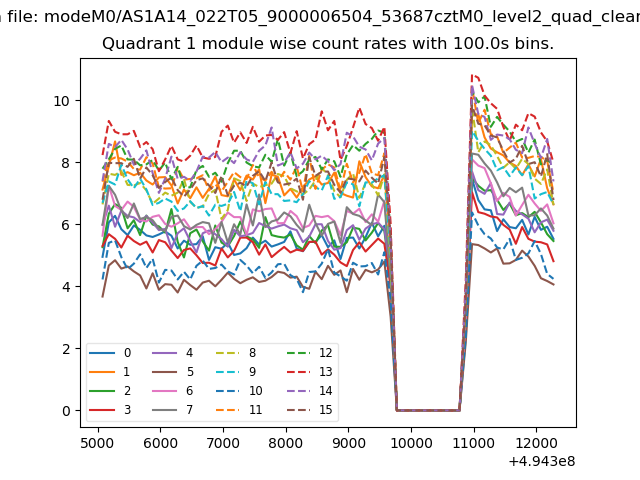
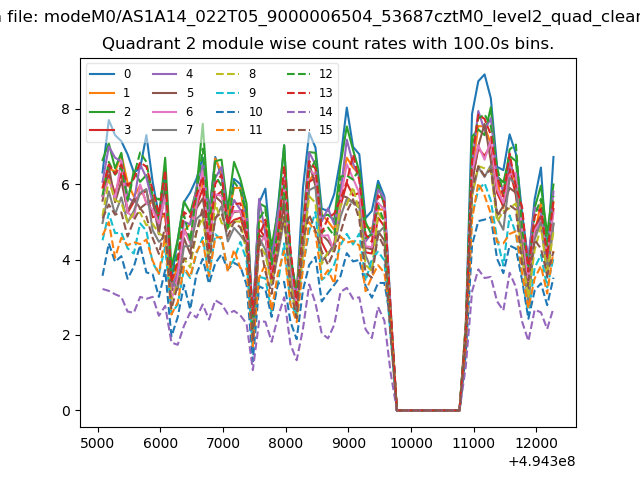
| Module-wise count rates for Quadrant A Data is divided into 100 sec bins |
 |
 |
| Module-wise count rates for Quadrant B Data is divided into 100 sec bins |
 |
 |
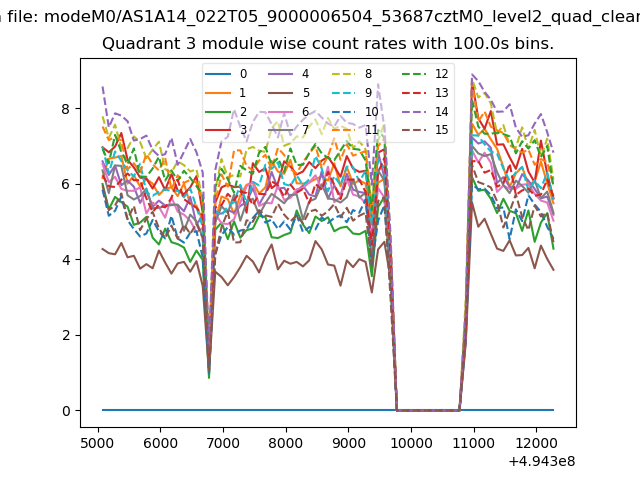
| Module-wise count rates for Quadrant C Data is divided into 100 sec bins |
 |
 |
| Module-wise count rates for Quadrant D Data is divided into 100 sec bins |
 |
 |
| Parameter | Plot |
|---|---|
| CZT HV Monitor | 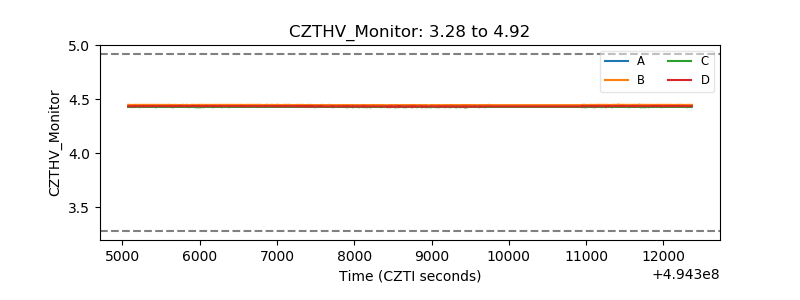 |
| D_VDD | 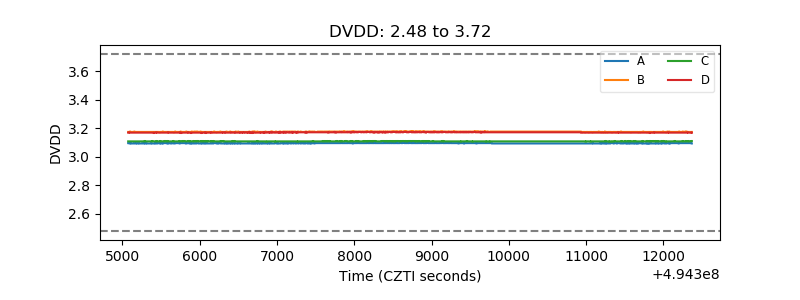 |
| Temperature 1 | 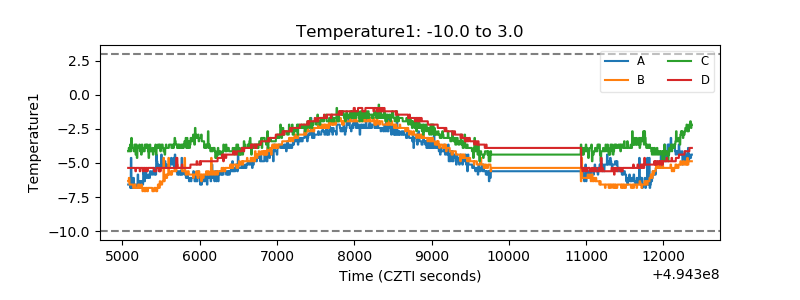 |
| Veto HV Monitor | 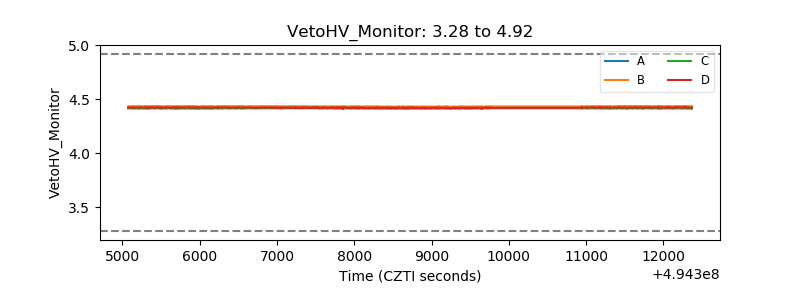 |
| Veto LLD | 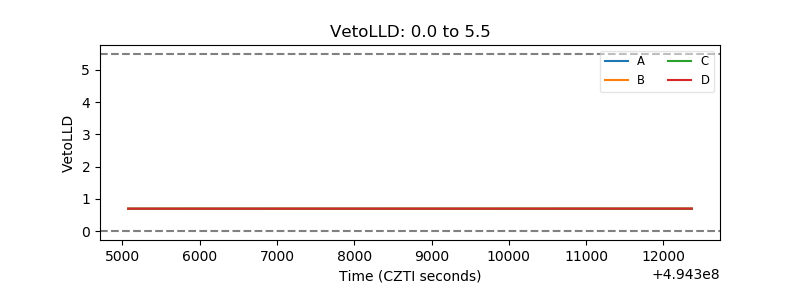 |
| Alpha Counter | 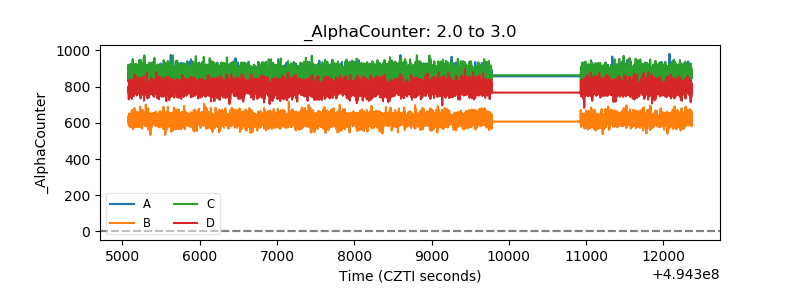 |
| _CPM_Rate | 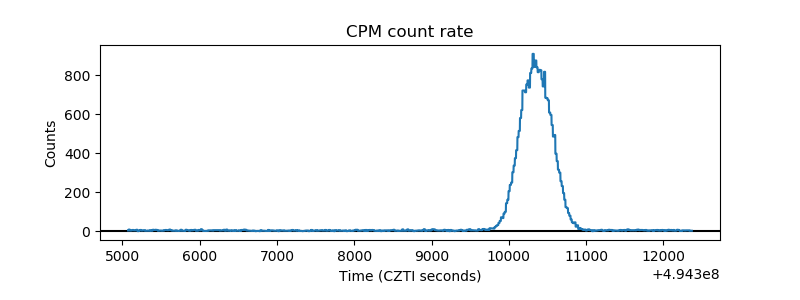 |
| CZT Counter | 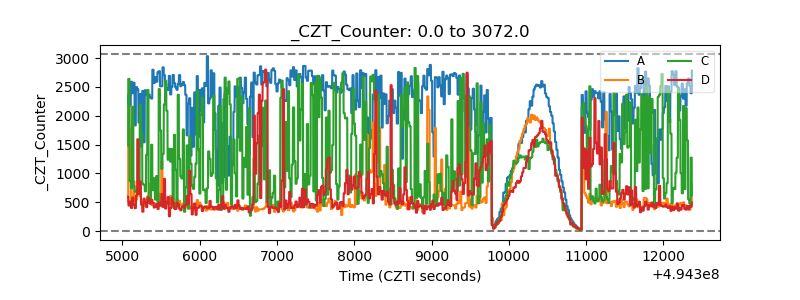 |
| +2.5 Volts monitor | 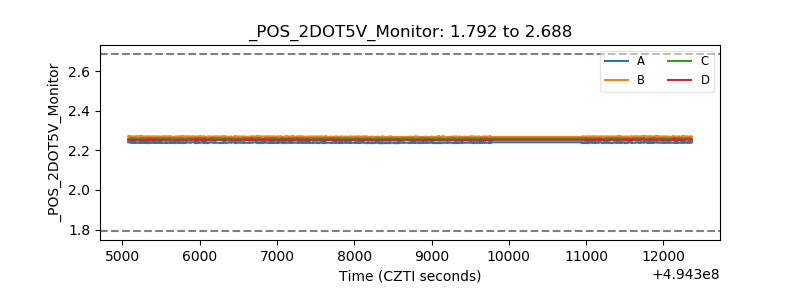 |
| +5 Volts monitor |  |
| _ROLL_ROT | 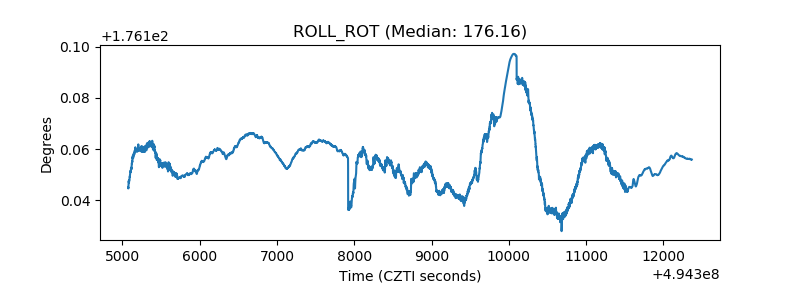 |
| _Roll_DEC | 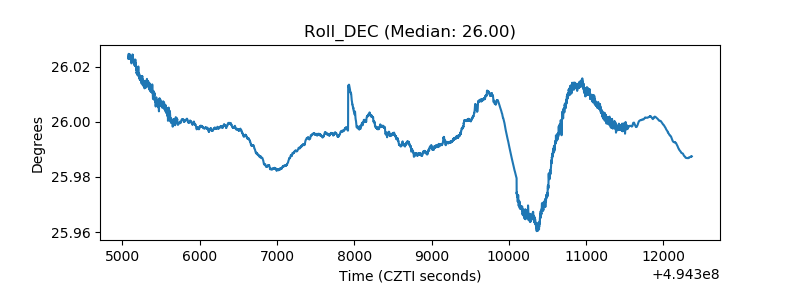 |
| _Roll_RA | 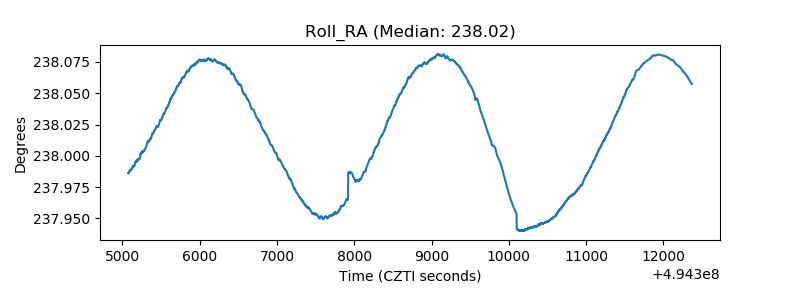 |
| Veto Counter | 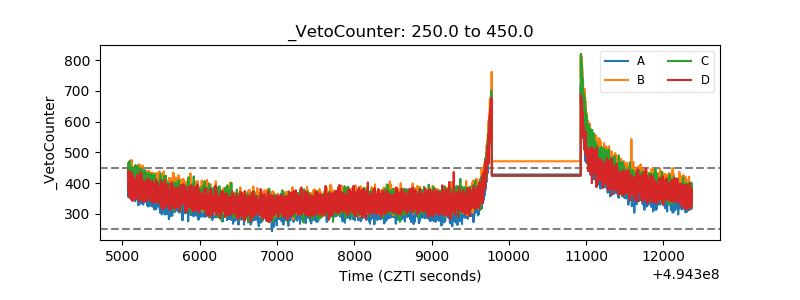 |