| Param | Original file | Final file |
|---|---|---|
| Filename | modeM0/AS1A14_022T05_9000006504_53688cztM0_level2.fits | modeM0/AS1A14_022T05_9000006504_53688cztM0_level2_quad_clean.evt |
| Size (bytes) | 935,674,560 | 69,860,160 |
| Size | 892.3 MB | 66.6 MB |
| Events in quadrant A | 15,131,971 | 97,531 |
| Events in quadrant B | 3,172,401 | 694,638 |
| Events in quadrant C | 11,067,114 | 332,175 |
| Events in quadrant D | 4,775,861 | 550,593 |
| Mode SS | |||
|---|---|---|---|
| Quadrant | BADHDUFLAG | Total packets | Discarded packets |
| A | 0 | 128 | 0 |
| B | 0 | 128 | 0 |
| C | 0 | 128 | 0 |
| D | 0 | 128 | 0 |
| Mode M9 | |||
|---|---|---|---|
| Quadrant | BADHDUFLAG | Total packets | Discarded packets |
| A | 0 | 12 | 0 |
| B | 0 | 12 | 0 |
| C | 0 | 12 | 0 |
| D | 0 | 12 | 0 |
| Mode M0 | |||
|---|---|---|---|
| Quadrant | BADHDUFLAG | Total packets | Discarded packets |
| A | 0 | 49304 | 5 |
| B | 0 | 13696 | 1 |
| C | 0 | 37171 | 1 |
| D | 0 | 18587 | 1 |
| Quadrant | Total seconds | Saturated seconds | Saturation percentage |
|---|---|---|---|
| A | 6308 | 5551 | 87.999366% |
| B | 6308 | 126 | 1.997464% |
| C | 6308 | 3295 | 52.235257% |
| D | 6308 | 440 | 6.975269% |
Noise dominated data is calculated using 1-second bins in cleaned event files. If a bin has >2000 counts, and if more than 50% of those come from <1% of pixels, then it is considered to be noise-dominated and hence unusable.
| Quadrant | # 1 sec bins | Bins with >0 counts | Bins with >2000 counts | High rate bins dominated by noise | Noise dominated (total time) | Noise dominated (detector-on time) | Marked lightcurve |
|---|---|---|---|---|---|---|---|
| A | 7487 | 6307 | 5435 | 5435 | 72.59% | 86.17% | 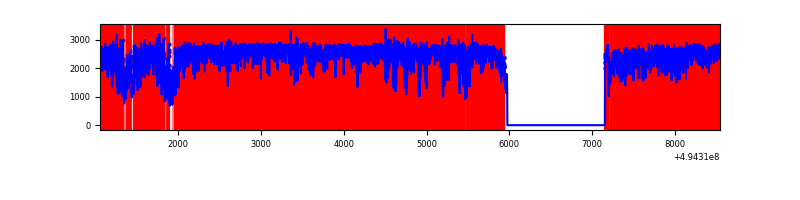 |
| B | 7488 | 6308 | 33 | 33 | 0.44% | 0.52% | 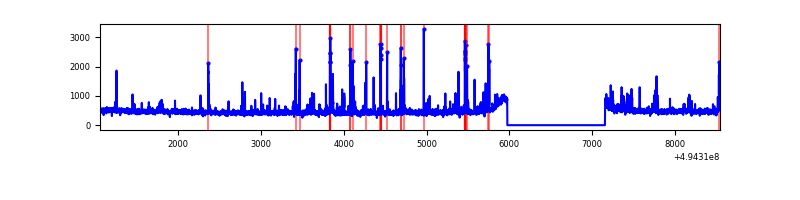 |
| C | 7488 | 6308 | 3011 | 3011 | 40.21% | 47.73% | 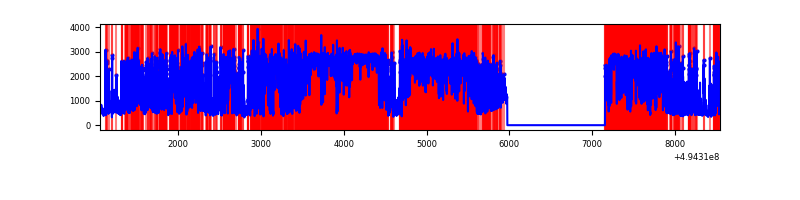 |
| D | 7488 | 6308 | 391 | 391 | 5.22% | 6.20% | 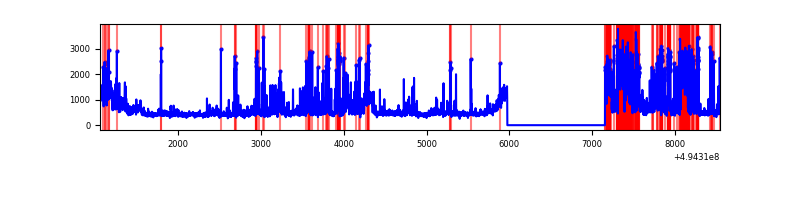 |
Top three noisy pixels from each quadrant. If the there are fewer than three noisy pixels in the level2.evt file, extra rows are filled as -1
| Pixel properties | Quadrant properties | ||||||
|---|---|---|---|---|---|---|---|
| Quadrant | DetID | PixID | Counts | Sigma | Mean | Median | Sigma |
| A | 3 | 63 | 10588754 | 105931.92 | 395 | 386 | 100.0 |
| A | 3 | 78 | 2413850 | 24145.63 | 395 | 386 | 100.0 |
| A | 12 | 17 | 293646 | 2933.94 | 395 | 386 | 100.0 |
| B | 5 | 185 | 262570 | 1696.82 | 713 | 689 | 154.3 |
| B | 12 | 111 | 17664 | 109.99 | 713 | 689 | 154.3 |
| B | 11 | 111 | 16722 | 103.88 | 713 | 689 | 154.3 |
| C | 15 | 224 | 5615134 | 40011.66 | 511 | 507 | 140.3 |
| C | 1 | 241 | 2182322 | 15548.33 | 511 | 507 | 140.3 |
| C | 7 | 64 | 984750 | 7014.04 | 511 | 507 | 140.3 |
| D | 8 | 176 | 1009603 | 5264.41 | 674 | 643 | 191.7 |
| D | 10 | 172 | 285295 | 1485.22 | 674 | 643 | 191.7 |
| D | 2 | 37 | 201850 | 1049.83 | 674 | 643 | 191.7 |
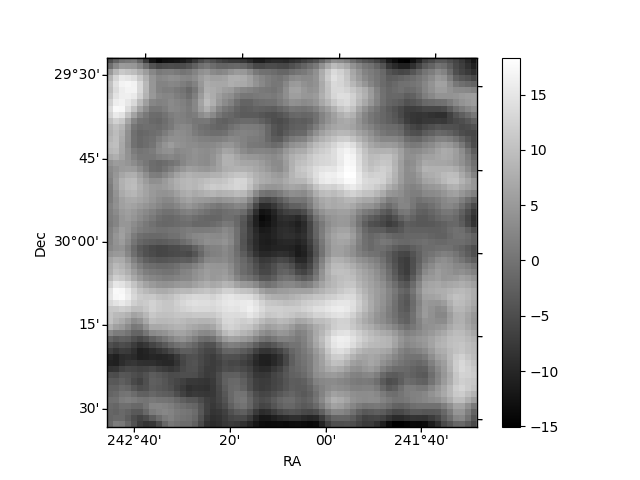
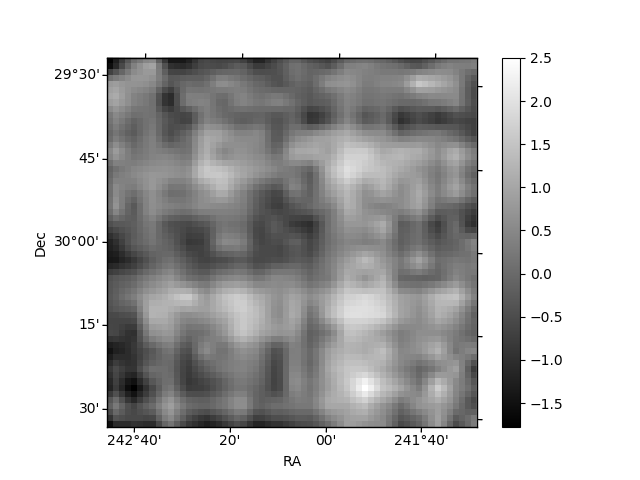
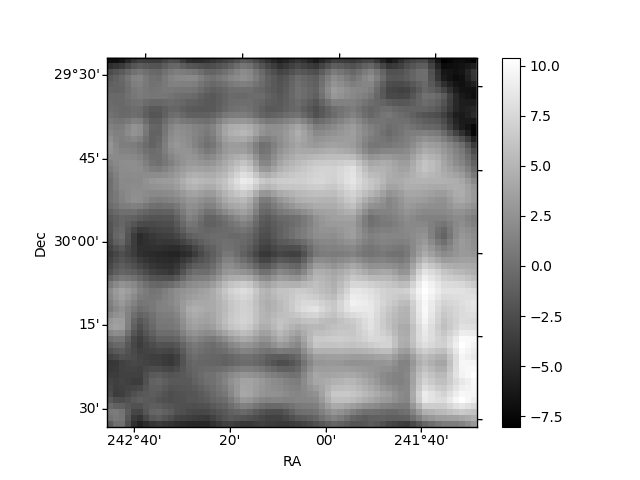
Histogram calculated using DETX and DETY for each event in the final _common_clean file
| Quadrant A | 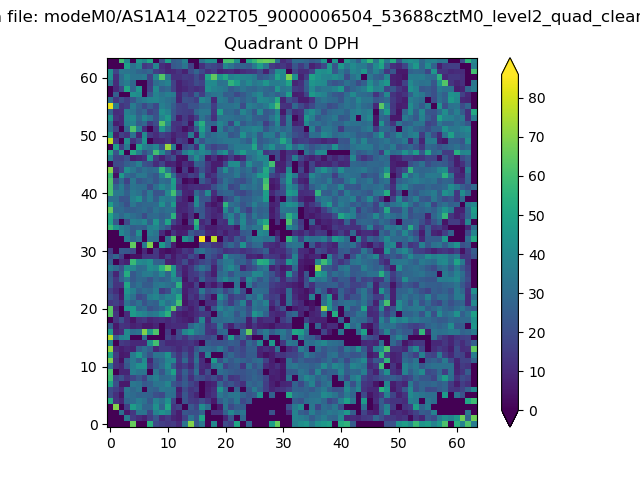 |
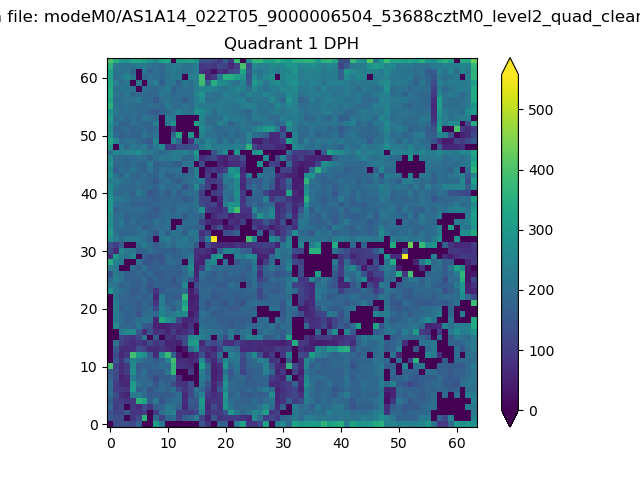 |
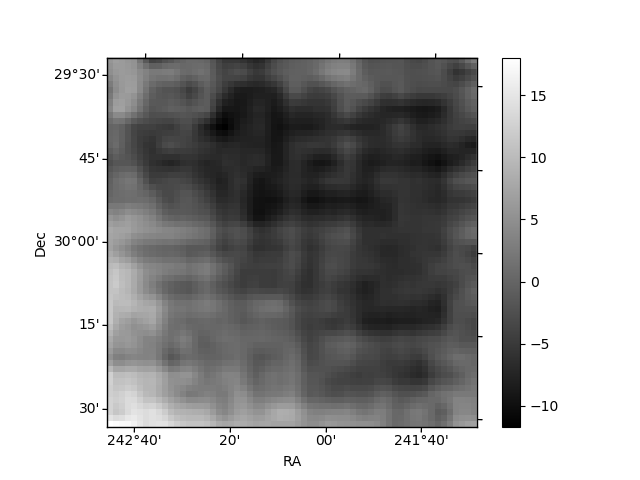
Quadrant B |
|---|---|---|---|
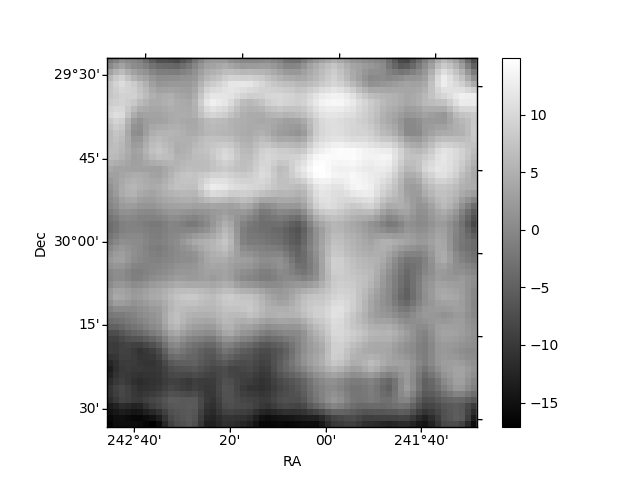
| Quadrant D | 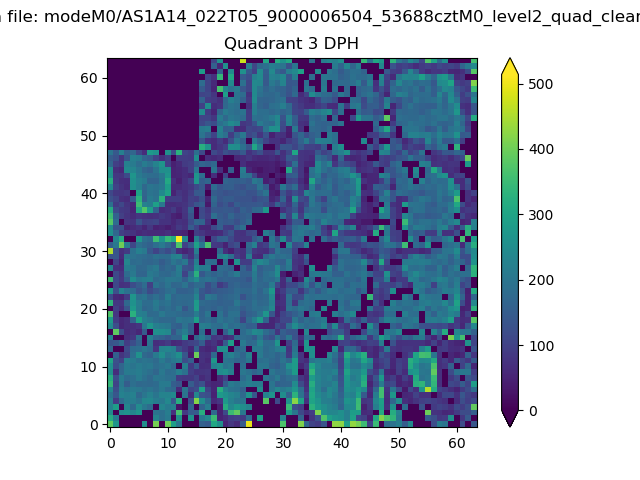 |
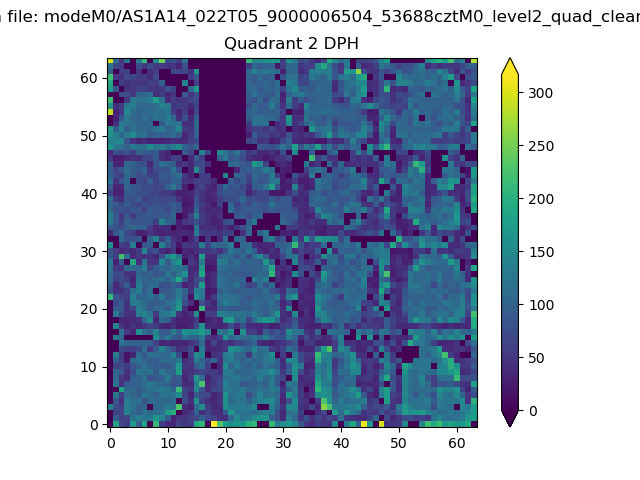 |
Quadrant C |
| Plot type | Count rate plots | Images |
|---|---|---|
| Comparison with Poisson distribution Blue bars denote a histogram of data divided into 1 sec bins. Red curve is a Poisson curve with rate = median count rate of data. |
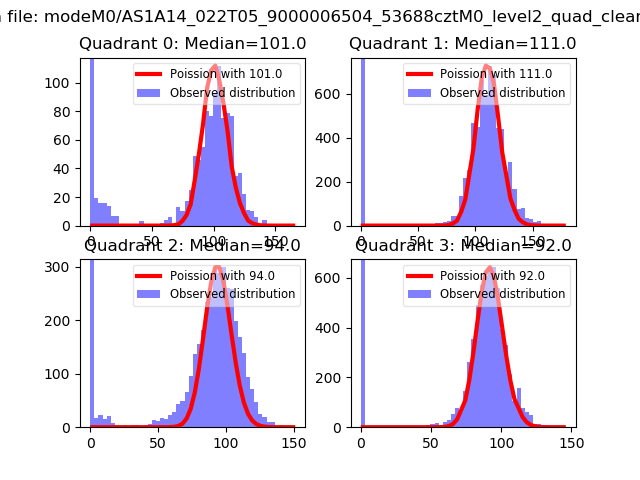 |
 |
| Quadrant-wise count rates Data is divided into 100 sec bins |
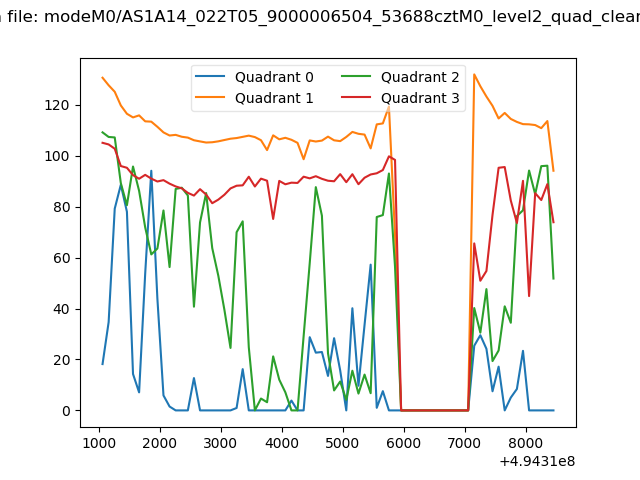 |
|
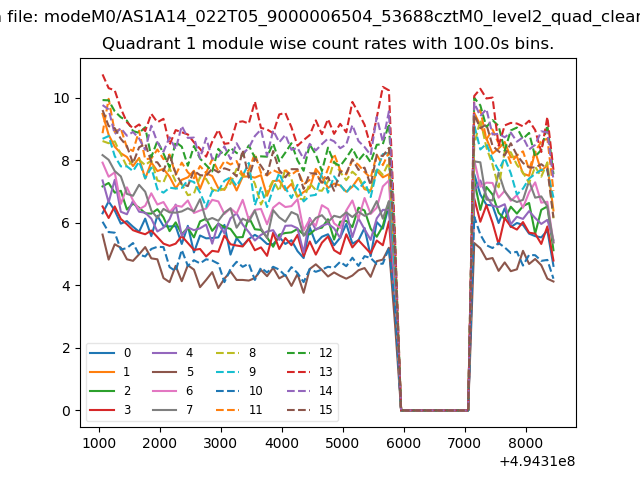
| Module-wise count rates for Quadrant A Data is divided into 100 sec bins |
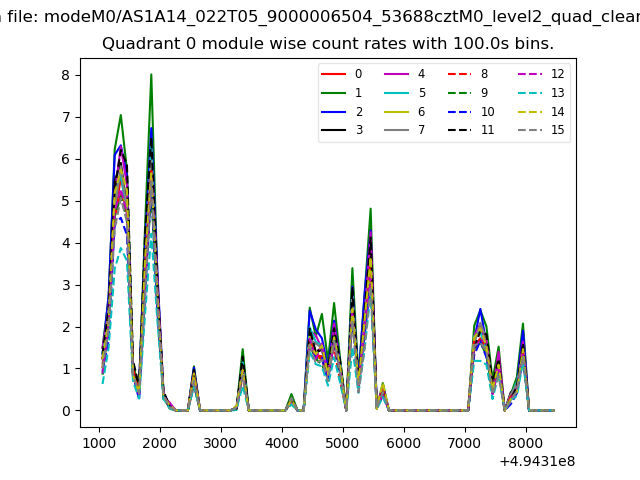 |
 |
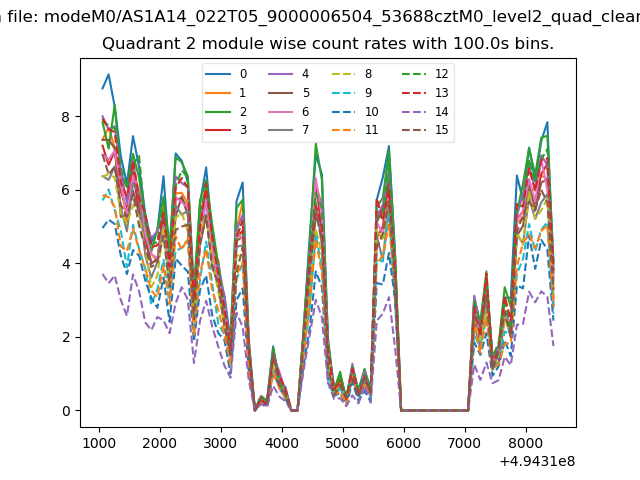
| Module-wise count rates for Quadrant B Data is divided into 100 sec bins |
 |
 |
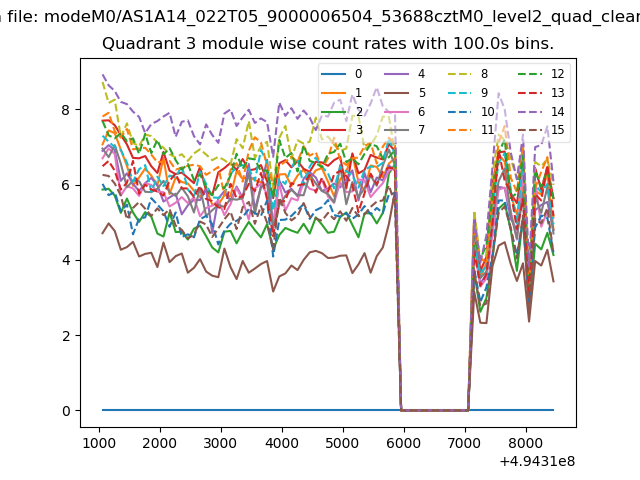
| Module-wise count rates for Quadrant C Data is divided into 100 sec bins |
 |
 |
| Module-wise count rates for Quadrant D Data is divided into 100 sec bins |
 |
 |
| Parameter | Plot |
|---|---|
| CZT HV Monitor | 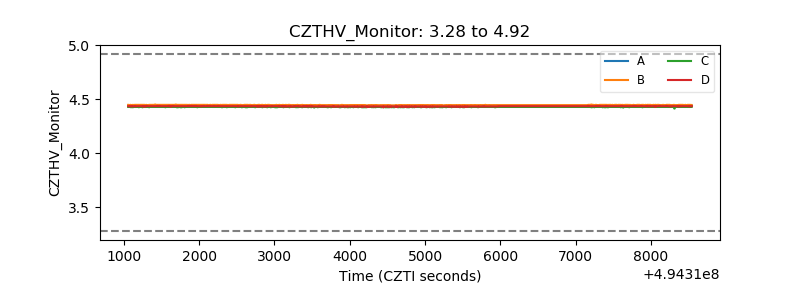 |
| D_VDD | 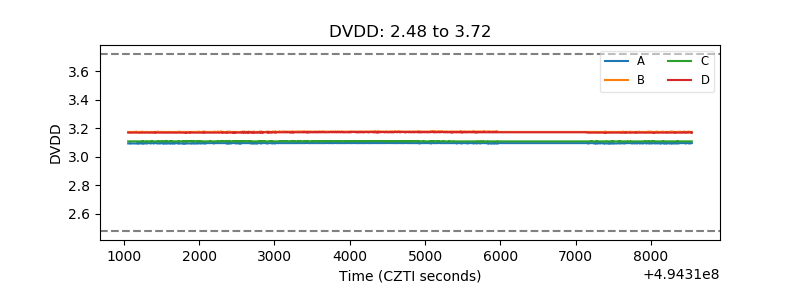 |
| Temperature 1 | 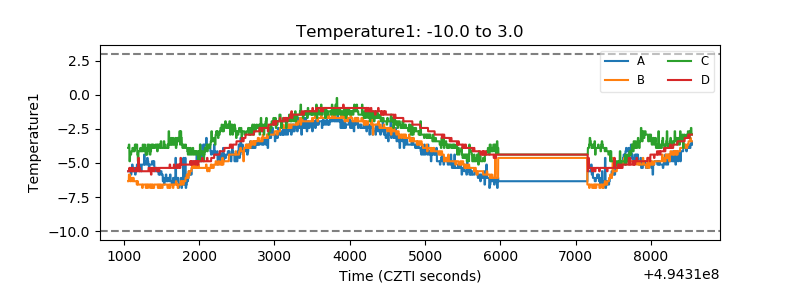 |
| Veto HV Monitor | 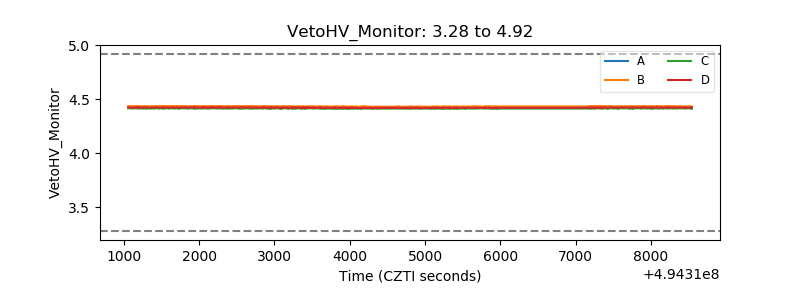 |
| Veto LLD | 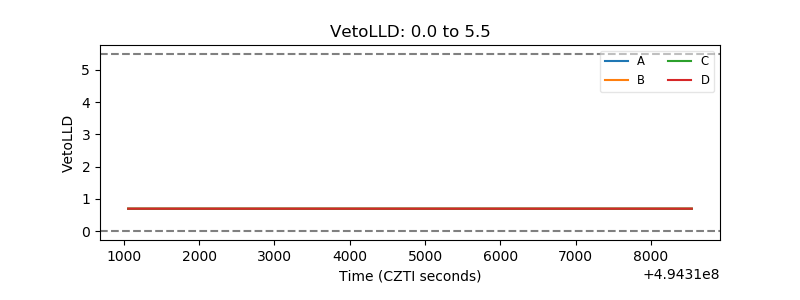 |
| Alpha Counter | 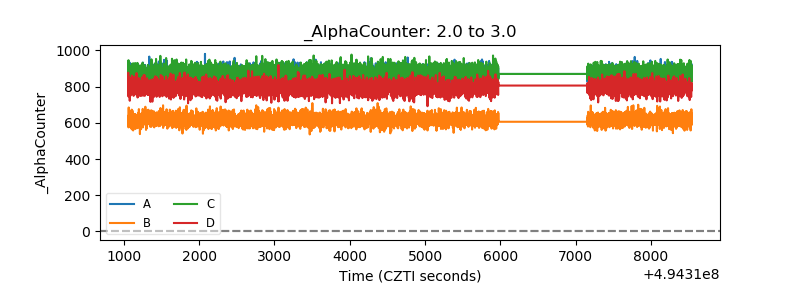 |
| _CPM_Rate | 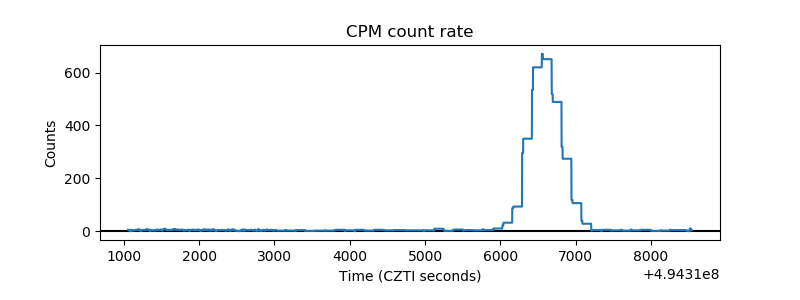 |
| CZT Counter | 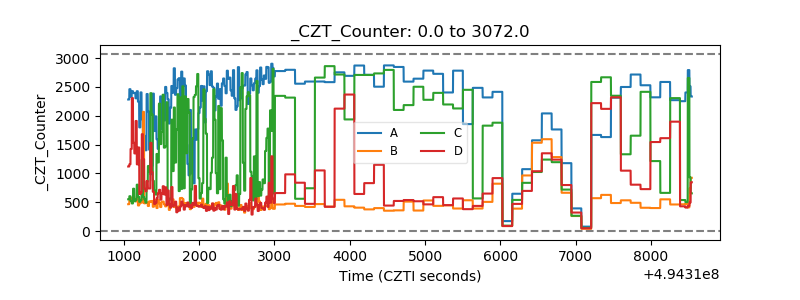 |
| +2.5 Volts monitor | 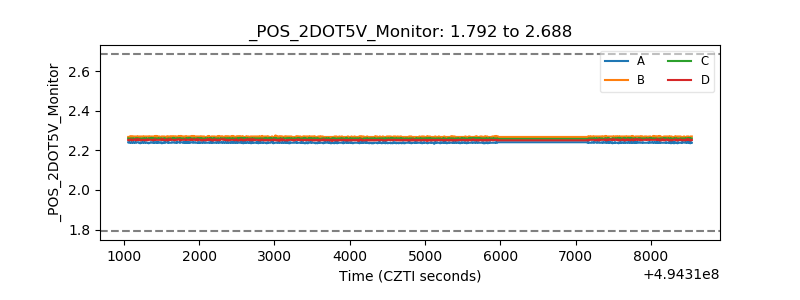 |
| +5 Volts monitor | 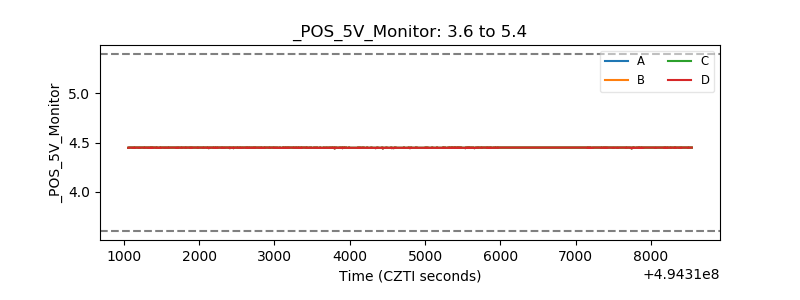 |
| _ROLL_ROT | 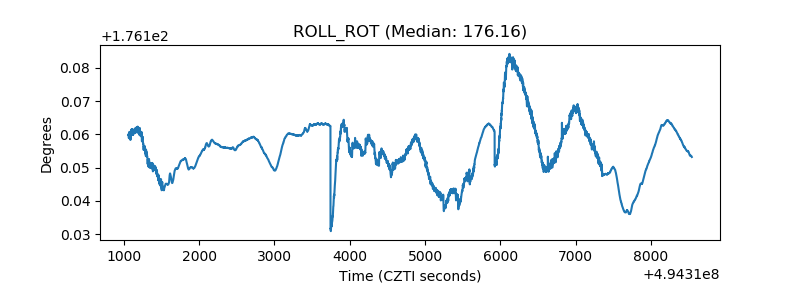 |
| _Roll_DEC | 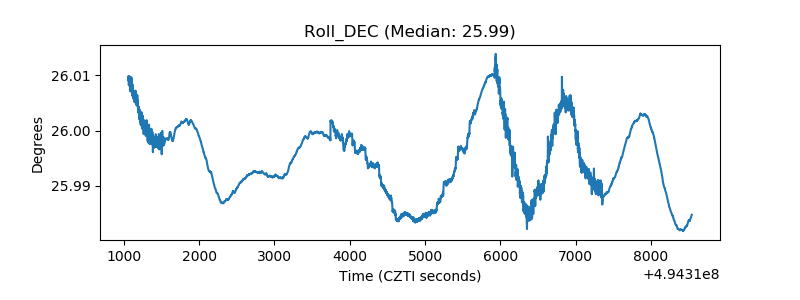 |
| _Roll_RA | 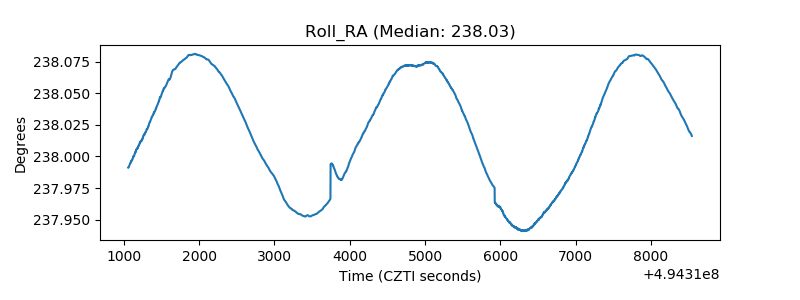 |
| Veto Counter | 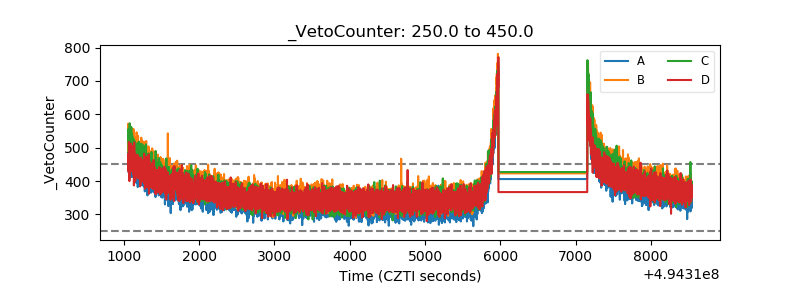 |