| Param | Original file | Final file |
|---|---|---|
| Filename | modeM0/AS1A14_022T05_9000006504_53690cztM0_level2.fits | modeM0/AS1A14_022T05_9000006504_53690cztM0_level2_quad_clean.evt |
| Size (bytes) | 889,885,440 | 74,390,400 |
| Size | 848.7 MB | 70.9 MB |
| Events in quadrant A | 11,830,361 | 301,143 |
| Events in quadrant B | 3,741,509 | 646,991 |
| Events in quadrant C | 11,110,238 | 340,205 |
| Events in quadrant D | 5,773,068 | 525,600 |
| Mode SS | |||
|---|---|---|---|
| Quadrant | BADHDUFLAG | Total packets | Discarded packets |
| A | 0 | 126 | 0 |
| B | 0 | 126 | 0 |
| C | 0 | 126 | 0 |
| D | 0 | 126 | 0 |
| Mode M9 | |||
|---|---|---|---|
| Quadrant | BADHDUFLAG | Total packets | Discarded packets |
| A | 0 | 10 | 0 |
| B | 0 | 10 | 0 |
| C | 0 | 10 | 0 |
| D | 0 | 10 | 0 |
| Mode M0 | |||
|---|---|---|---|
| Quadrant | BADHDUFLAG | Total packets | Discarded packets |
| A | 0 | 39461 | 1 |
| B | 0 | 15335 | 1 |
| C | 0 | 37334 | 1 |
| D | 0 | 21526 | 2 |
| Quadrant | Total seconds | Saturated seconds | Saturation percentage |
|---|---|---|---|
| A | 6284 | 3542 | 56.365372% |
| B | 6284 | 292 | 4.646722% |
| C | 6285 | 2999 | 47.716786% |
| D | 6284 | 560 | 8.911521% |
Noise dominated data is calculated using 1-second bins in cleaned event files. If a bin has >2000 counts, and if more than 50% of those come from <1% of pixels, then it is considered to be noise-dominated and hence unusable.
| Quadrant | # 1 sec bins | Bins with >0 counts | Bins with >2000 counts | High rate bins dominated by noise | Noise dominated (total time) | Noise dominated (detector-on time) | Marked lightcurve |
|---|---|---|---|---|---|---|---|
| A | 7218 | 6283 | 3238 | 3238 | 44.86% | 51.54% | 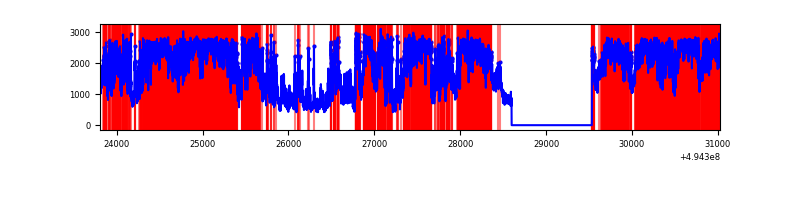 |
| B | 7219 | 6284 | 82 | 82 | 1.14% | 1.30% | 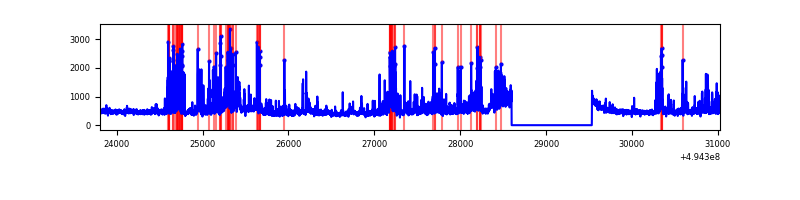 |
| C | 7220 | 6285 | 2857 | 2857 | 39.57% | 45.46% | 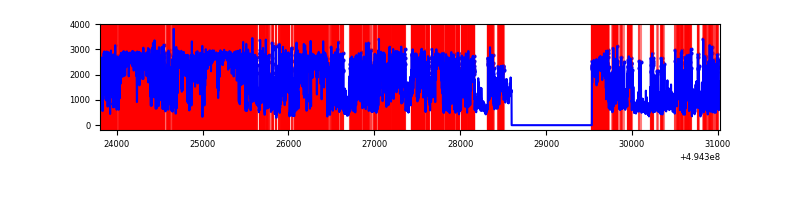 |
| D | 7219 | 6284 | 497 | 497 | 6.88% | 7.91% | 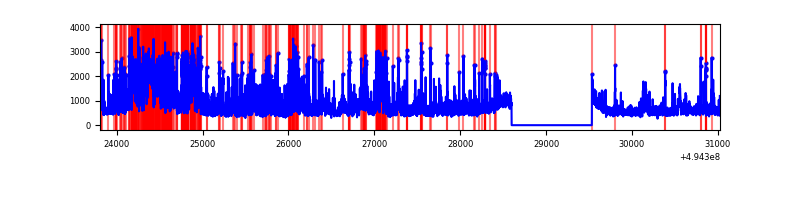 |
Top three noisy pixels from each quadrant. If the there are fewer than three noisy pixels in the level2.evt file, extra rows are filled as -1
| Pixel properties | Quadrant properties | ||||||
|---|---|---|---|---|---|---|---|
| Quadrant | DetID | PixID | Counts | Sigma | Mean | Median | Sigma |
| A | 3 | 63 | 9188964 | 65738.59 | 563 | 550 | 139.8 |
| A | 3 | 78 | 223417 | 1594.5 | 563 | 550 | 139.8 |
| A | 12 | 17 | 62753 | 445.03 | 563 | 550 | 139.8 |
| B | 5 | 185 | 683616 | 4673.04 | 683 | 661 | 146.1 |
| B | 7 | 0 | 80445 | 545.91 | 683 | 661 | 146.1 |
| B | 15 | 32 | 67728 | 458.9 | 683 | 661 | 146.1 |
| C | 15 | 224 | 3532135 | 24867.29 | 514 | 510 | 142.0 |
| C | 1 | 241 | 2500232 | 17601.33 | 514 | 510 | 142.0 |
| C | 7 | 64 | 1765021 | 12424.48 | 514 | 510 | 142.0 |
| D | 8 | 176 | 1181848 | 6214.21 | 667 | 639 | 190.1 |
| D | 2 | 62 | 512143 | 2690.96 | 667 | 639 | 190.1 |
| D | 11 | 245 | 397092 | 2085.69 | 667 | 639 | 190.1 |
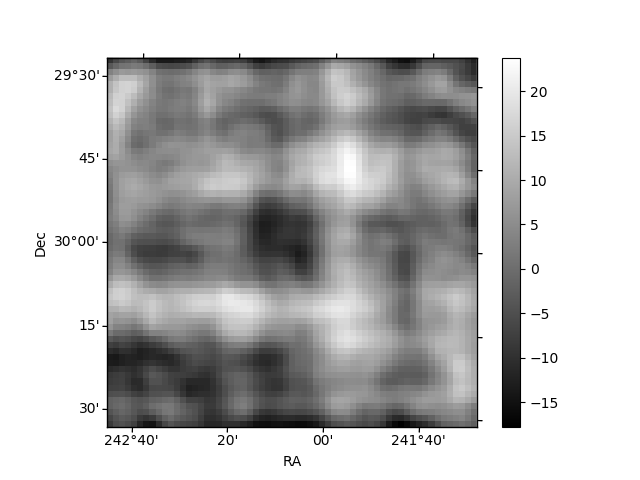
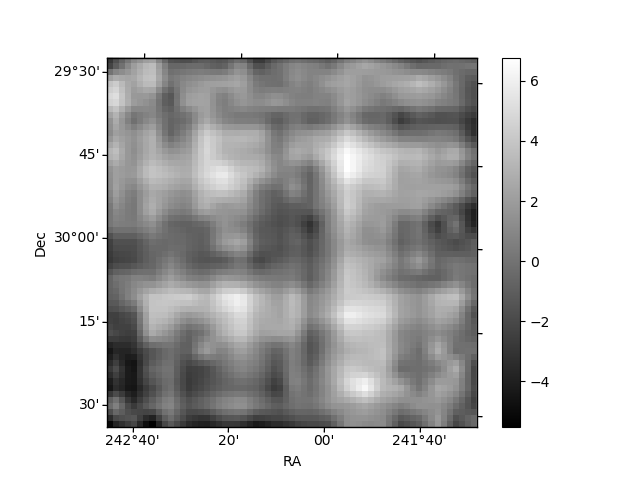
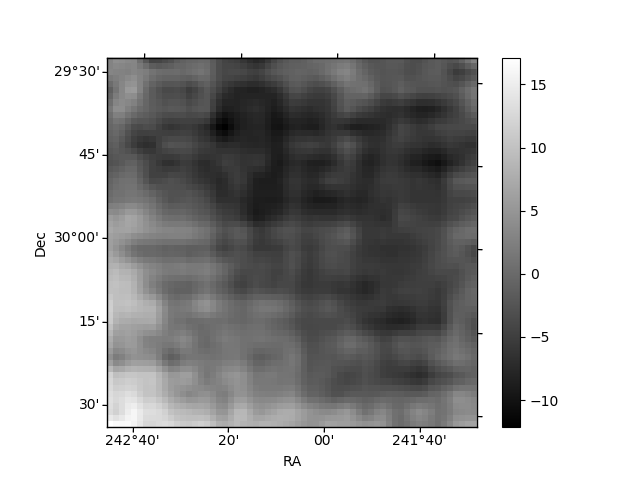
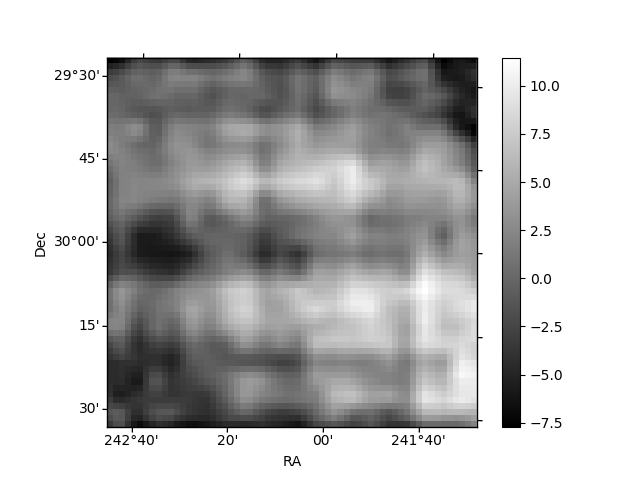
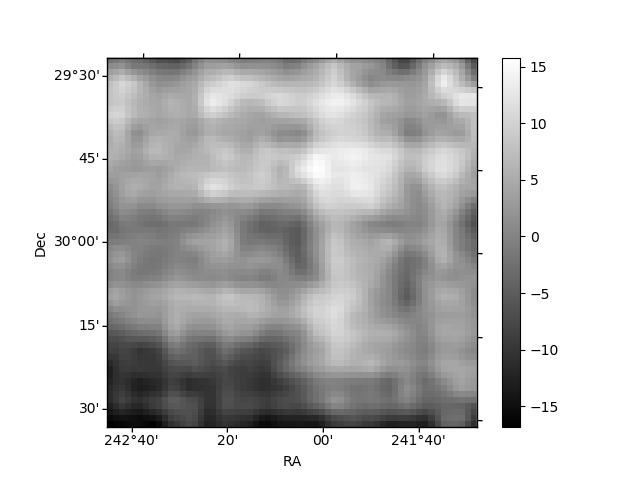
Histogram calculated using DETX and DETY for each event in the final _common_clean file
| Quadrant A | 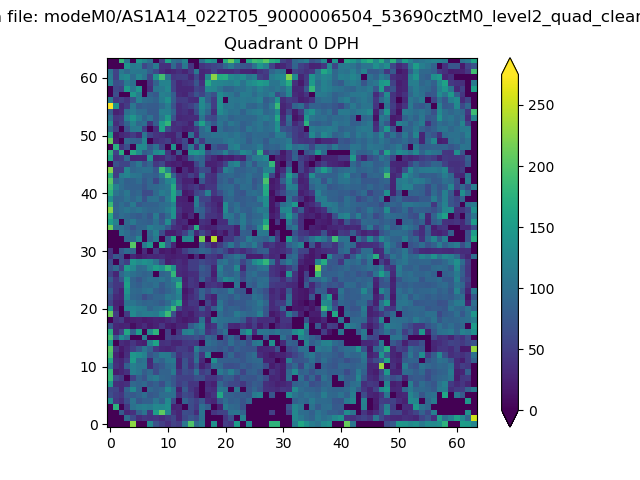 |
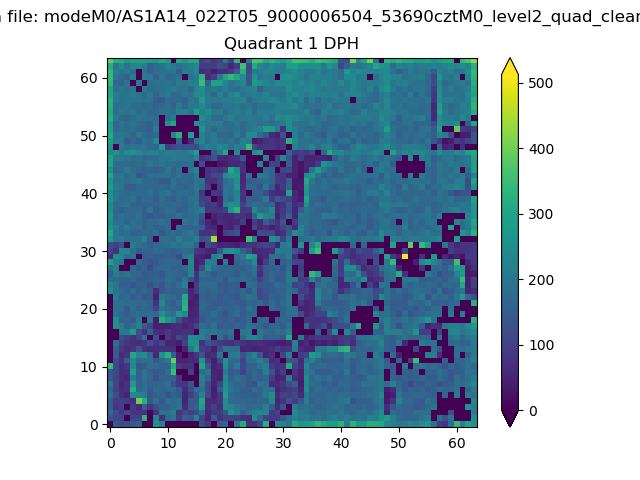 |
Quadrant B |
|---|---|---|---|
| Quadrant D | 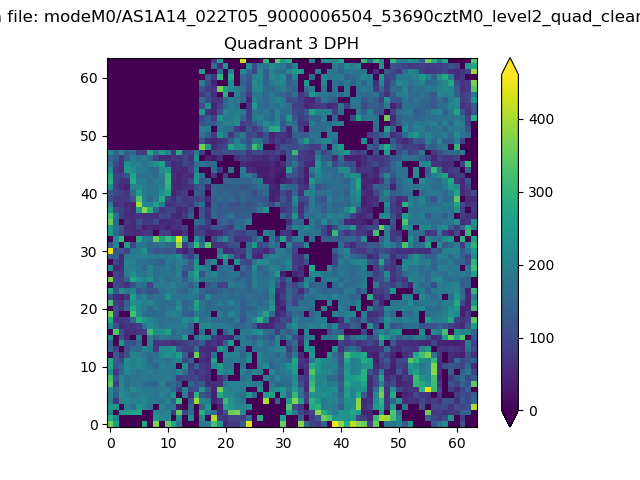 |
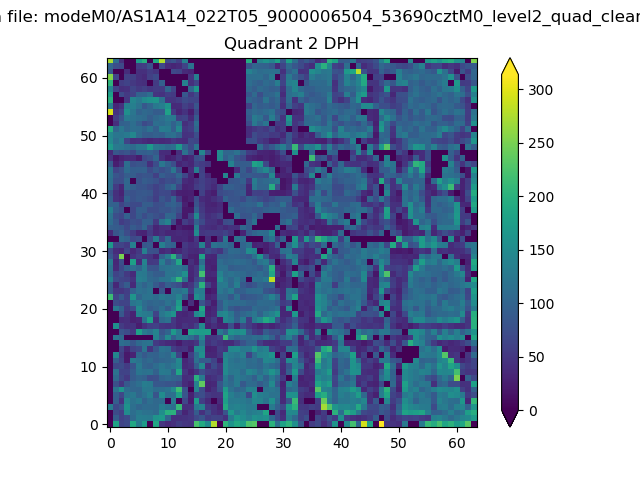 |
Quadrant C |
| Plot type | Count rate plots | Images |
|---|---|---|
| Comparison with Poisson distribution Blue bars denote a histogram of data divided into 1 sec bins. Red curve is a Poisson curve with rate = median count rate of data. |
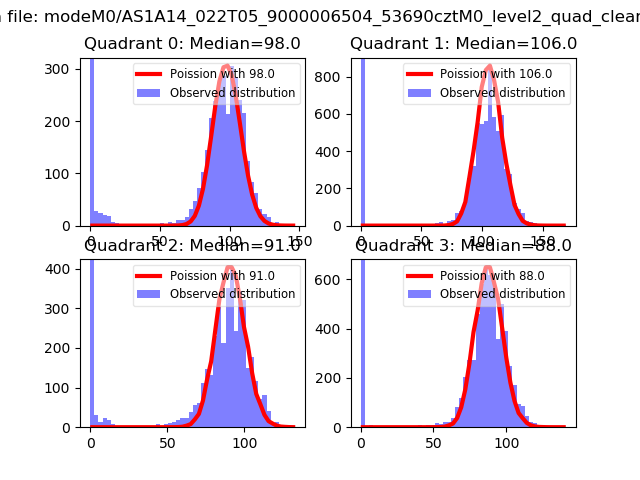 |
 |
| Quadrant-wise count rates Data is divided into 100 sec bins |
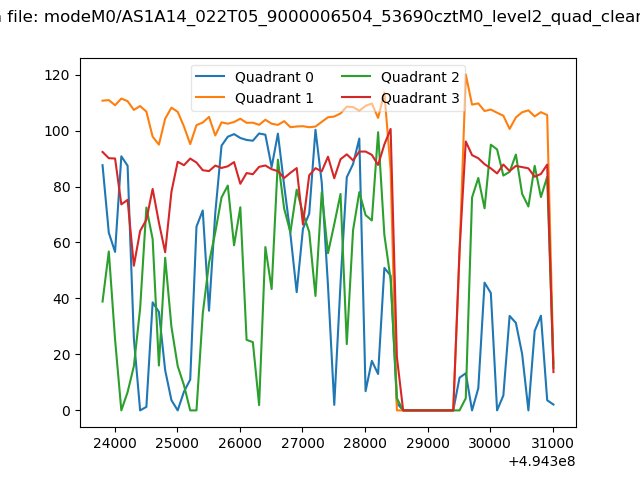 |
|
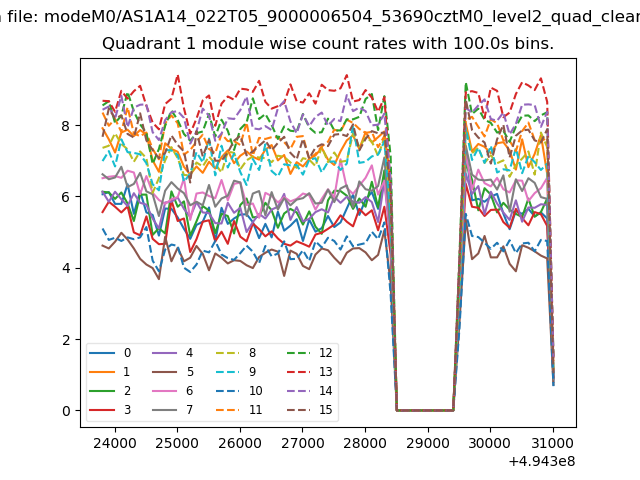
| Module-wise count rates for Quadrant A Data is divided into 100 sec bins |
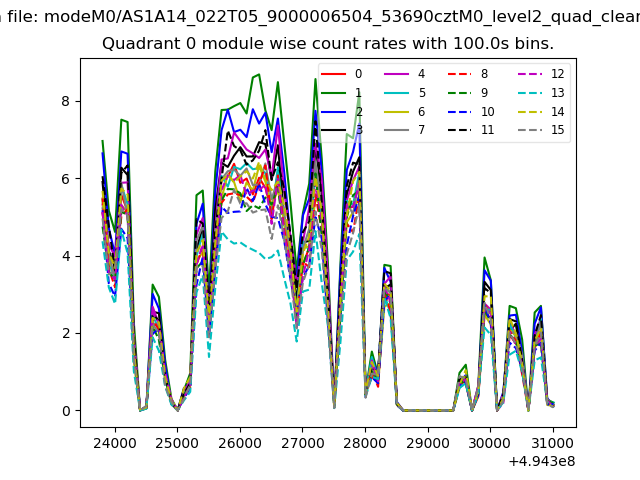 |
 |
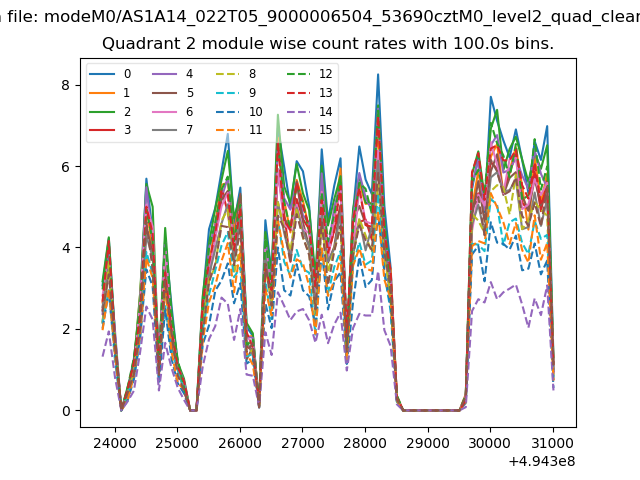
| Module-wise count rates for Quadrant B Data is divided into 100 sec bins |
 |
 |
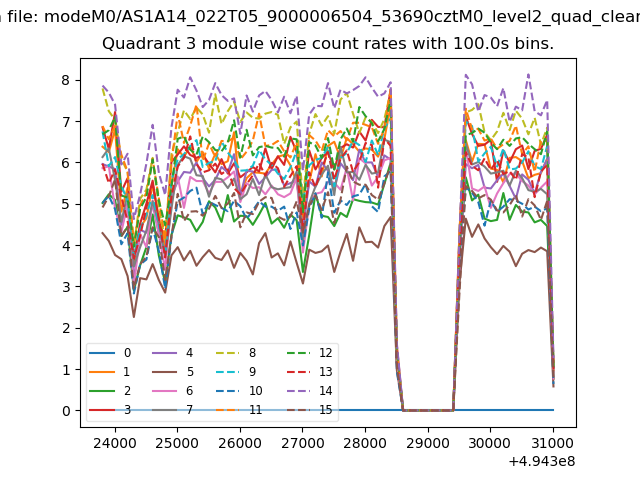
| Module-wise count rates for Quadrant C Data is divided into 100 sec bins |
 |
 |
| Module-wise count rates for Quadrant D Data is divided into 100 sec bins |
 |
 |
| Parameter | Plot |
|---|---|
| CZT HV Monitor |  |
| D_VDD | 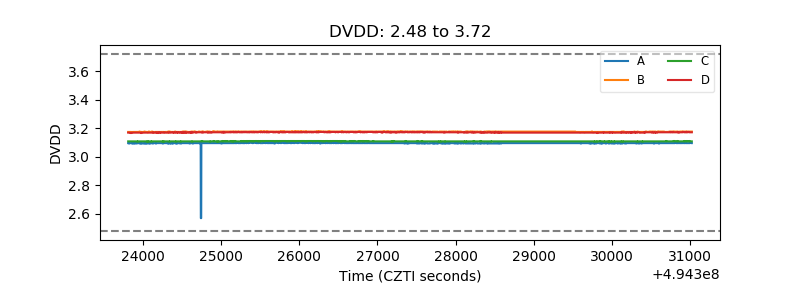 |
| Temperature 1 | 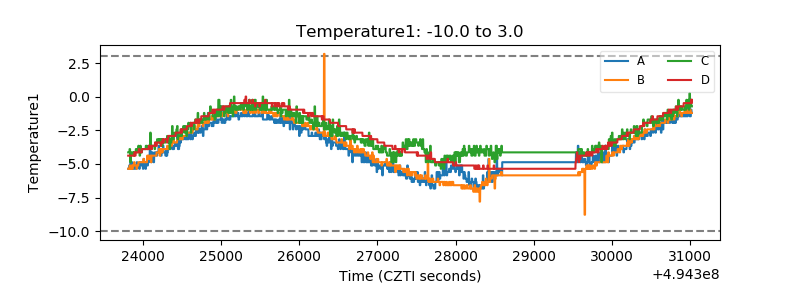 |
| Veto HV Monitor | 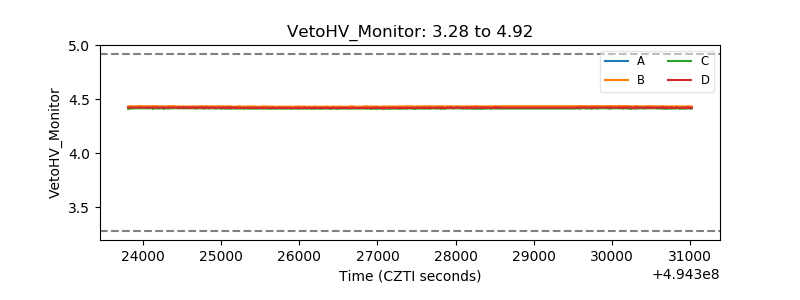 |
| Veto LLD | 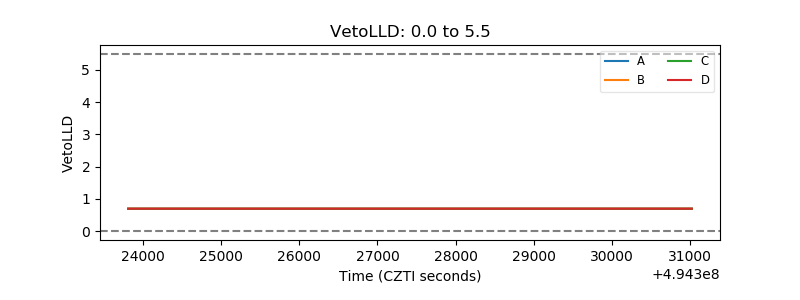 |
| Alpha Counter | 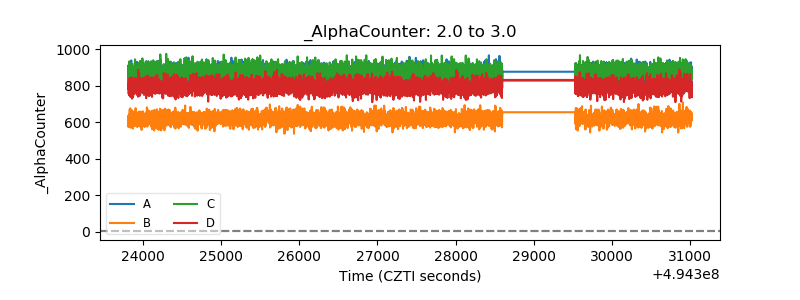 |
| _CPM_Rate | 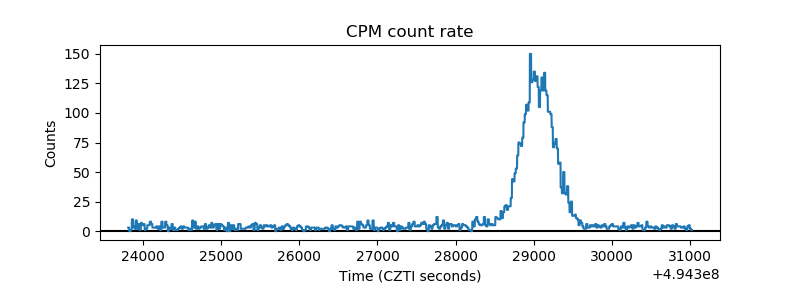 |
| CZT Counter | 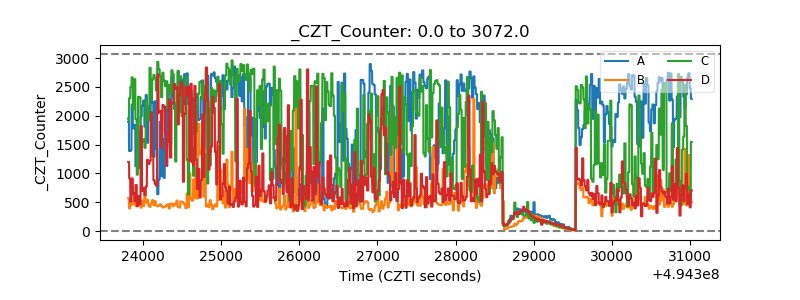 |
| +2.5 Volts monitor |  |
| +5 Volts monitor |  |
| _ROLL_ROT | 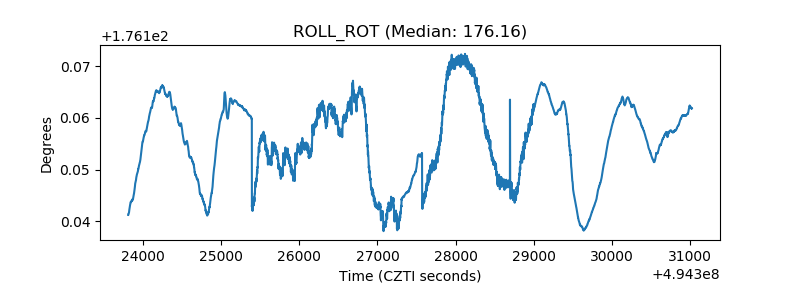 |
| _Roll_DEC | 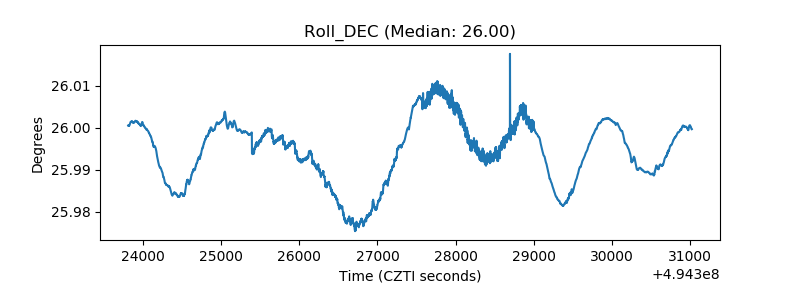 |
| _Roll_RA | 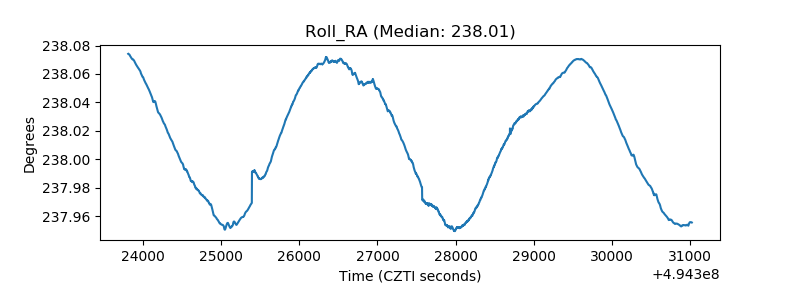 |
| Veto Counter | 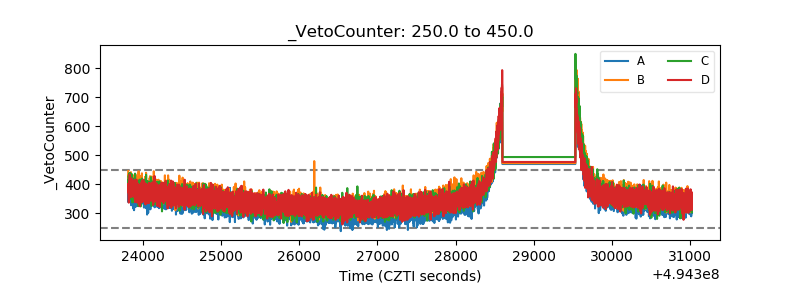 |