| Param | Original file | Final file |
|---|---|---|
| Filename | modeM0/AS1A14_022T05_9000006504_53692cztM0_level2.fits | modeM0/AS1A14_022T05_9000006504_53692cztM0_level2_quad_clean.evt |
| Size (bytes) | 994,832,640 | 84,778,560 |
| Size | 948.7 MB | 80.9 MB |
| Events in quadrant A | 14,551,803 | 289,981 |
| Events in quadrant B | 5,188,578 | 705,912 |
| Events in quadrant C | 10,887,177 | 482,353 |
| Events in quadrant D | 5,633,132 | 579,519 |
| Mode SS | |||
|---|---|---|---|
| Quadrant | BADHDUFLAG | Total packets | Discarded packets |
| A | 0 | 146 | 0 |
| B | 0 | 146 | 0 |
| C | 0 | 146 | 0 |
| D | 0 | 146 | 0 |
| Mode M0 | |||
|---|---|---|---|
| Quadrant | BADHDUFLAG | Total packets | Discarded packets |
| A | 0 | 48311 | 0 |
| B | 0 | 20549 | 0 |
| C | 0 | 37423 | 2 |
| D | 0 | 21686 | 0 |
| Quadrant | Total seconds | Saturated seconds | Saturation percentage |
|---|---|---|---|
| A | 7310 | 4533 | 62.010944% |
| B | 7310 | 574 | 7.852257% |
| C | 7310 | 2457 | 33.611491% |
| D | 7310 | 709 | 9.699042% |
Noise dominated data is calculated using 1-second bins in cleaned event files. If a bin has >2000 counts, and if more than 50% of those come from <1% of pixels, then it is considered to be noise-dominated and hence unusable.
| Quadrant | # 1 sec bins | Bins with >0 counts | Bins with >2000 counts | High rate bins dominated by noise | Noise dominated (total time) | Noise dominated (detector-on time) | Marked lightcurve |
|---|---|---|---|---|---|---|---|
| A | 7310 | 7310 | 4468 | 4468 | 61.12% | 61.12% | 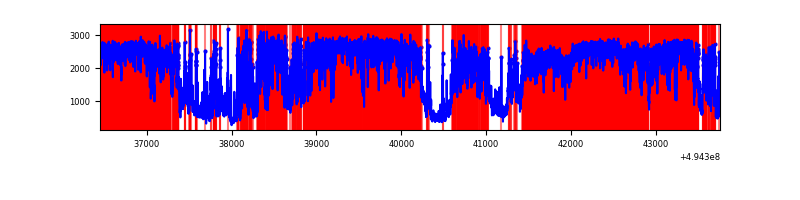 |
| B | 7310 | 7310 | 249 | 249 | 3.41% | 3.41% | 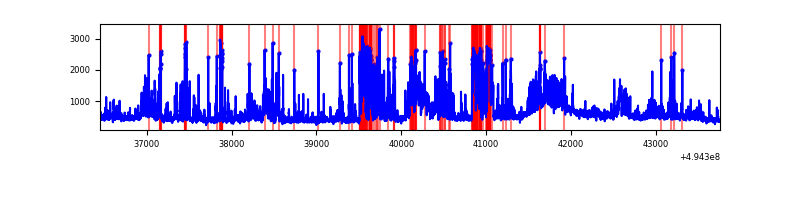 |
| C | 7310 | 7310 | 2268 | 2268 | 31.03% | 31.03% | 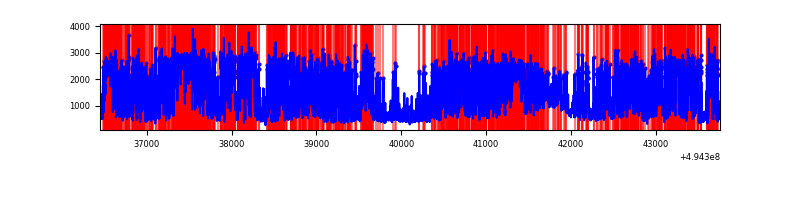 |
| D | 7310 | 7310 | 584 | 584 | 7.99% | 7.99% | 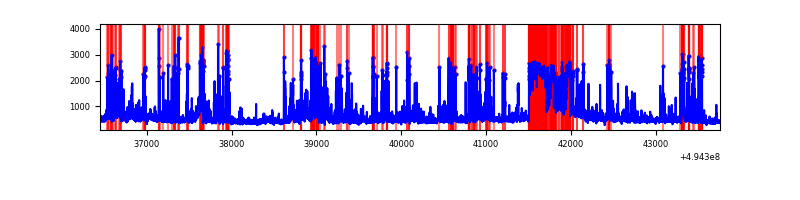 |
Top three noisy pixels from each quadrant. If the there are fewer than three noisy pixels in the level2.evt file, extra rows are filled as -1
| Pixel properties | Quadrant properties | ||||||
|---|---|---|---|---|---|---|---|
| Quadrant | DetID | PixID | Counts | Sigma | Mean | Median | Sigma |
| A | 3 | 63 | 9849793 | 70374.02 | 558 | 543 | 140.0 |
| A | 3 | 78 | 1787844 | 12770.47 | 558 | 543 | 140.0 |
| A | 12 | 17 | 364599 | 2601.22 | 558 | 543 | 140.0 |
| B | 5 | 185 | 1567366 | 9188.51 | 784 | 755 | 170.5 |
| B | 7 | 0 | 242131 | 1415.72 | 784 | 755 | 170.5 |
| B | 0 | 171 | 39782 | 228.9 | 784 | 755 | 170.5 |
| C | 15 | 224 | 5190193 | 27709.02 | 680 | 677 | 187.3 |
| C | 1 | 241 | 864870 | 4614.29 | 680 | 677 | 187.3 |
| C | 7 | 64 | 616105 | 3286.03 | 680 | 677 | 187.3 |
| D | 10 | 118 | 963289 | 4615.9 | 729 | 697 | 208.5 |
| D | 7 | 70 | 408868 | 1957.3 | 729 | 697 | 208.5 |
| D | 2 | 153 | 320472 | 1533.41 | 729 | 697 | 208.5 |
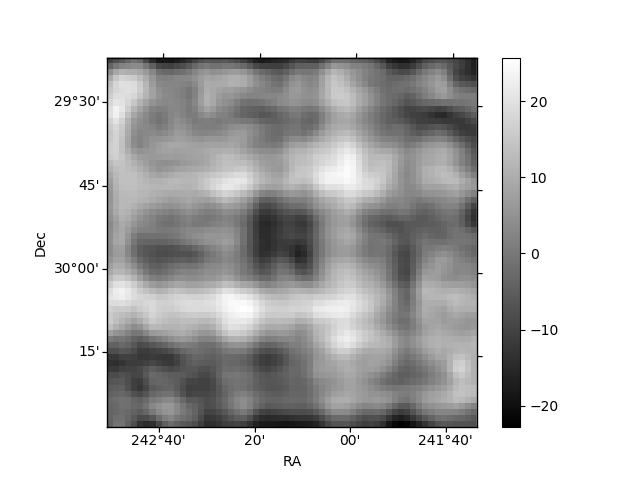
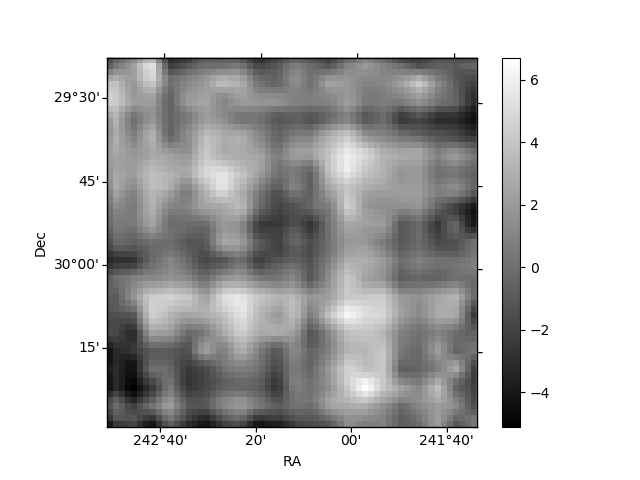
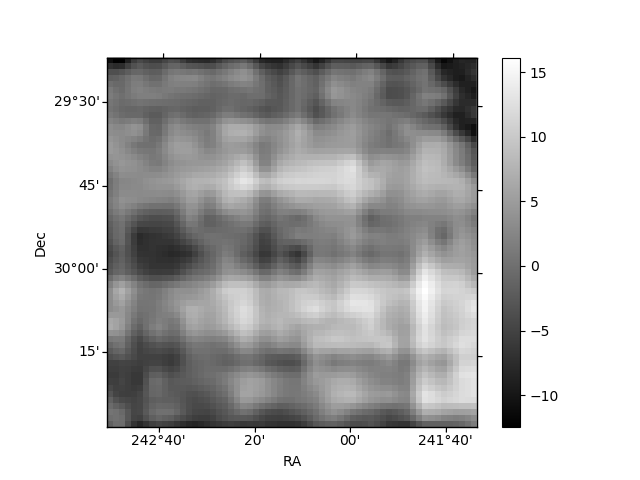
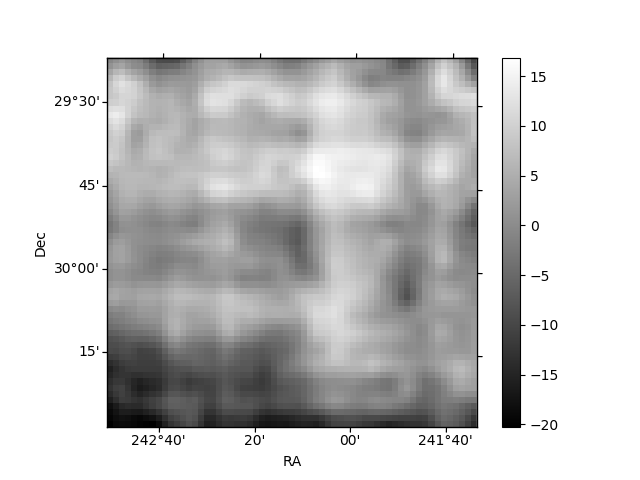
Histogram calculated using DETX and DETY for each event in the final _common_clean file
| Quadrant A | 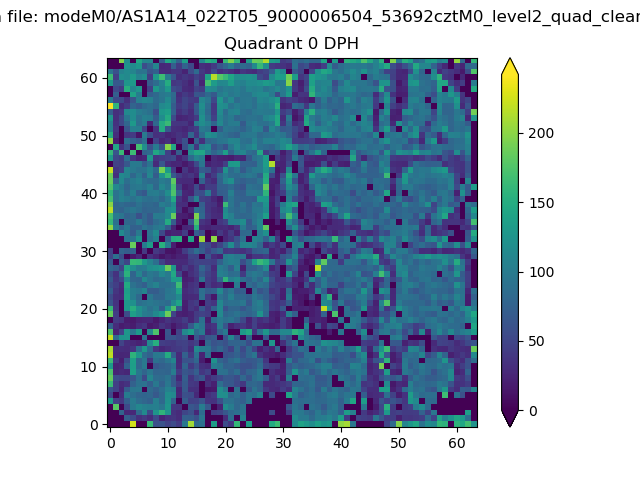 |
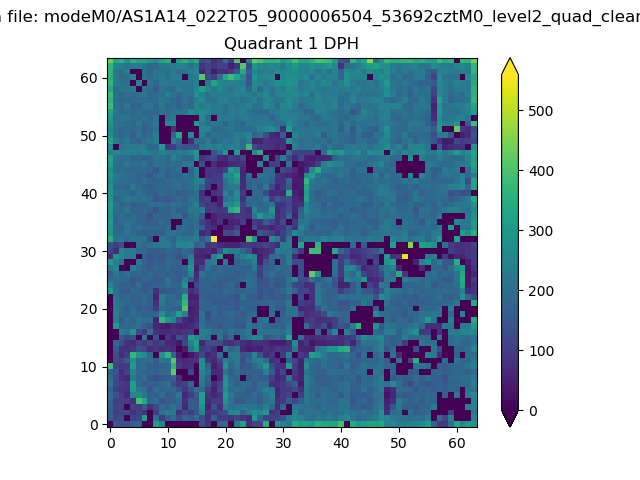 |
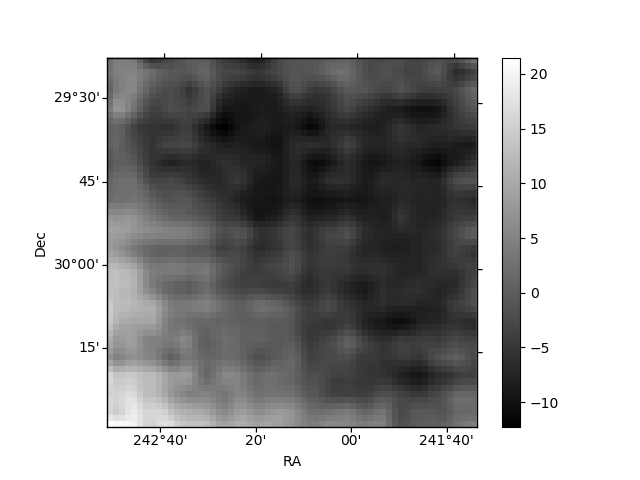
Quadrant B |
|---|---|---|---|
| Quadrant D | 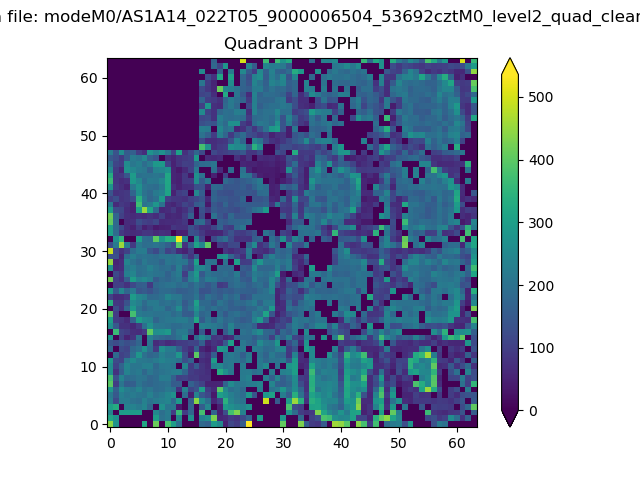 |
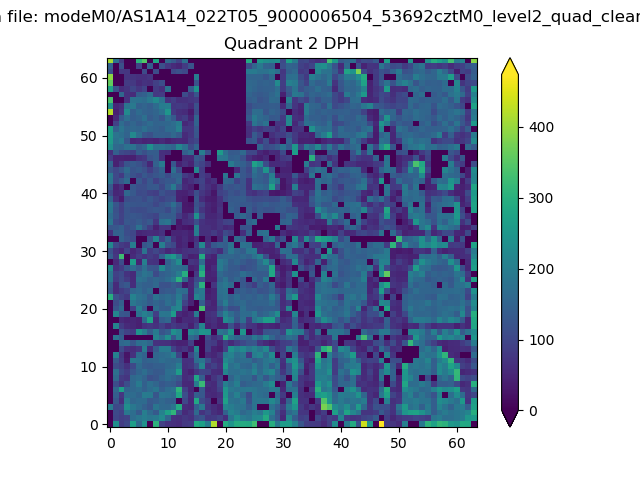 |
Quadrant C |
| Plot type | Count rate plots | Images |
|---|---|---|
| Comparison with Poisson distribution Blue bars denote a histogram of data divided into 1 sec bins. Red curve is a Poisson curve with rate = median count rate of data. |
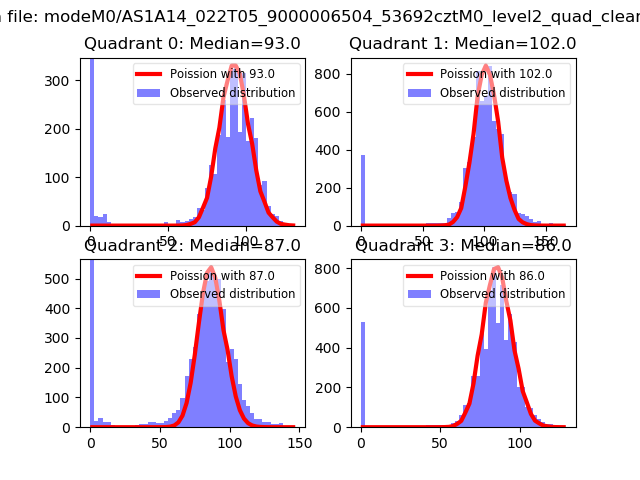 |
 |
| Quadrant-wise count rates Data is divided into 100 sec bins |
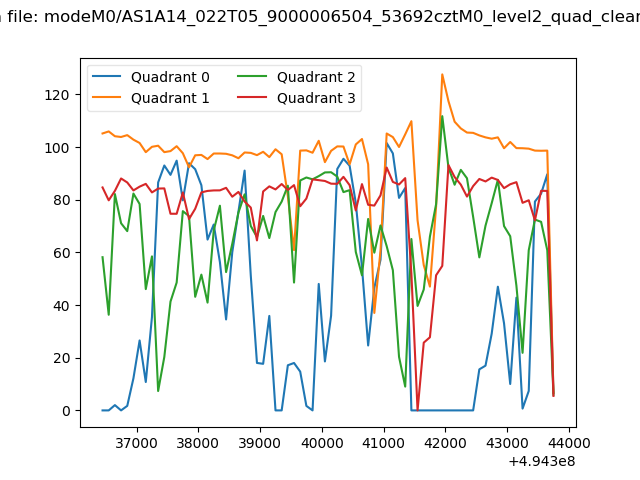 |
|
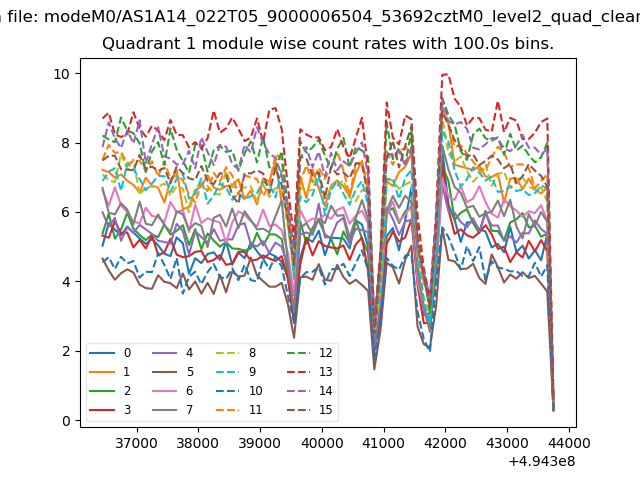
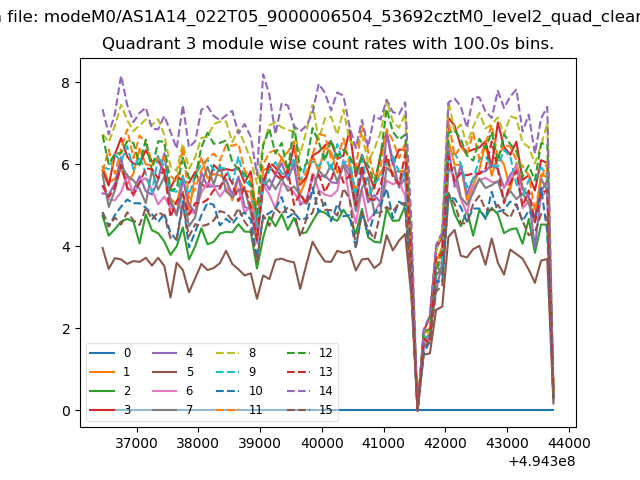
| Module-wise count rates for Quadrant A Data is divided into 100 sec bins |
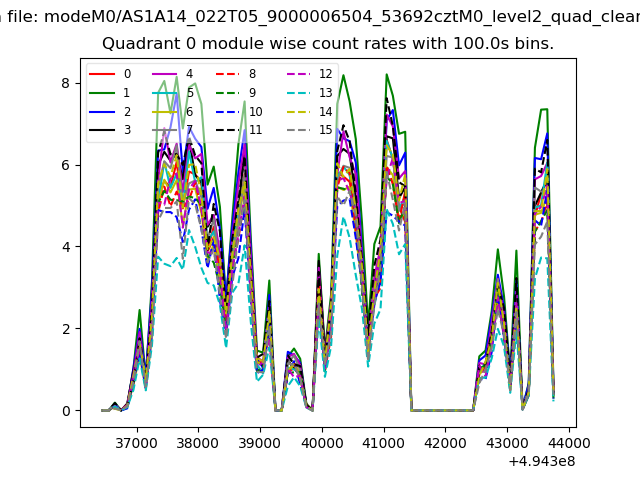 |
 |
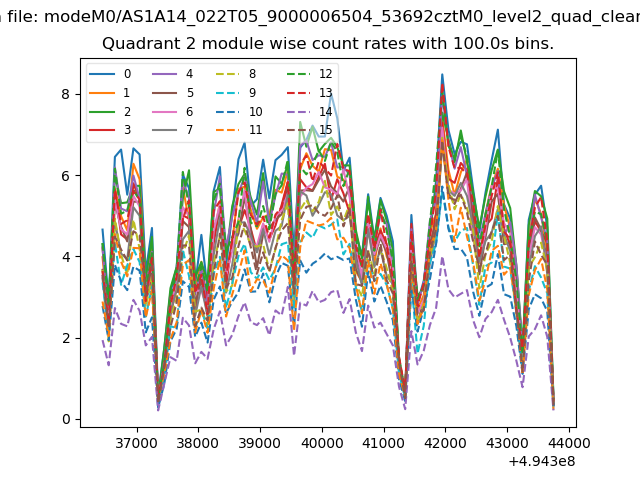
| Module-wise count rates for Quadrant B Data is divided into 100 sec bins |
 |
 |
| Module-wise count rates for Quadrant C Data is divided into 100 sec bins |
 |
 |
| Module-wise count rates for Quadrant D Data is divided into 100 sec bins |
 |
 |
| Parameter | Plot |
|---|---|
| CZT HV Monitor | 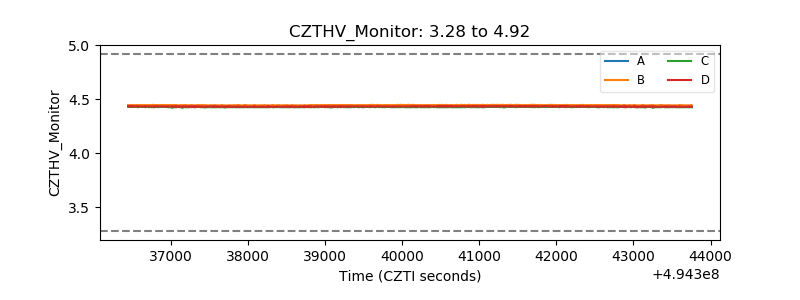 |
| D_VDD | 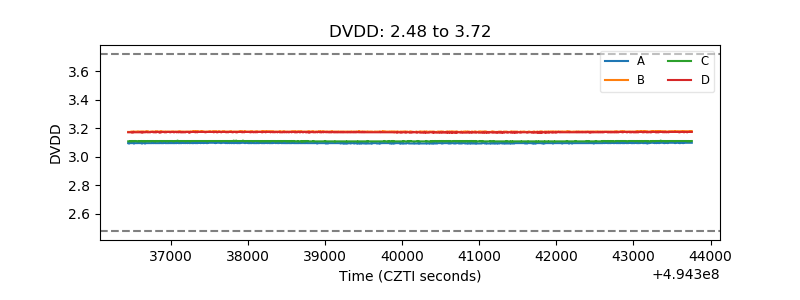 |
| Temperature 1 |  |
| Veto HV Monitor | 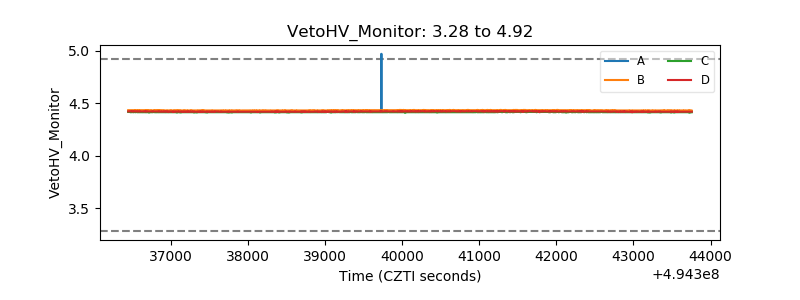 |
| Veto LLD | 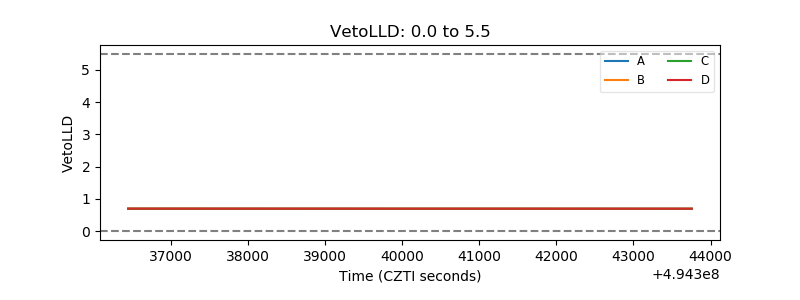 |
| Alpha Counter | 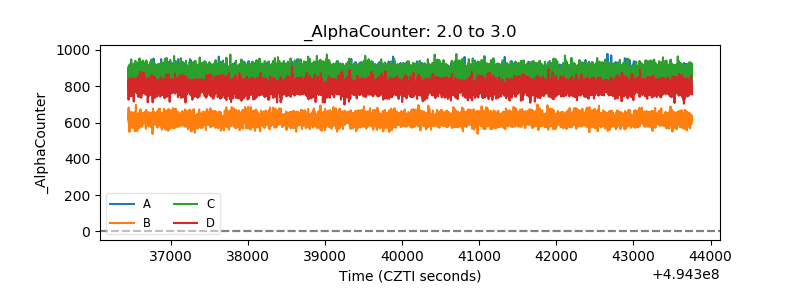 |
| _CPM_Rate | 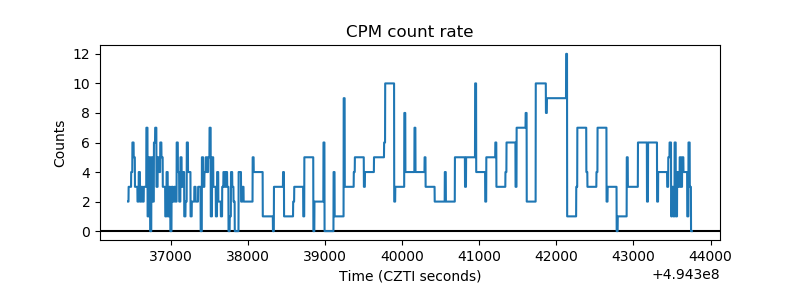 |
| CZT Counter | 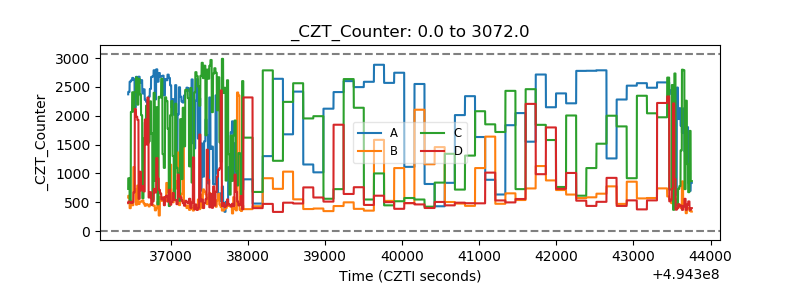 |
| +2.5 Volts monitor |  |
| +5 Volts monitor | 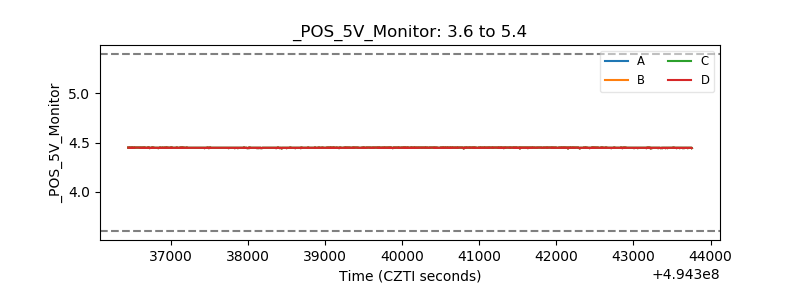 |
| _ROLL_ROT | 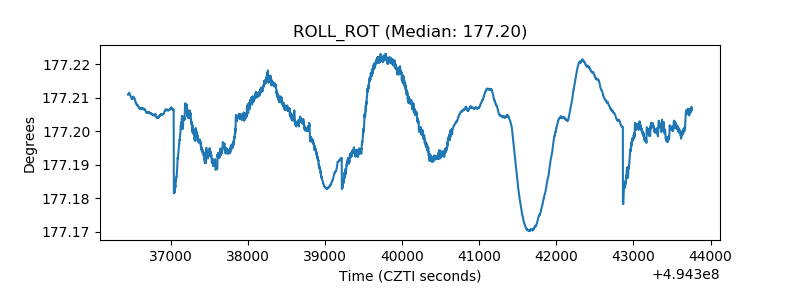 |
| _Roll_DEC | 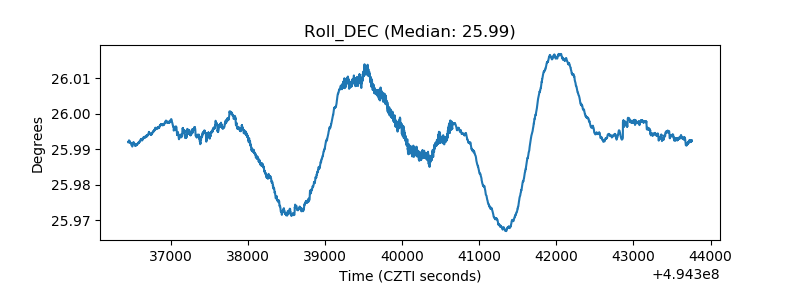 |
| _Roll_RA | 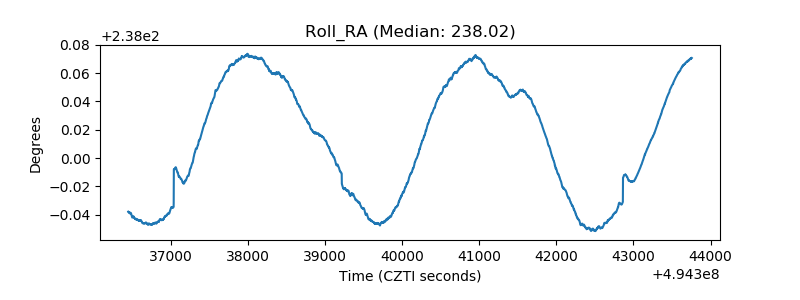 |
| Veto Counter | 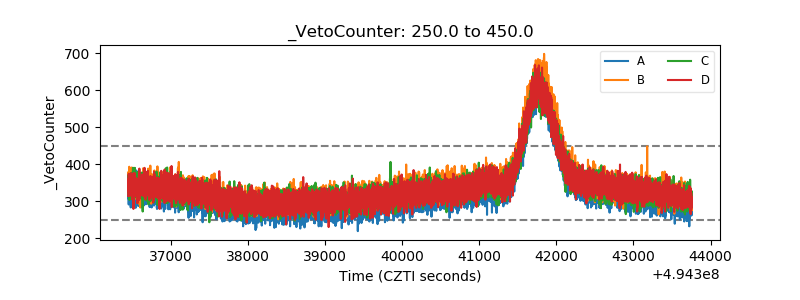 |