| Param | Original file | Final file |
|---|---|---|
| Filename | modeM0/AS1A14_022T05_9000006504_53693cztM0_level2.fits | modeM0/AS1A14_022T05_9000006504_53693cztM0_level2_quad_clean.evt |
| Size (bytes) | 939,421,440 | 83,946,240 |
| Size | 895.9 MB | 80.1 MB |
| Events in quadrant A | 13,522,121 | 320,360 |
| Events in quadrant B | 4,408,165 | 717,713 |
| Events in quadrant C | 11,416,242 | 422,731 |
| Events in quadrant D | 4,878,533 | 585,534 |
| Mode SS | |||
|---|---|---|---|
| Quadrant | BADHDUFLAG | Total packets | Discarded packets |
| A | 0 | 142 | 0 |
| B | 0 | 142 | 0 |
| C | 0 | 142 | 0 |
| D | 0 | 142 | 0 |
| Mode M0 | |||
|---|---|---|---|
| Quadrant | BADHDUFLAG | Total packets | Discarded packets |
| A | 0 | 45062 | 1 |
| B | 0 | 18092 | 0 |
| C | 0 | 38871 | 0 |
| D | 0 | 19398 | 0 |
| Quadrant | Total seconds | Saturated seconds | Saturation percentage |
|---|---|---|---|
| A | 7108 | 4012 | 56.443444% |
| B | 7108 | 87 | 1.223973% |
| C | 7109 | 2832 | 39.836827% |
| D | 7109 | 352 | 4.951470% |
Noise dominated data is calculated using 1-second bins in cleaned event files. If a bin has >2000 counts, and if more than 50% of those come from <1% of pixels, then it is considered to be noise-dominated and hence unusable.
| Quadrant | # 1 sec bins | Bins with >0 counts | Bins with >2000 counts | High rate bins dominated by noise | Noise dominated (total time) | Noise dominated (detector-on time) | Marked lightcurve |
|---|---|---|---|---|---|---|---|
| A | 7107 | 7107 | 4055 | 4055 | 57.06% | 57.06% | 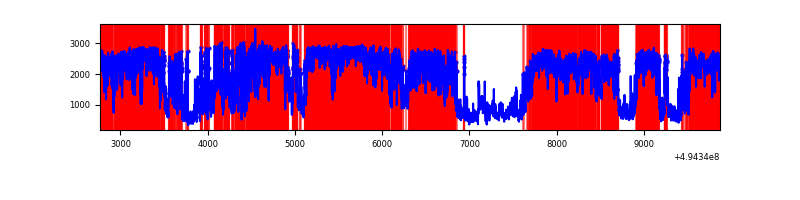 |
| B | 7108 | 7108 | 64 | 64 | 0.90% | 0.90% | 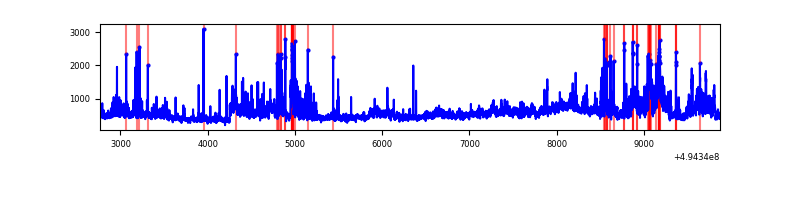 |
| C | 7108 | 7108 | 2706 | 2706 | 38.07% | 38.07% | 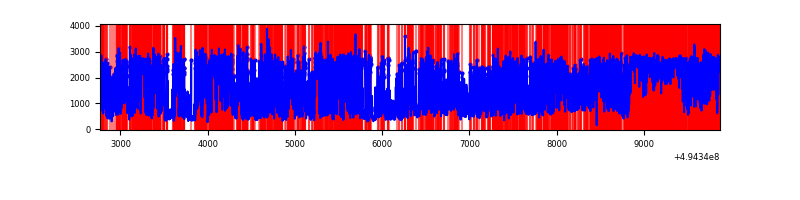 |
| D | 7109 | 7109 | 363 | 363 | 5.11% | 5.11% | 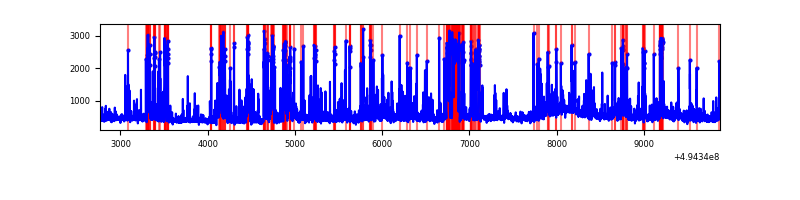 |
Top three noisy pixels from each quadrant. If the there are fewer than three noisy pixels in the level2.evt file, extra rows are filled as -1
| Pixel properties | Quadrant properties | ||||||
|---|---|---|---|---|---|---|---|
| Quadrant | DetID | PixID | Counts | Sigma | Mean | Median | Sigma |
| A | 3 | 63 | 8251367 | 57076.24 | 573 | 557 | 144.6 |
| A | 3 | 78 | 2173873 | 15034.24 | 573 | 557 | 144.6 |
| A | 12 | 17 | 386663 | 2670.95 | 573 | 557 | 144.6 |
| B | 7 | 0 | 819549 | 5096.61 | 751 | 724 | 160.7 |
| B | 5 | 185 | 221326 | 1373.09 | 751 | 724 | 160.7 |
| B | 0 | 171 | 119184 | 737.33 | 751 | 724 | 160.7 |
| C | 15 | 224 | 5494789 | 32764.67 | 603 | 599 | 167.7 |
| C | 15 | 158 | 1023500 | 6100.08 | 603 | 599 | 167.7 |
| C | 13 | 3 | 905579 | 5396.86 | 603 | 599 | 167.7 |
| D | 7 | 70 | 407357 | 1930.09 | 728 | 695 | 210.7 |
| D | 10 | 118 | 359756 | 1704.17 | 728 | 695 | 210.7 |
| D | 2 | 153 | 260186 | 1231.59 | 728 | 695 | 210.7 |
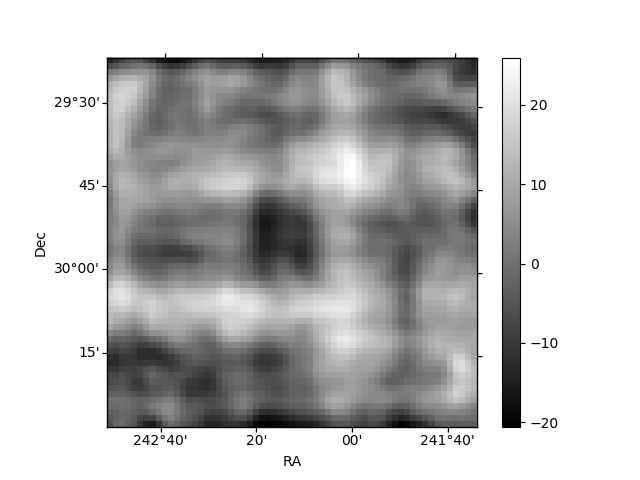
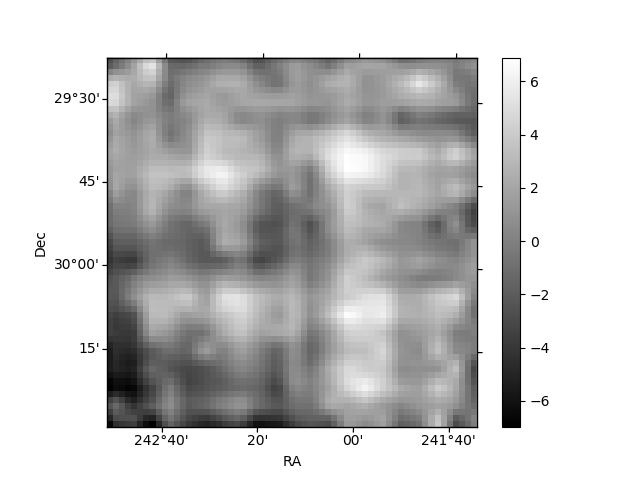
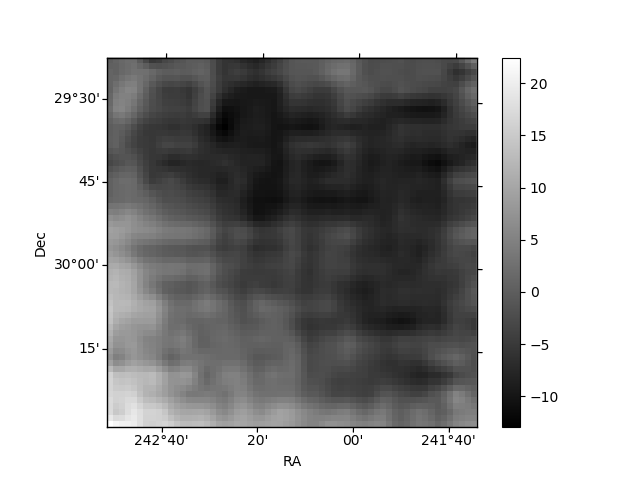
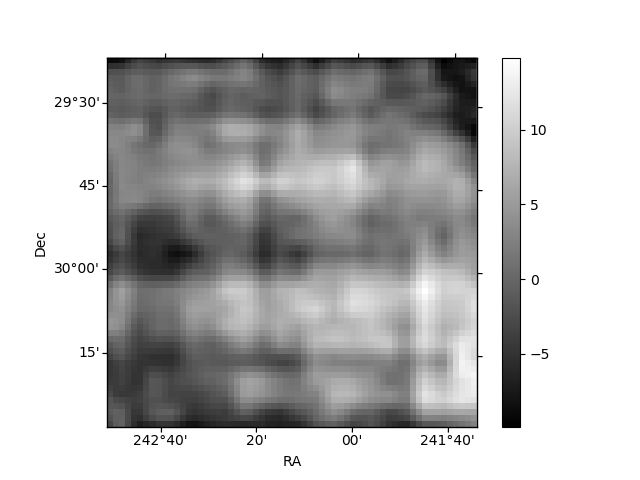
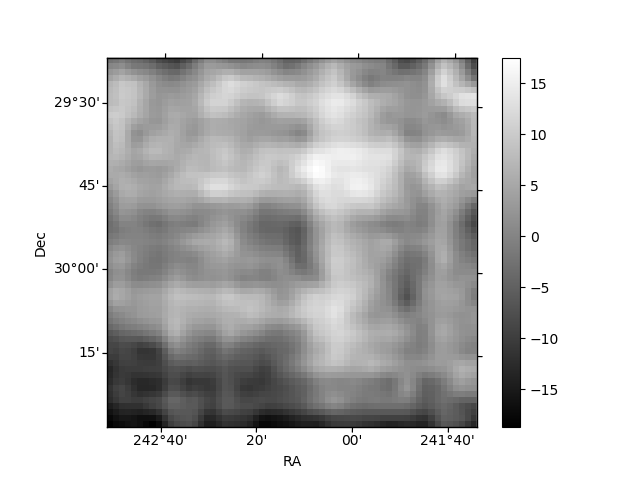
Histogram calculated using DETX and DETY for each event in the final _common_clean file
| Quadrant A | 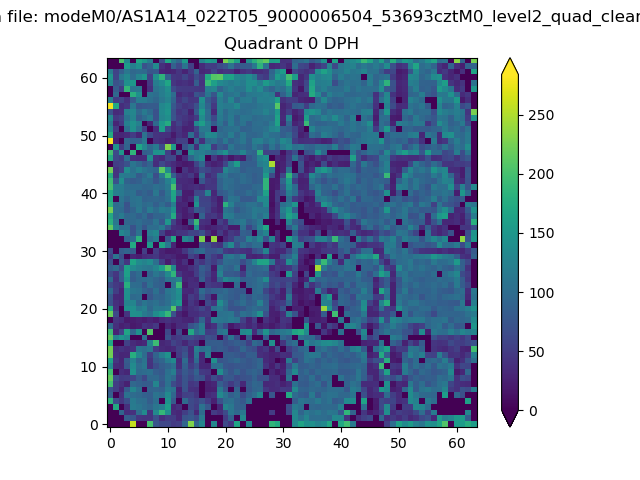 |
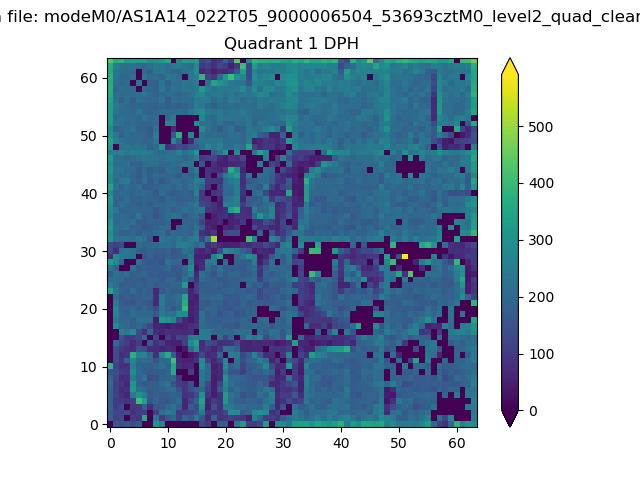 |
Quadrant B |
|---|---|---|---|
| Quadrant D | 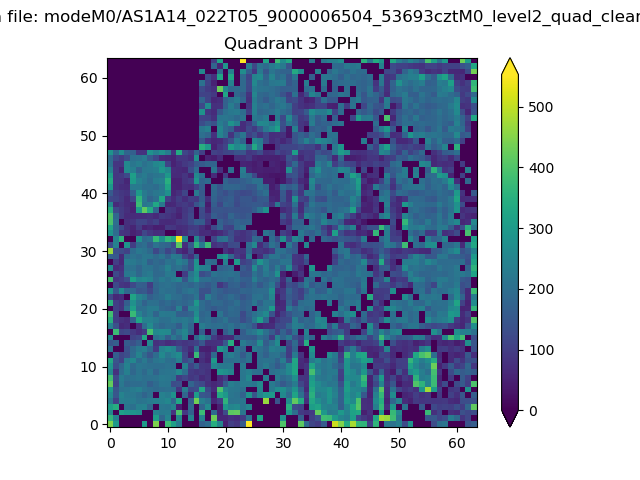 |
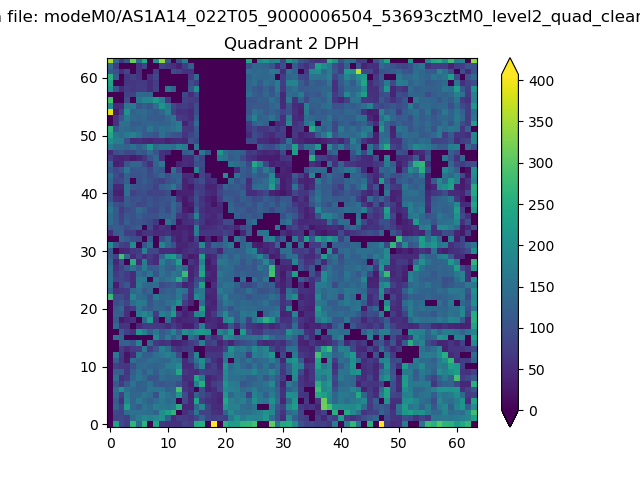 |
Quadrant C |
| Plot type | Count rate plots | Images |
|---|---|---|
| Comparison with Poisson distribution Blue bars denote a histogram of data divided into 1 sec bins. Red curve is a Poisson curve with rate = median count rate of data. |
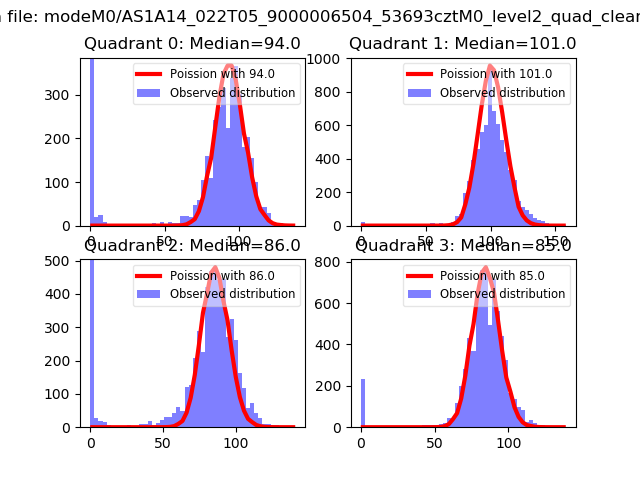 |
 |
| Quadrant-wise count rates Data is divided into 100 sec bins |
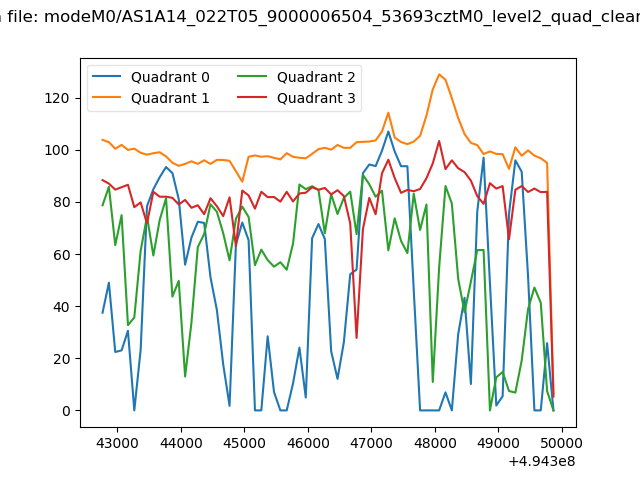 |
|
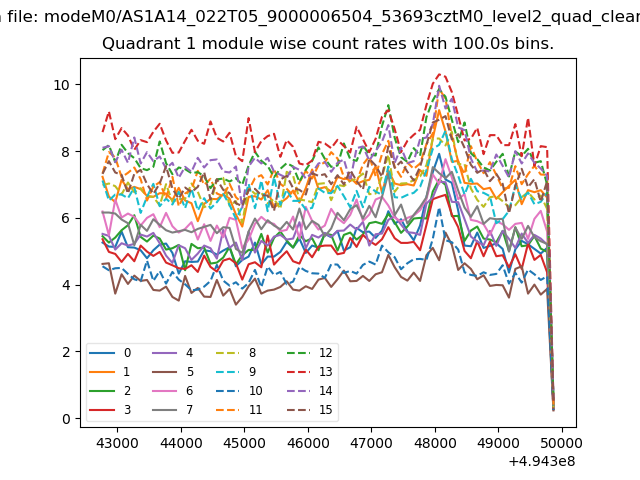
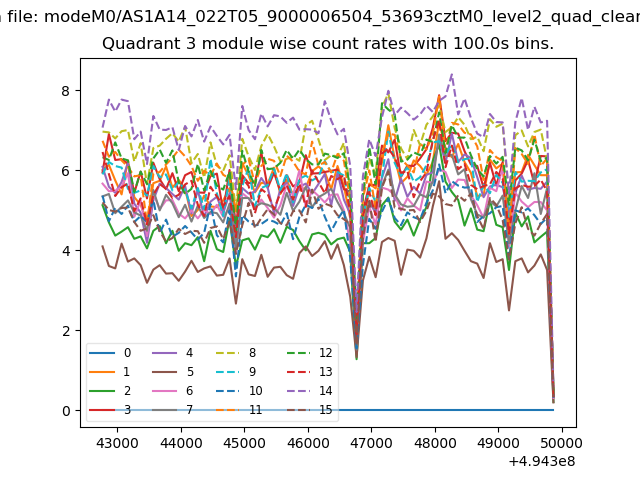
| Module-wise count rates for Quadrant A Data is divided into 100 sec bins |
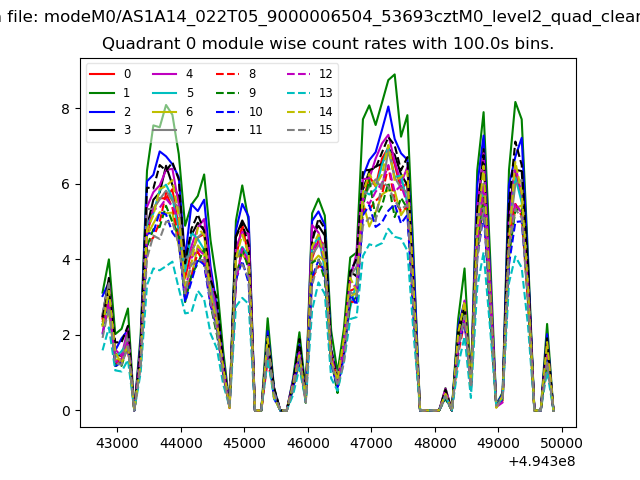 |
 |
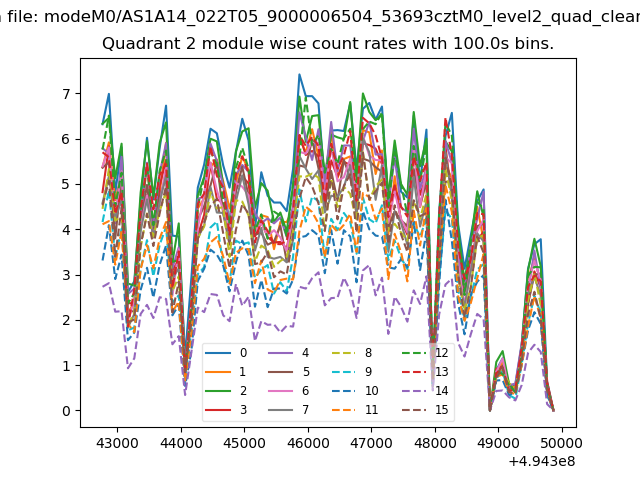
| Module-wise count rates for Quadrant B Data is divided into 100 sec bins |
 |
 |
| Module-wise count rates for Quadrant C Data is divided into 100 sec bins |
 |
 |
| Module-wise count rates for Quadrant D Data is divided into 100 sec bins |
 |
 |
| Parameter | Plot |
|---|---|
| CZT HV Monitor | 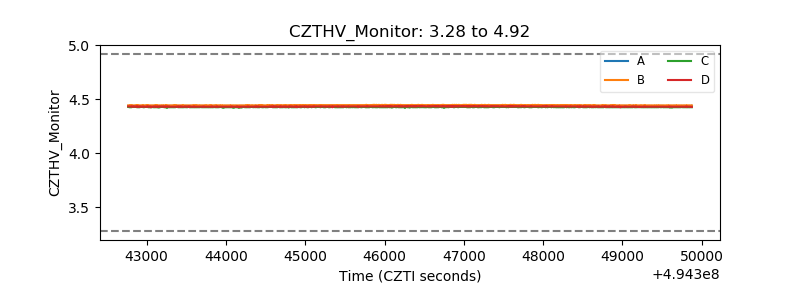 |
| D_VDD | 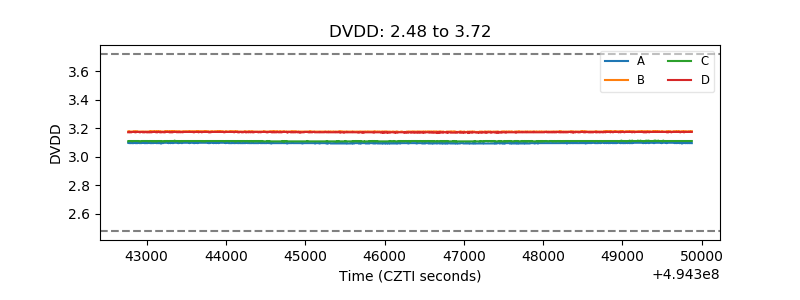 |
| Temperature 1 | 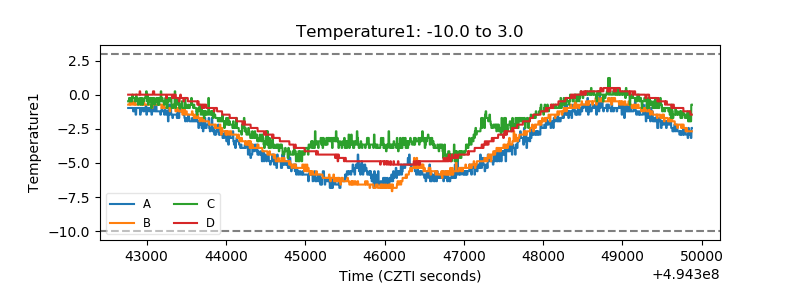 |
| Veto HV Monitor | 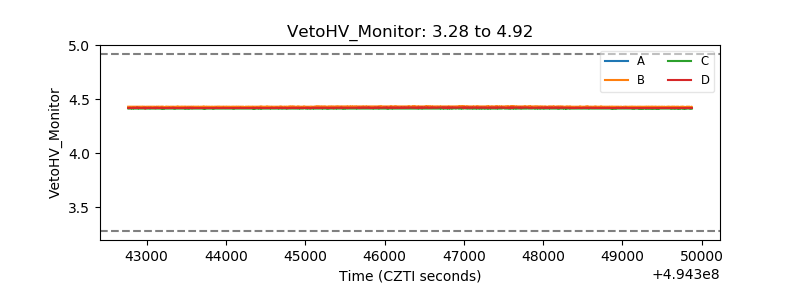 |
| Veto LLD | 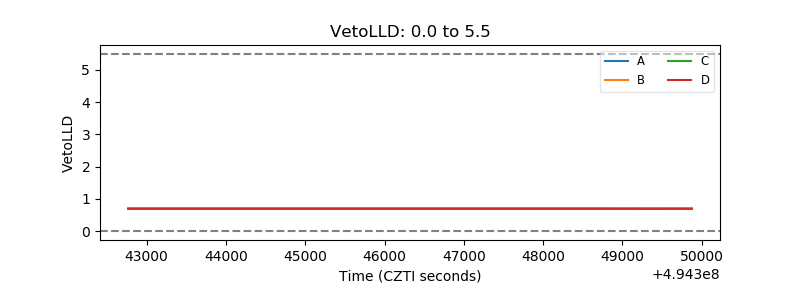 |
| Alpha Counter | 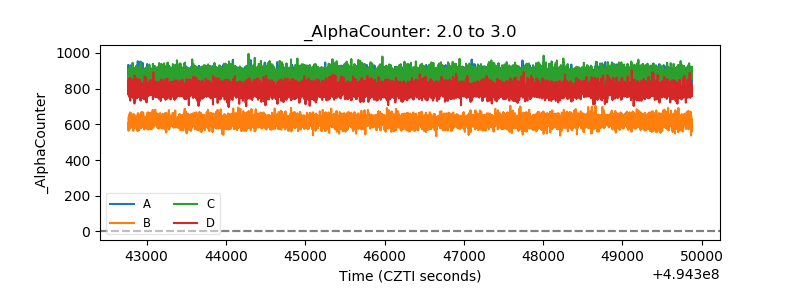 |
| _CPM_Rate | 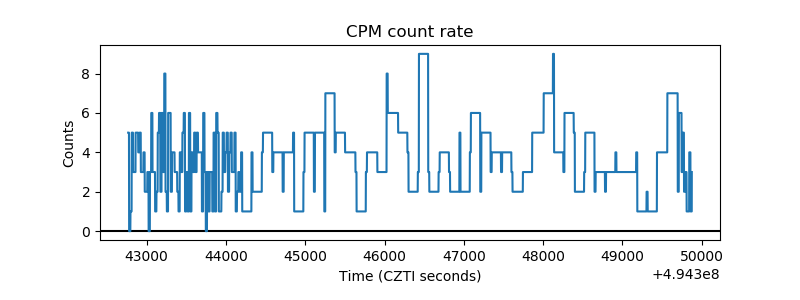 |
| CZT Counter | 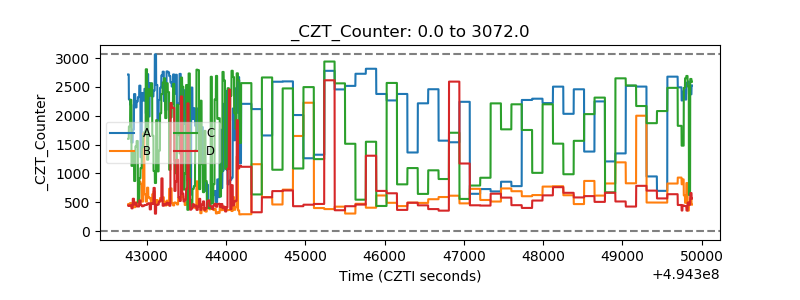 |
| +2.5 Volts monitor | 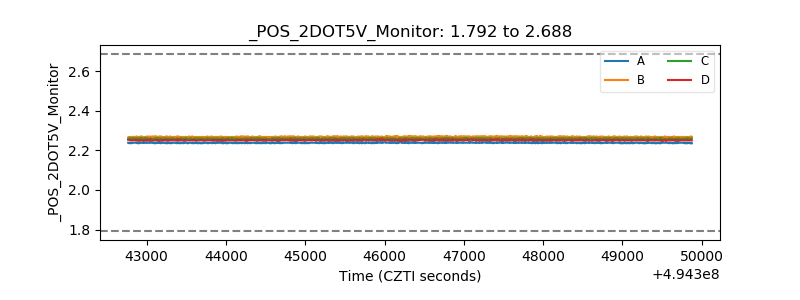 |
| +5 Volts monitor |  |
| _ROLL_ROT | 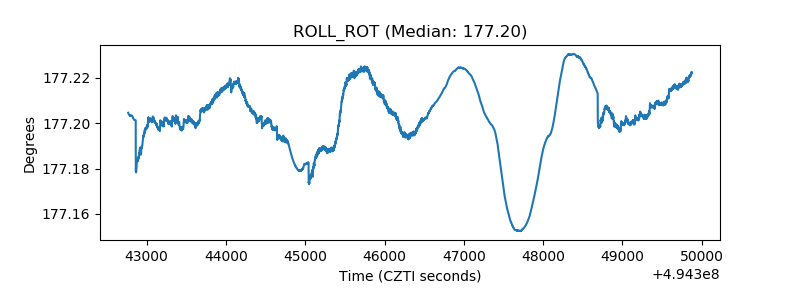 |
| _Roll_DEC | 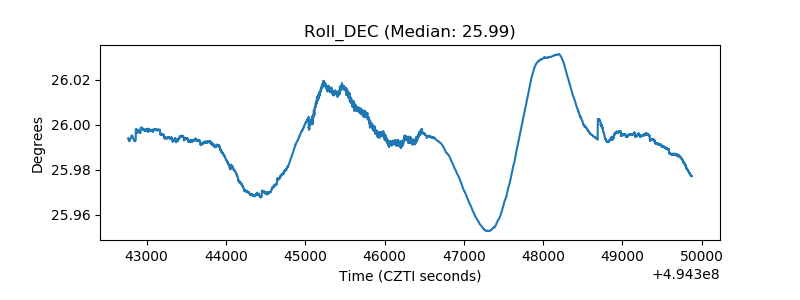 |
| _Roll_RA | 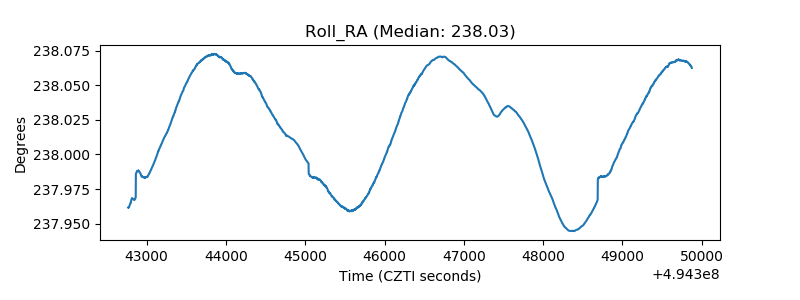 |
| Veto Counter | 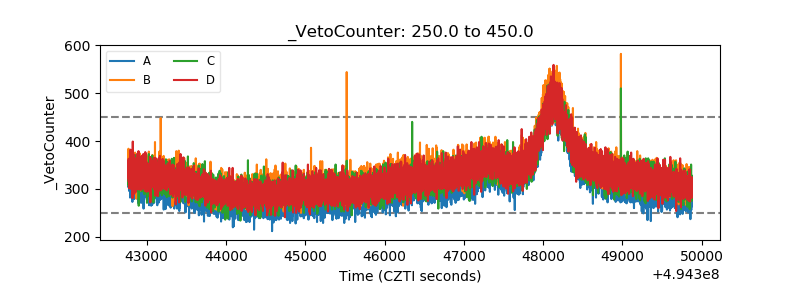 |