| Param | Original file | Final file |
|---|---|---|
| Filename | modeM0/AS1A14_022T05_9000006504_53694cztM0_level2.fits | modeM0/AS1A14_022T05_9000006504_53694cztM0_level2_quad_clean.evt |
| Size (bytes) | 1,121,817,600 | 83,882,880 |
| Size | 1.0 GB | 80.0 MB |
| Events in quadrant A | 14,860,718 | 315,842 |
| Events in quadrant B | 5,066,952 | 770,372 |
| Events in quadrant C | 15,368,512 | 284,490 |
| Events in quadrant D | 5,637,333 | 634,943 |
| Mode SS | |||
|---|---|---|---|
| Quadrant | BADHDUFLAG | Total packets | Discarded packets |
| A | 0 | 152 | 0 |
| B | 0 | 152 | 0 |
| C | 0 | 152 | 0 |
| D | 0 | 152 | 0 |
| Mode M0 | |||
|---|---|---|---|
| Quadrant | BADHDUFLAG | Total packets | Discarded packets |
| A | 0 | 49418 | 0 |
| B | 0 | 20494 | 0 |
| C | 0 | 50913 | 0 |
| D | 0 | 22101 | 0 |
| Quadrant | Total seconds | Saturated seconds | Saturation percentage |
|---|---|---|---|
| A | 7675 | 4668 | 60.820847% |
| B | 7676 | 153 | 1.993226% |
| C | 7676 | 5002 | 65.164148% |
| D | 7676 | 334 | 4.351225% |
Noise dominated data is calculated using 1-second bins in cleaned event files. If a bin has >2000 counts, and if more than 50% of those come from <1% of pixels, then it is considered to be noise-dominated and hence unusable.
| Quadrant | # 1 sec bins | Bins with >0 counts | Bins with >2000 counts | High rate bins dominated by noise | Noise dominated (total time) | Noise dominated (detector-on time) | Marked lightcurve |
|---|---|---|---|---|---|---|---|
| A | 7674 | 7674 | 4512 | 4512 | 58.80% | 58.80% | 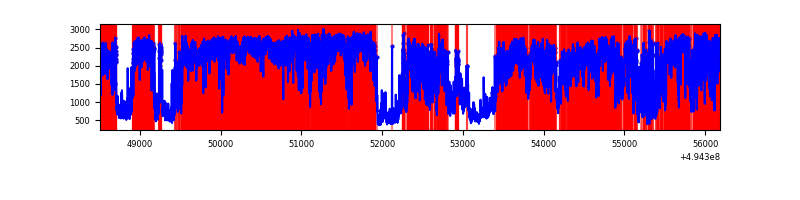 |
| B | 7676 | 7676 | 86 | 86 | 1.12% | 1.12% | 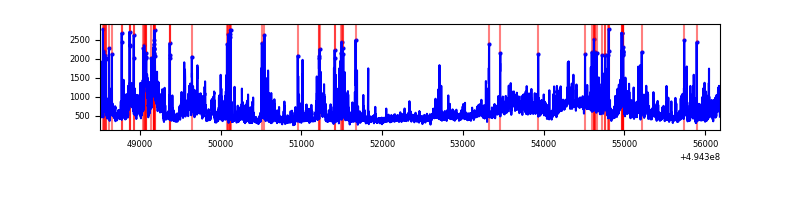 |
| C | 7675 | 7675 | 4612 | 4612 | 60.09% | 60.09% | 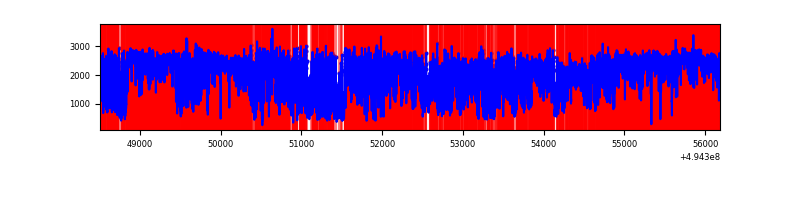 |
| D | 7676 | 7676 | 304 | 304 | 3.96% | 3.96% | 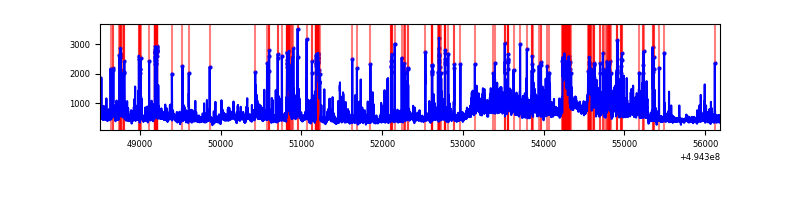 |
Top three noisy pixels from each quadrant. If the there are fewer than three noisy pixels in the level2.evt file, extra rows are filled as -1
| Pixel properties | Quadrant properties | ||||||
|---|---|---|---|---|---|---|---|
| Quadrant | DetID | PixID | Counts | Sigma | Mean | Median | Sigma |
| A | 3 | 63 | 6156765 | 40227.38 | 609 | 593 | 153.0 |
| A | 3 | 78 | 5534233 | 36159.46 | 609 | 593 | 153.0 |
| A | 12 | 17 | 178793 | 1164.44 | 609 | 593 | 153.0 |
| B | 7 | 0 | 789654 | 4494.02 | 815 | 787 | 175.5 |
| B | 5 | 185 | 291916 | 1658.5 | 815 | 787 | 175.5 |
| B | 4 | 81 | 160603 | 910.44 | 815 | 787 | 175.5 |
| C | 15 | 224 | 6400383 | 40386.31 | 565 | 560 | 158.5 |
| C | 15 | 158 | 3071052 | 19376.45 | 565 | 560 | 158.5 |
| C | 13 | 49 | 884945 | 5580.94 | 565 | 560 | 158.5 |
| D | 10 | 172 | 990843 | 4274.26 | 794 | 757 | 231.6 |
| D | 7 | 70 | 365162 | 1573.16 | 794 | 757 | 231.6 |
| D | 2 | 120 | 156820 | 673.73 | 794 | 757 | 231.6 |
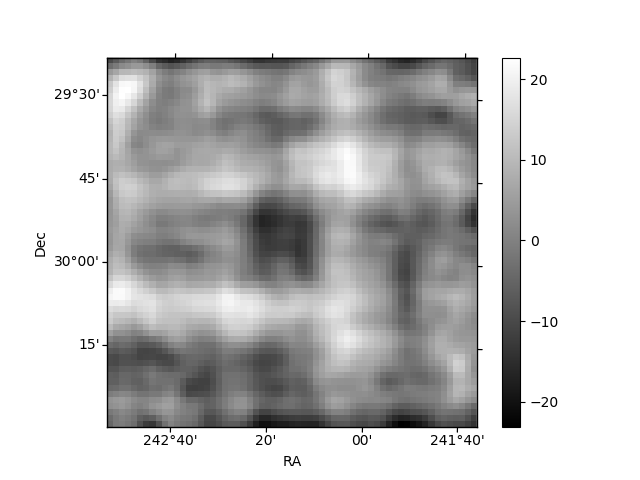
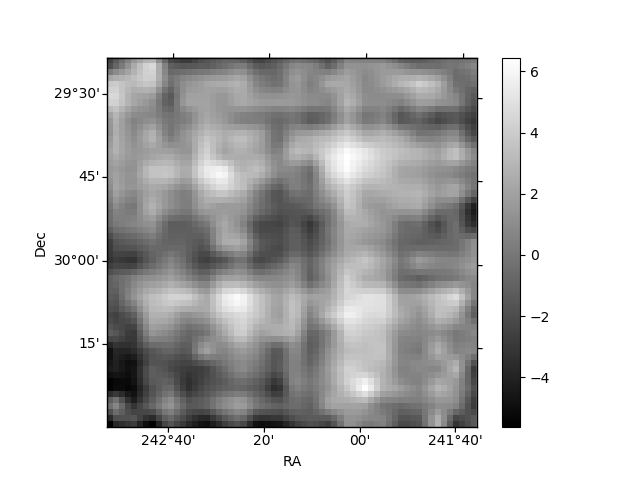
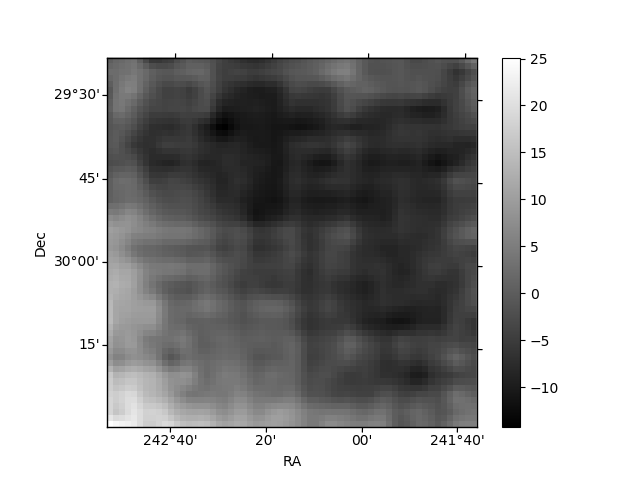
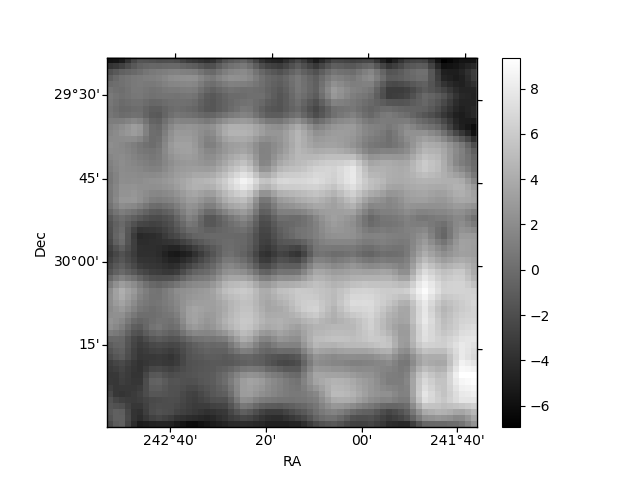
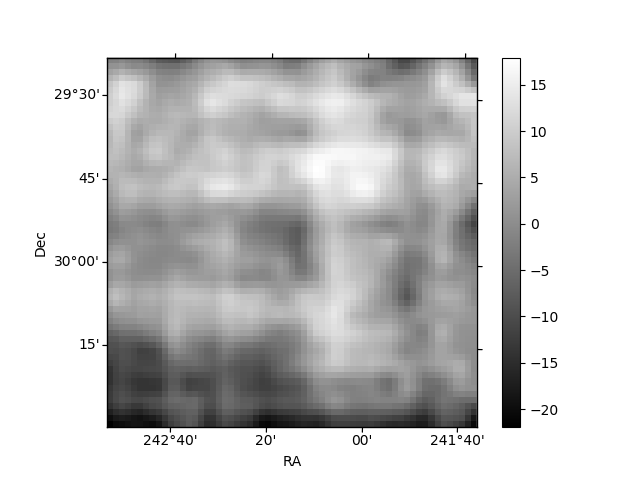
Histogram calculated using DETX and DETY for each event in the final _common_clean file
| Quadrant A | 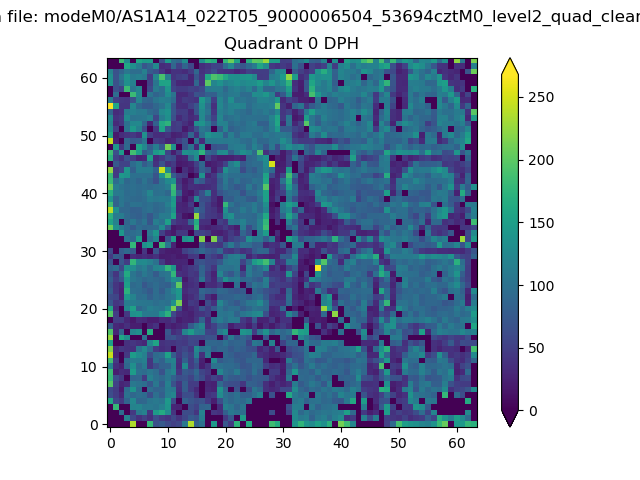 |
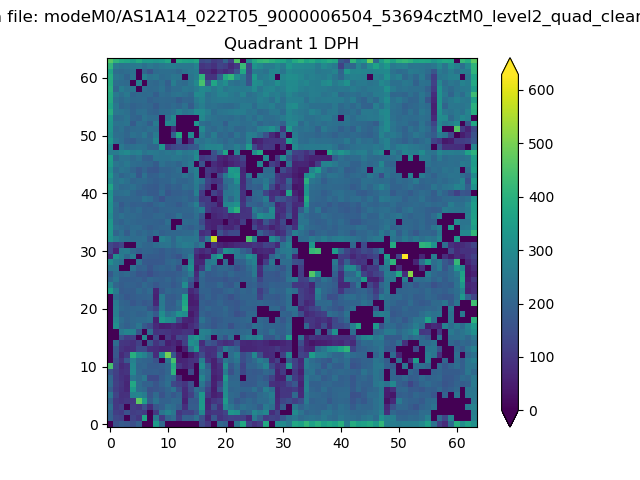 |
Quadrant B |
|---|---|---|---|
| Quadrant D | 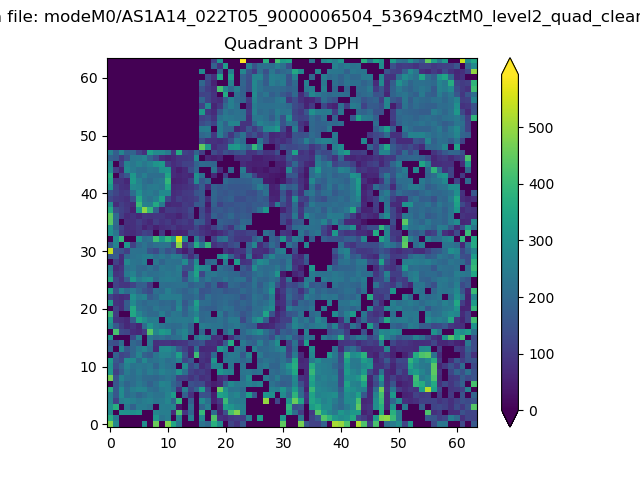 |
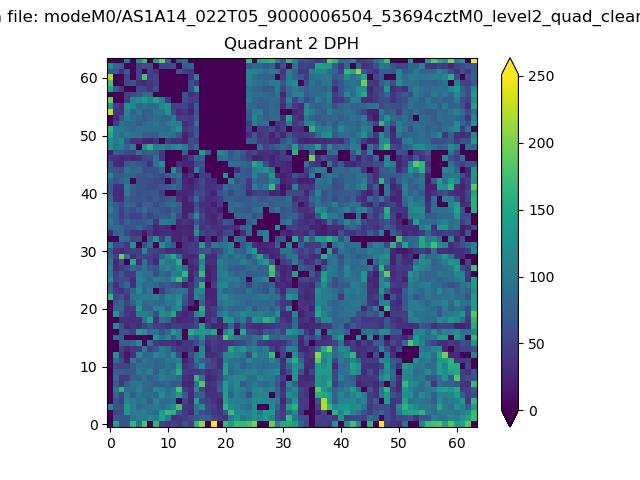 |
Quadrant C |
| Plot type | Count rate plots | Images |
|---|---|---|
| Comparison with Poisson distribution Blue bars denote a histogram of data divided into 1 sec bins. Red curve is a Poisson curve with rate = median count rate of data. |
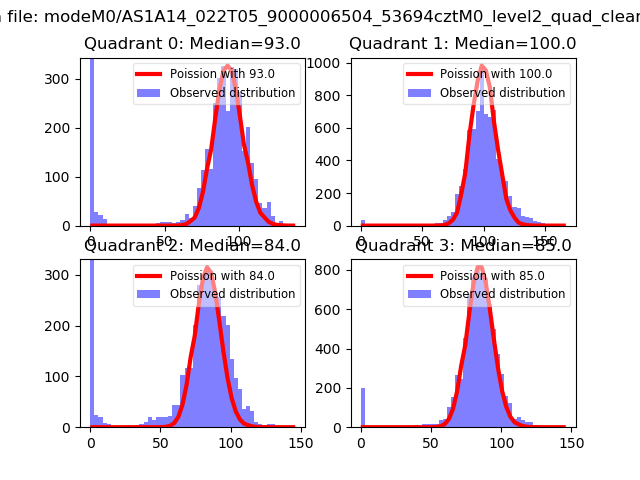 |
 |
| Quadrant-wise count rates Data is divided into 100 sec bins |
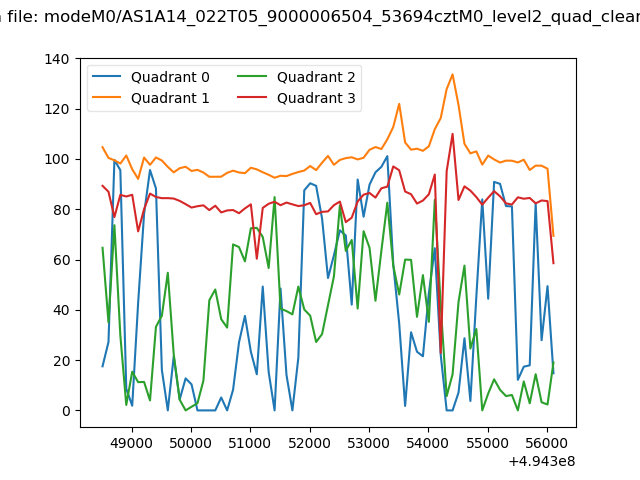 |
|
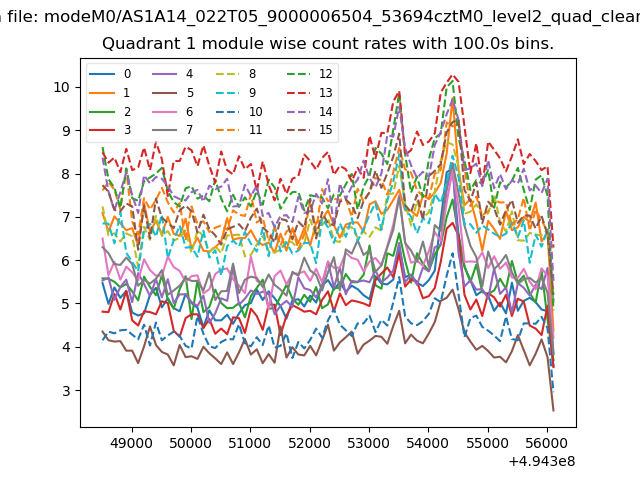
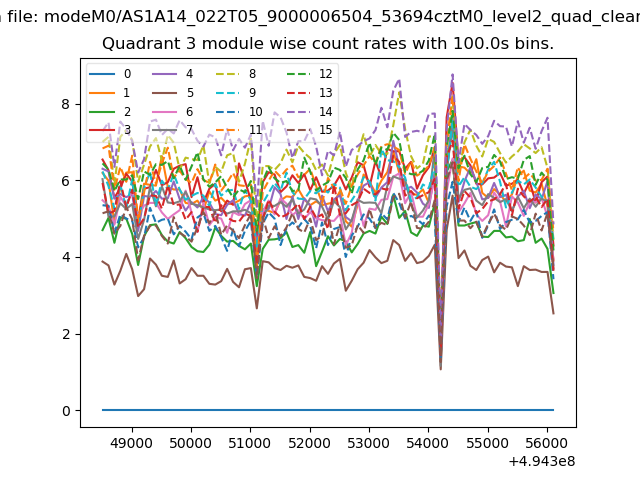
| Module-wise count rates for Quadrant A Data is divided into 100 sec bins |
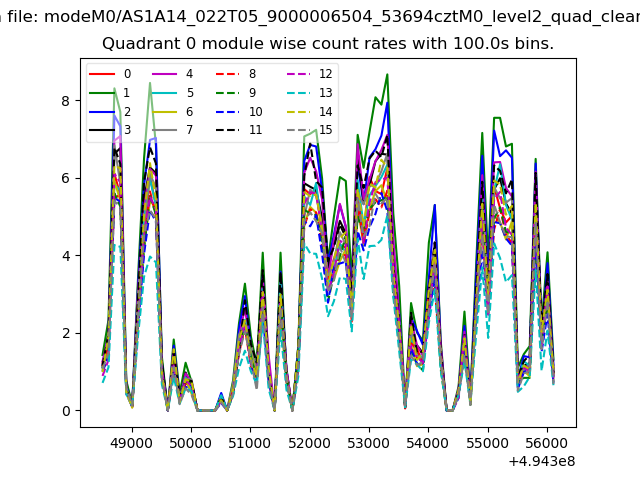 |
 |
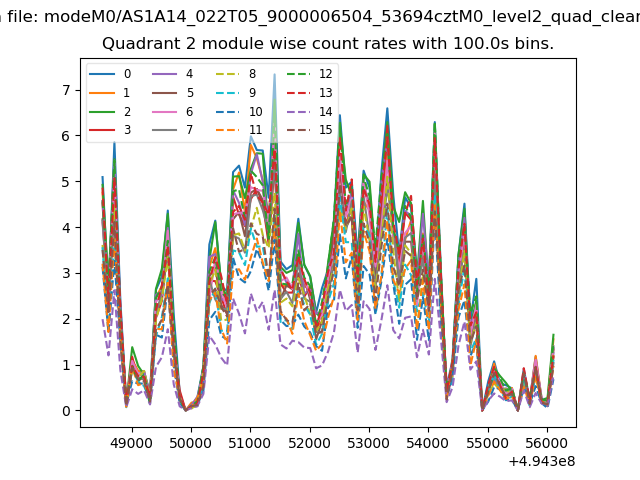
| Module-wise count rates for Quadrant B Data is divided into 100 sec bins |
 |
 |
| Module-wise count rates for Quadrant C Data is divided into 100 sec bins |
 |
 |
| Module-wise count rates for Quadrant D Data is divided into 100 sec bins |
 |
 |
| Parameter | Plot |
|---|---|
| CZT HV Monitor | 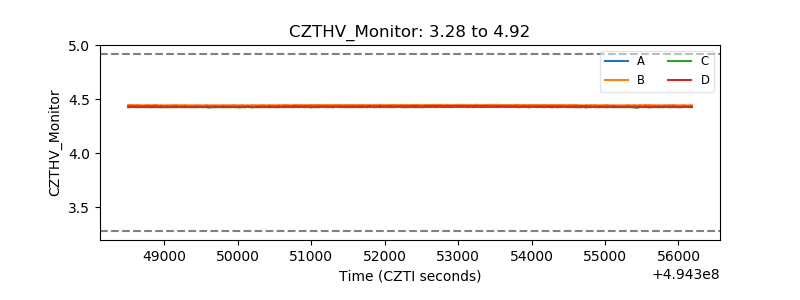 |
| D_VDD | 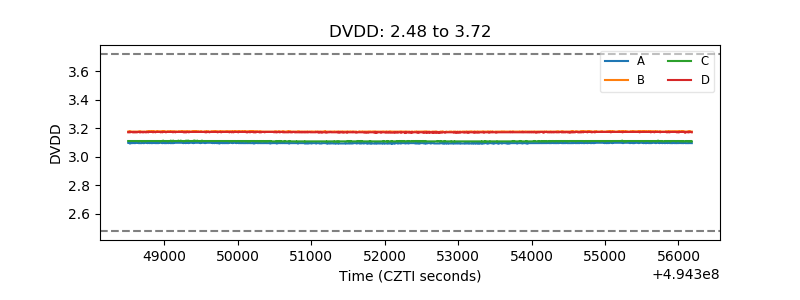 |
| Temperature 1 | 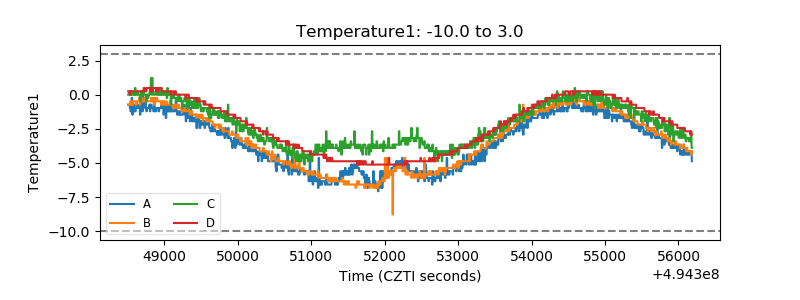 |
| Veto HV Monitor | 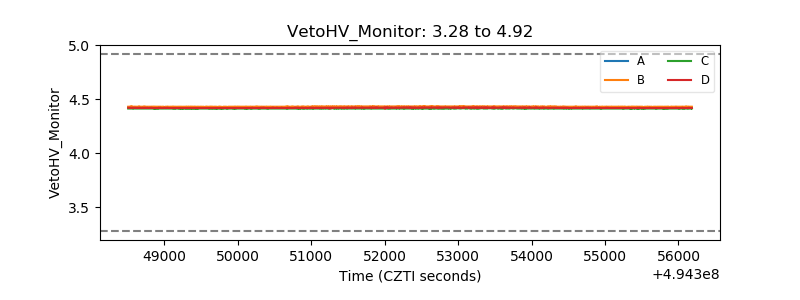 |
| Veto LLD | 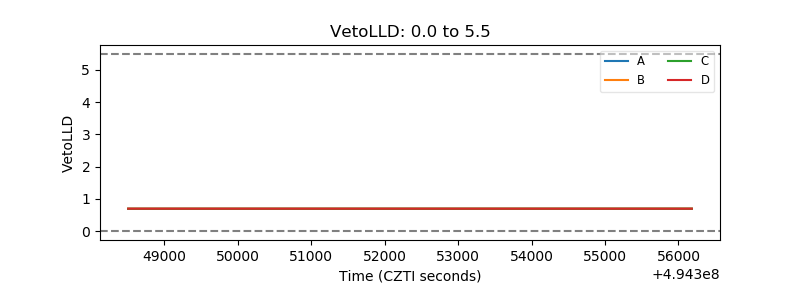 |
| Alpha Counter | 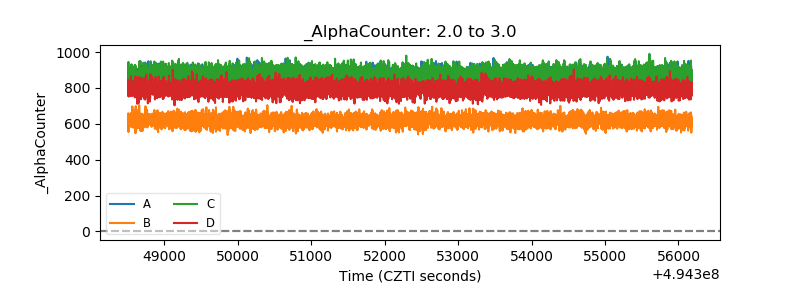 |
| _CPM_Rate | 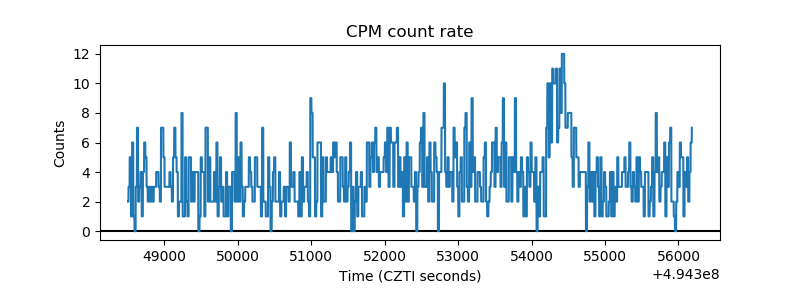 |
| CZT Counter | 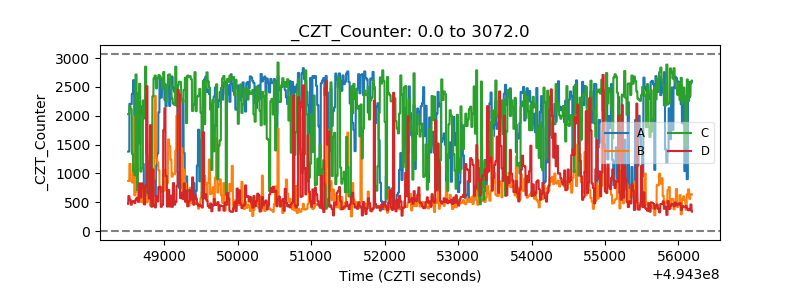 |
| +2.5 Volts monitor | 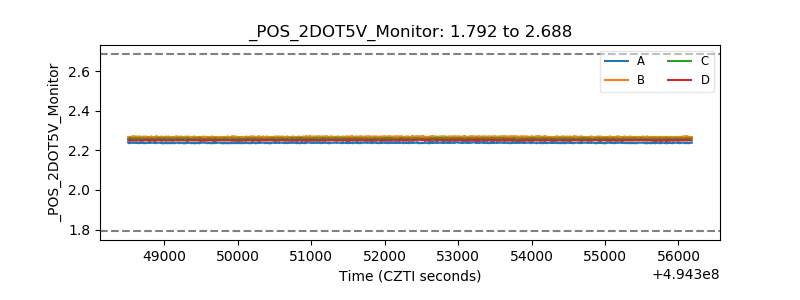 |
| +5 Volts monitor | 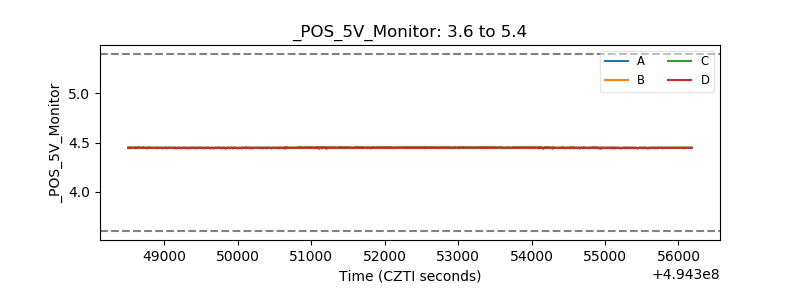 |
| _ROLL_ROT | 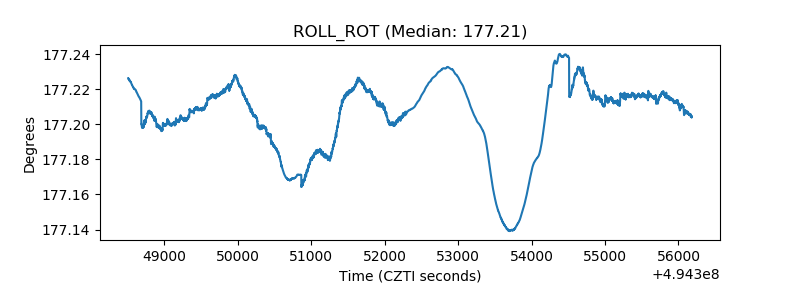 |
| _Roll_DEC | 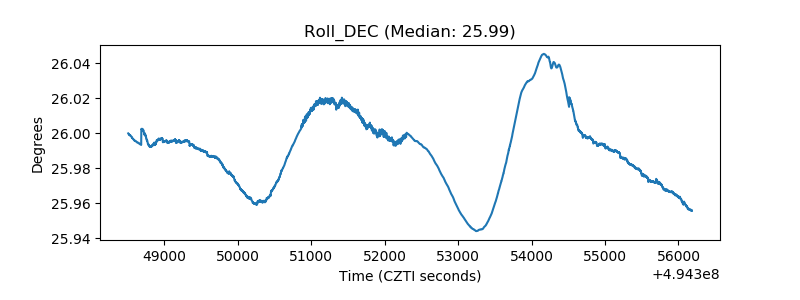 |
| _Roll_RA | 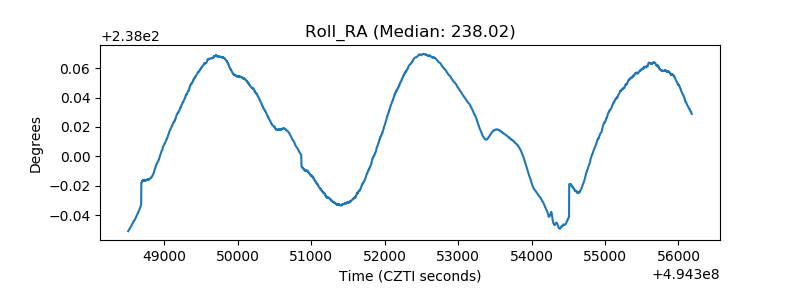 |
| Veto Counter | 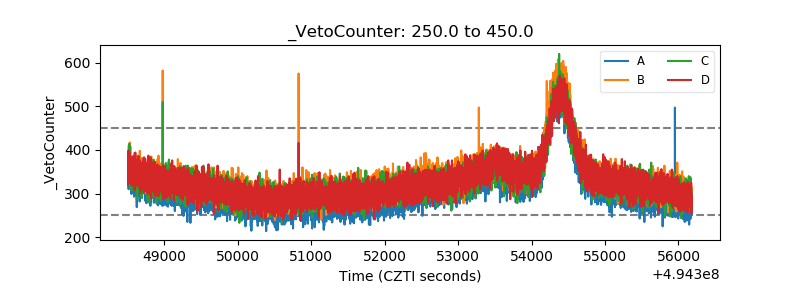 |