| Param | Original file | Final file |
|---|---|---|
| Filename | modeM0/AS1A14_022T05_9000006504_53697cztM0_level2.fits | modeM0/AS1A14_022T05_9000006504_53697cztM0_level2_quad_clean.evt |
| Size (bytes) | 2,847,781,440 | 184,273,920 |
| Size | 2.7 GB | 175.7 MB |
| Events in quadrant A | 42,330,009 | 460,920 |
| Events in quadrant B | 10,753,289 | 1,787,615 |
| Events in quadrant C | 34,436,681 | 654,286 |
| Events in quadrant D | 16,461,937 | 1,390,343 |
| Mode SS | |||
|---|---|---|---|
| Quadrant | BADHDUFLAG | Total packets | Discarded packets |
| A | 0 | 380 | 0 |
| B | 0 | 380 | 0 |
| C | 0 | 380 | 0 |
| D | 0 | 380 | 0 |
| Mode M9 | |||
|---|---|---|---|
| Quadrant | BADHDUFLAG | Total packets | Discarded packets |
| A | 0 | 15 | 0 |
| B | 0 | 15 | 0 |
| C | 0 | 15 | 0 |
| D | 0 | 15 | 0 |
| Mode M0 | |||
|---|---|---|---|
| Quadrant | BADHDUFLAG | Total packets | Discarded packets |
| A | 0 | 138628 | 3 |
| B | 0 | 45589 | 3 |
| C | 0 | 115070 | 3 |
| D | 0 | 62088 | 3 |
| Quadrant | Total seconds | Saturated seconds | Saturation percentage |
|---|---|---|---|
| A | 18632 | 14296 | 76.728210% |
| B | 18633 | 561 | 3.010787% |
| C | 18633 | 12066 | 64.756078% |
| D | 18633 | 1974 | 10.594107% |
Noise dominated data is calculated using 1-second bins in cleaned event files. If a bin has >2000 counts, and if more than 50% of those come from <1% of pixels, then it is considered to be noise-dominated and hence unusable.
| Quadrant | # 1 sec bins | Bins with >0 counts | Bins with >2000 counts | High rate bins dominated by noise | Noise dominated (total time) | Noise dominated (detector-on time) | Marked lightcurve |
|---|---|---|---|---|---|---|---|
| A | 20212 | 18632 | 14299 | 14299 | 70.75% | 76.74% | 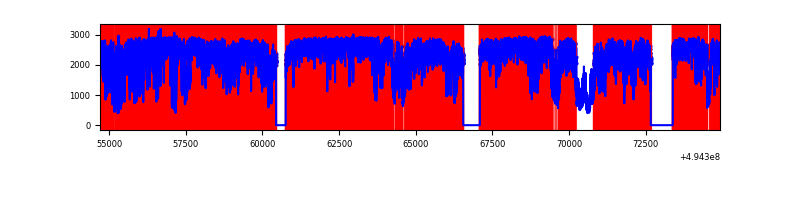 |
| B | 20213 | 18635 | 343 | 343 | 1.70% | 1.84% | 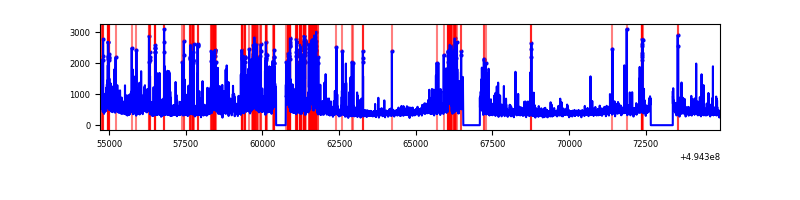 |
| C | 20213 | 18633 | 9511 | 9511 | 47.05% | 51.04% | 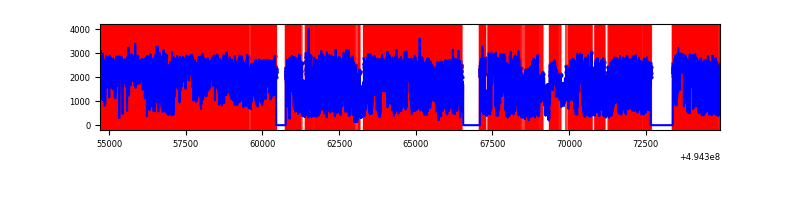 |
| D | 20213 | 18635 | 2028 | 2028 | 10.03% | 10.88% | 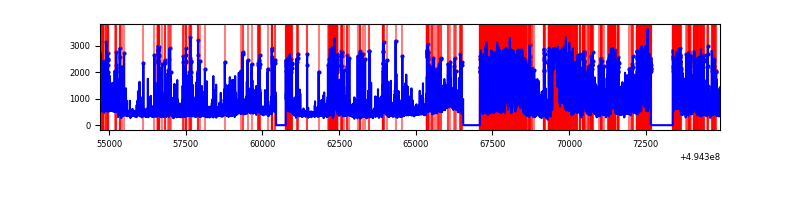 |
Top three noisy pixels from each quadrant. If the there are fewer than three noisy pixels in the level2.evt file, extra rows are filled as -1
| Pixel properties | Quadrant properties | ||||||
|---|---|---|---|---|---|---|---|
| Quadrant | DetID | PixID | Counts | Sigma | Mean | Median | Sigma |
| A | 3 | 63 | 31597252 | 106403.98 | 1190 | 1159 | 296.9 |
| A | 3 | 78 | 4497478 | 15141.94 | 1190 | 1159 | 296.9 |
| A | 14 | 254 | 320745 | 1076.25 | 1190 | 1159 | 296.9 |
| B | 5 | 185 | 1457895 | 3533.07 | 1927 | 1859 | 412.1 |
| B | 4 | 81 | 576280 | 1393.83 | 1927 | 1859 | 412.1 |
| B | 7 | 0 | 312798 | 754.49 | 1927 | 1859 | 412.1 |
| C | 15 | 224 | 14373831 | 42126.06 | 1224 | 1215 | 341.2 |
| C | 1 | 241 | 4280283 | 12541.93 | 1224 | 1215 | 341.2 |
| C | 15 | 158 | 2426784 | 7109.33 | 1224 | 1215 | 341.2 |
| D | 8 | 176 | 2294518 | 4374.88 | 1826 | 1741 | 524.1 |
| D | 1 | 241 | 1819672 | 3468.82 | 1826 | 1741 | 524.1 |
| D | 7 | 70 | 1497753 | 2854.56 | 1826 | 1741 | 524.1 |
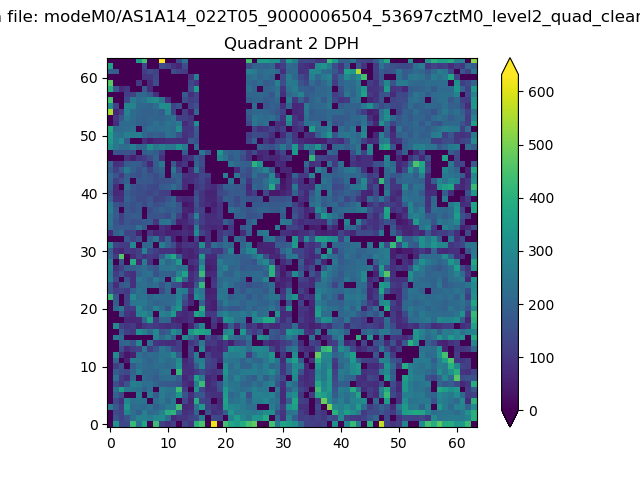
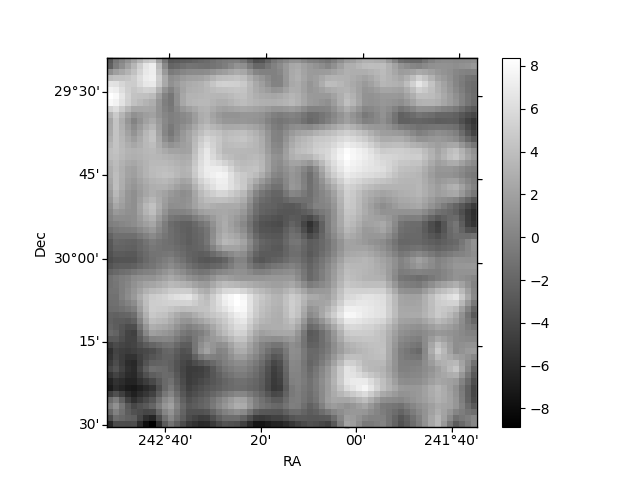
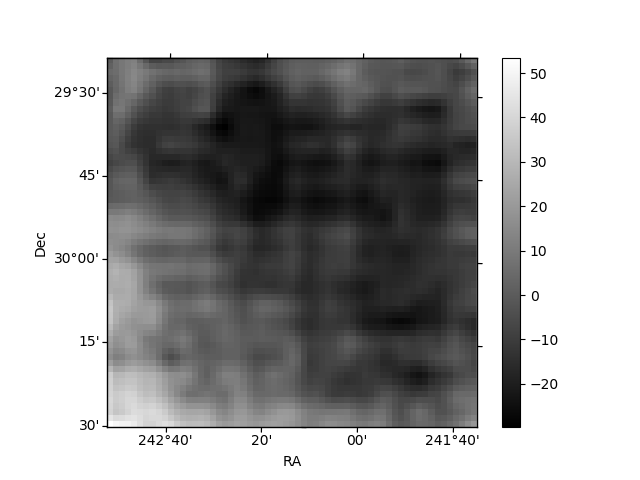
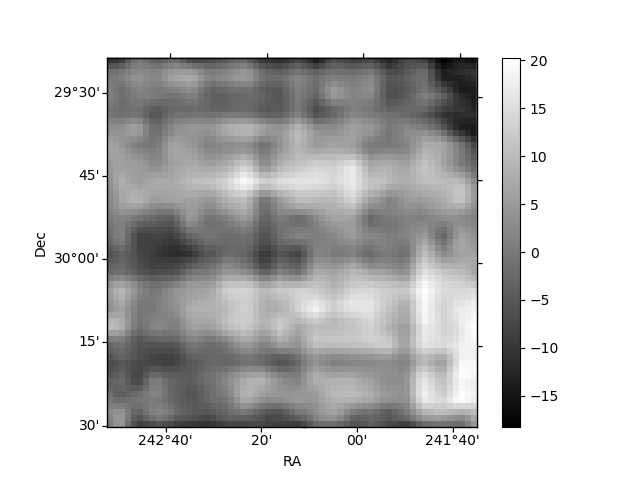
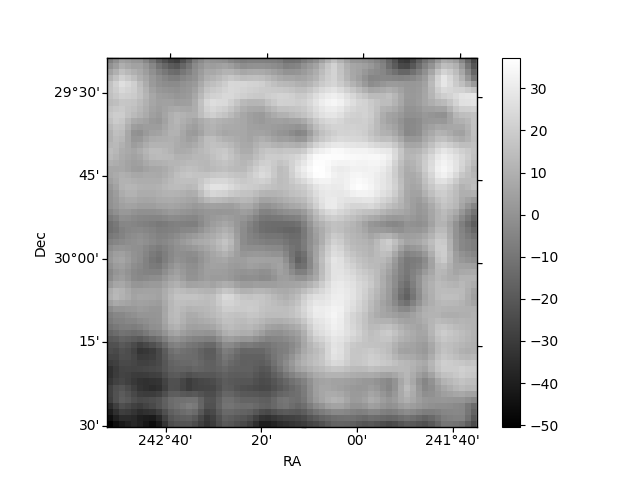
Histogram calculated using DETX and DETY for each event in the final _common_clean file
| Quadrant A | 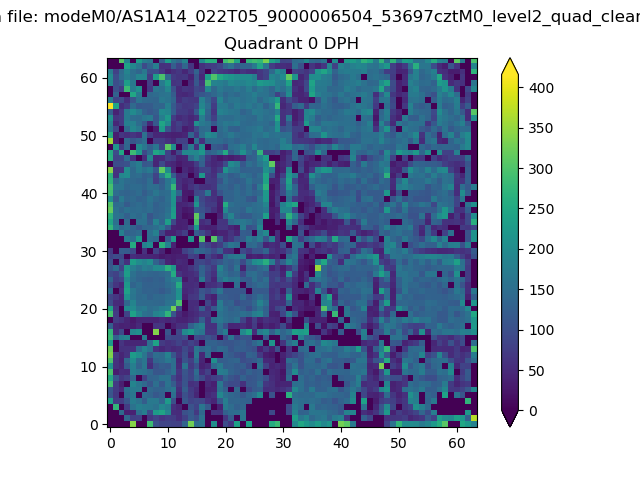 |
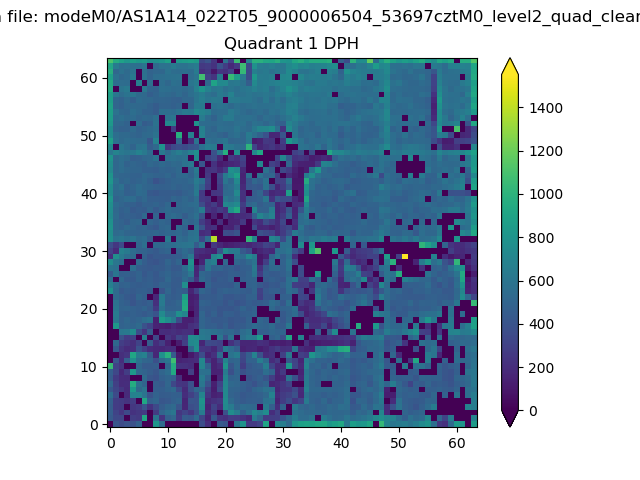 |
Quadrant B |
|---|---|---|---|
| Quadrant D | 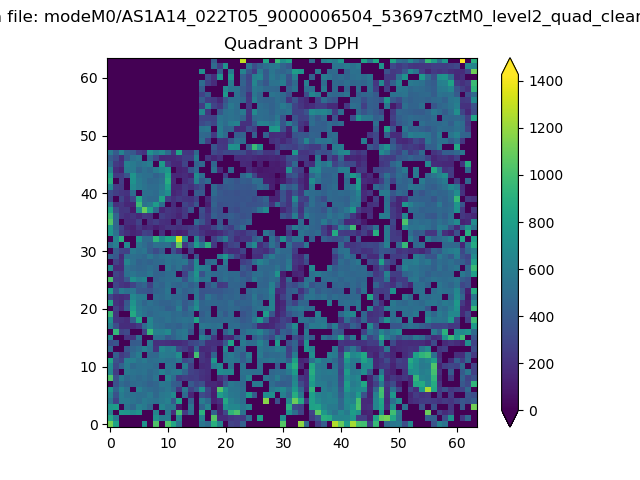 |
 |
Quadrant C |
| Plot type | Count rate plots | Images |
|---|---|---|
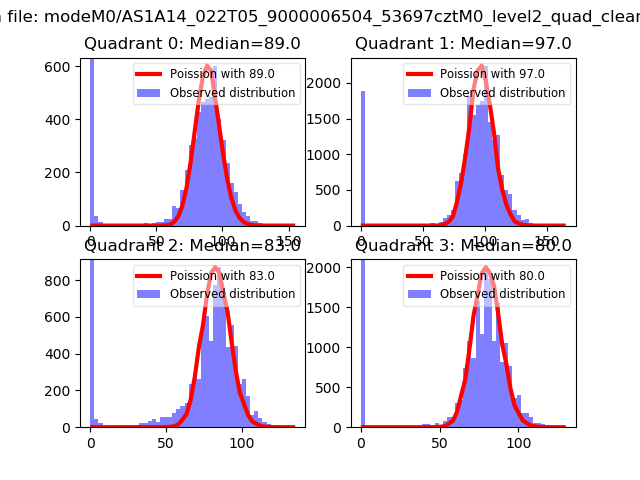
| Comparison with Poisson distribution Blue bars denote a histogram of data divided into 1 sec bins. Red curve is a Poisson curve with rate = median count rate of data. |
 |
 |
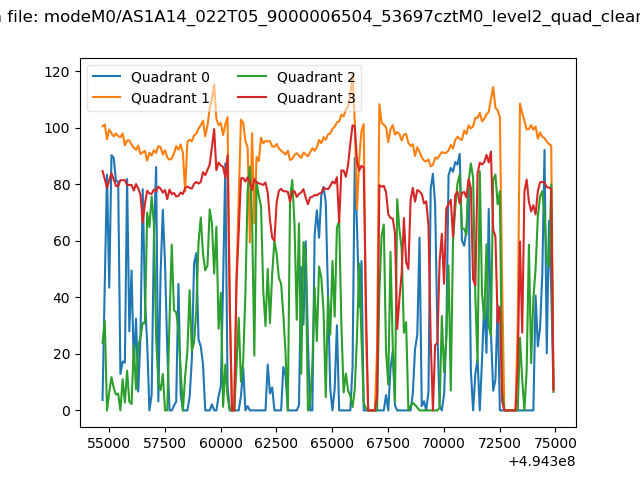
| Quadrant-wise count rates Data is divided into 100 sec bins |
 |
|
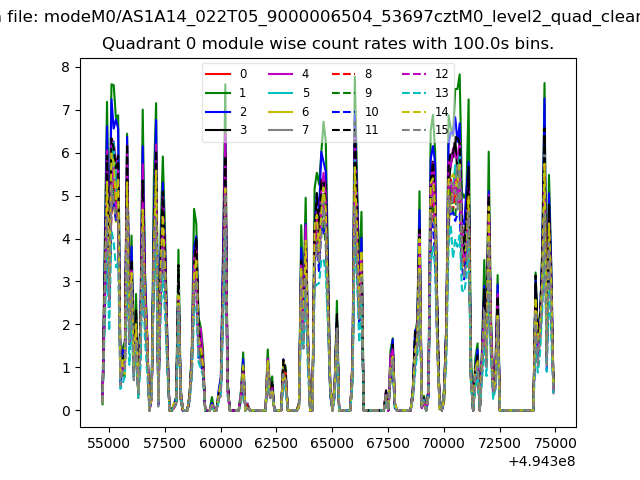
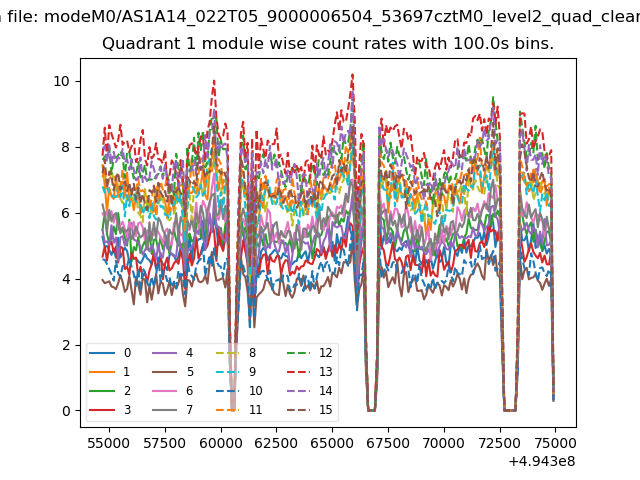
| Module-wise count rates for Quadrant A Data is divided into 100 sec bins |
 |
 |
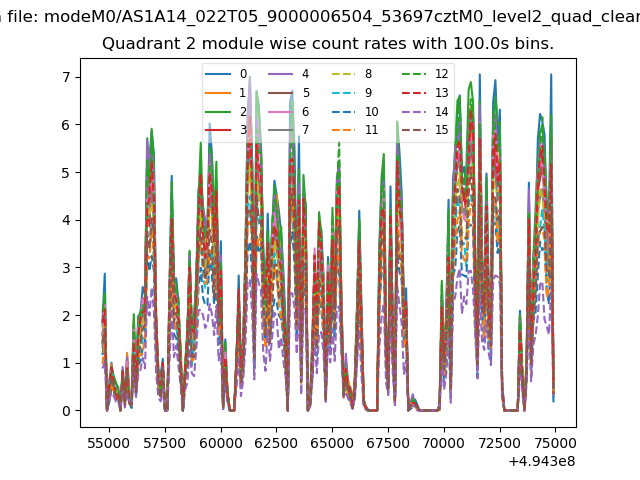
| Module-wise count rates for Quadrant B Data is divided into 100 sec bins |
 |
 |
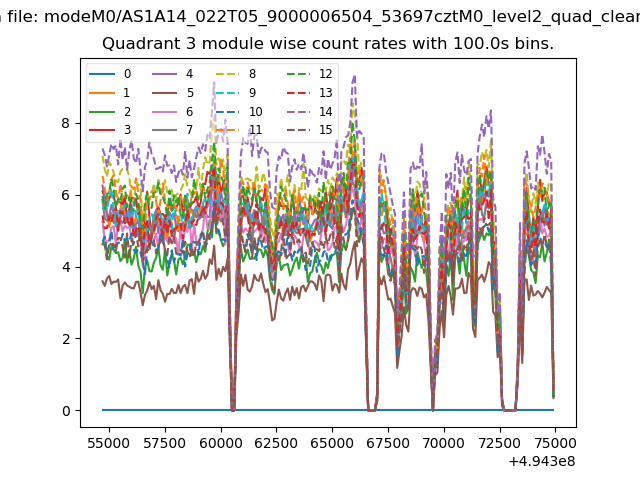
| Module-wise count rates for Quadrant C Data is divided into 100 sec bins |
 |
 |
| Module-wise count rates for Quadrant D Data is divided into 100 sec bins |
 |
 |
| Parameter | Plot |
|---|---|
| CZT HV Monitor | 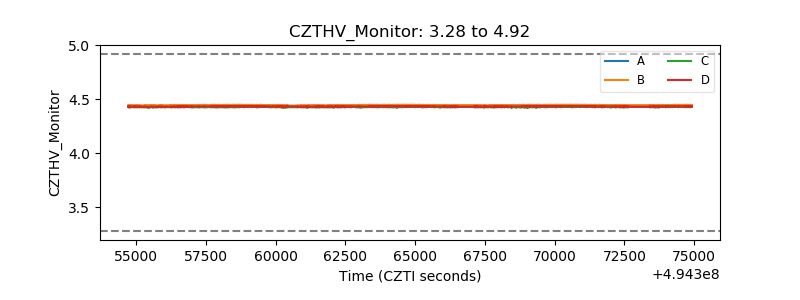 |
| D_VDD | 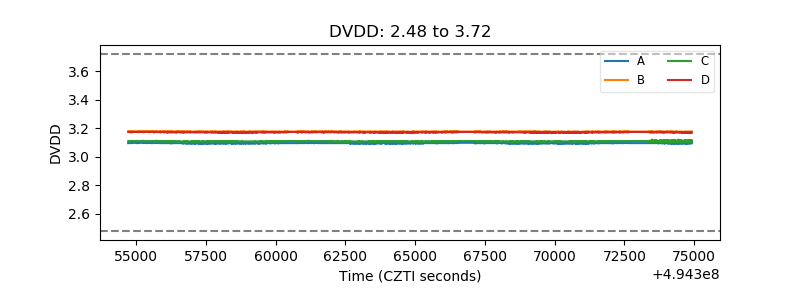 |
| Temperature 1 | 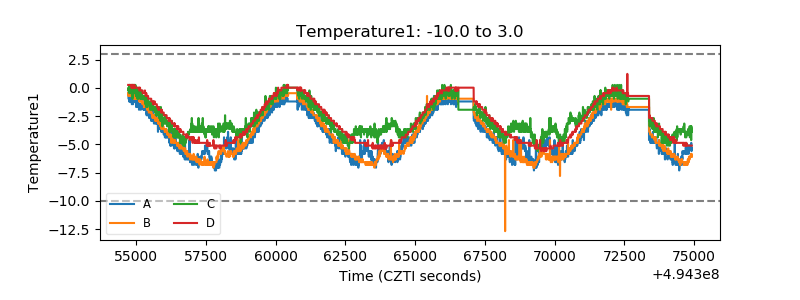 |
| Veto HV Monitor | 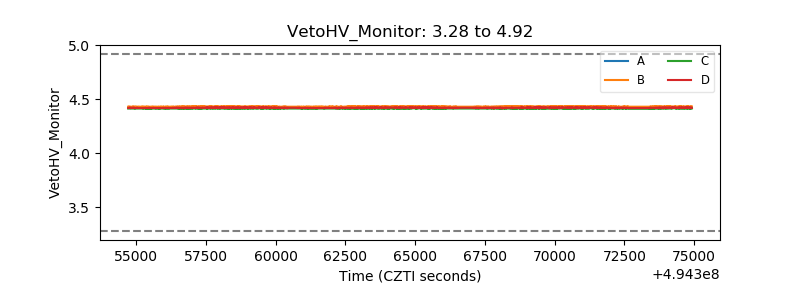 |
| Veto LLD | 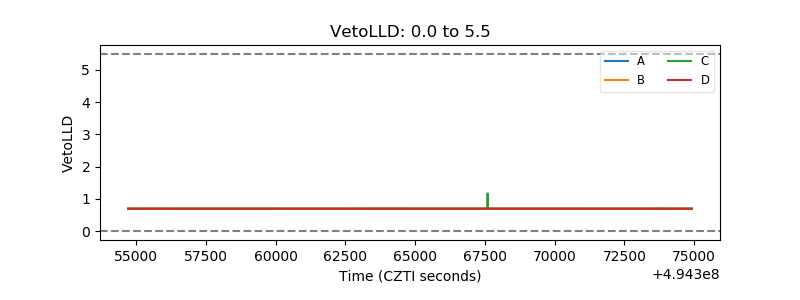 |
| Alpha Counter | 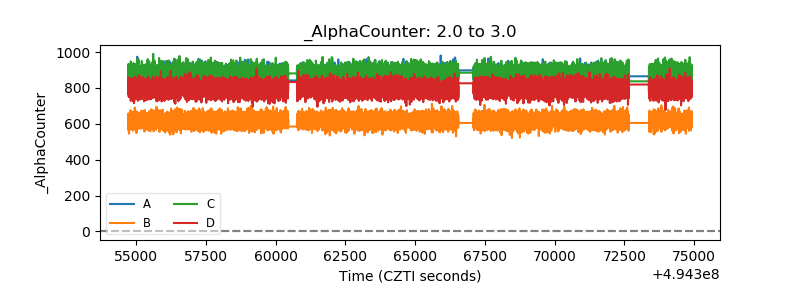 |
| _CPM_Rate | 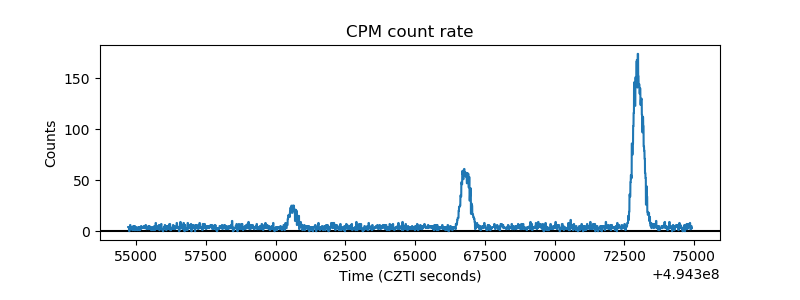 |
| CZT Counter | 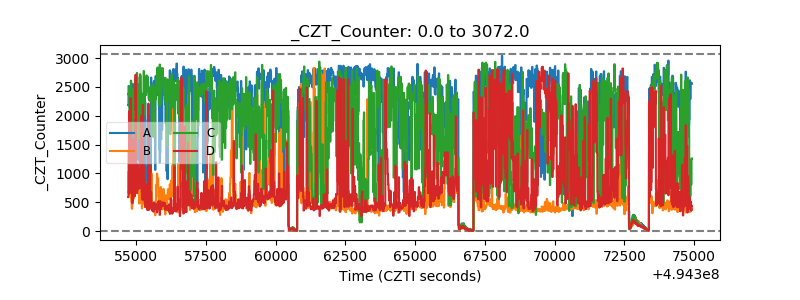 |
| +2.5 Volts monitor |  |
| +5 Volts monitor | 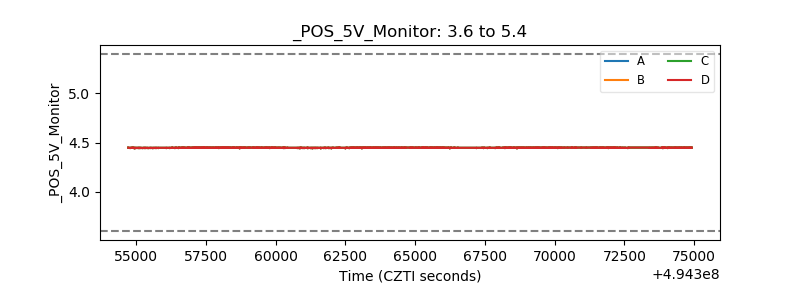 |
| _ROLL_ROT | 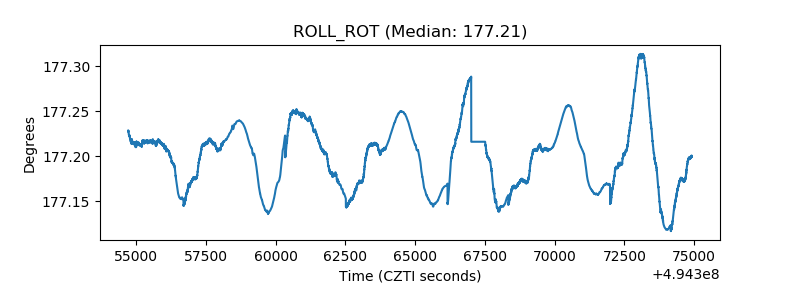 |
| _Roll_DEC | 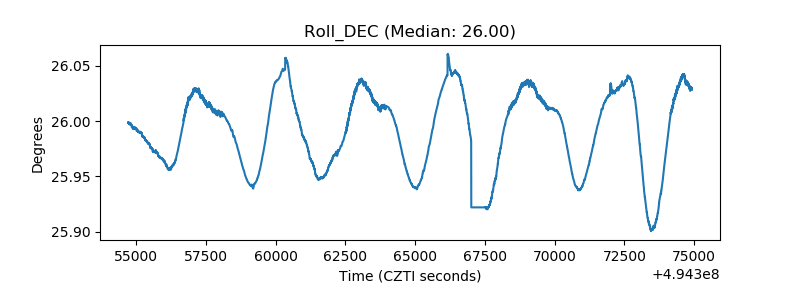 |
| _Roll_RA | 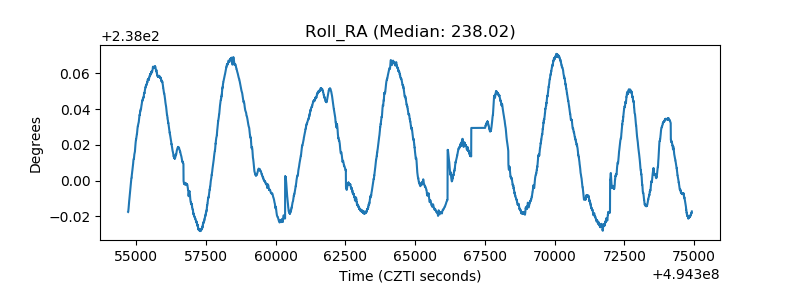 |
| Veto Counter | 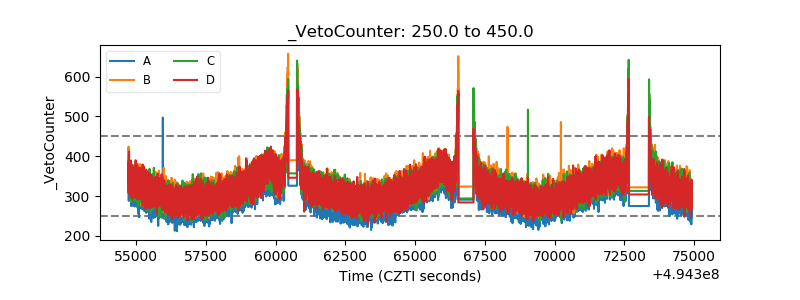 |