| Param | Original file | Final file |
|---|---|---|
| Filename | modeM0/AS1A14_022T05_9000006504_53698cztM0_level2.fits | modeM0/AS1A14_022T05_9000006504_53698cztM0_level2_quad_clean.evt |
| Size (bytes) | 1,026,806,400 | 78,042,240 |
| Size | 979.2 MB | 74.4 MB |
| Events in quadrant A | 13,717,504 | 341,729 |
| Events in quadrant B | 5,569,547 | 613,669 |
| Events in quadrant C | 12,370,873 | 353,979 |
| Events in quadrant D | 5,807,236 | 562,168 |
| Mode SS | |||
|---|---|---|---|
| Quadrant | BADHDUFLAG | Total packets | Discarded packets |
| A | 0 | 142 | 0 |
| B | 0 | 142 | 0 |
| C | 0 | 142 | 0 |
| D | 0 | 142 | 0 |
| Mode M9 | |||
|---|---|---|---|
| Quadrant | BADHDUFLAG | Total packets | Discarded packets |
| A | 0 | 11 | 0 |
| B | 0 | 11 | 0 |
| C | 0 | 11 | 0 |
| D | 0 | 12 | 0 |
| Mode M0 | |||
|---|---|---|---|
| Quadrant | BADHDUFLAG | Total packets | Discarded packets |
| A | 0 | 45662 | 6 |
| B | 0 | 21694 | 10 |
| C | 0 | 41635 | 2 |
| D | 0 | 22165 | 15 |
| Quadrant | Total seconds | Saturated seconds | Saturation percentage |
|---|---|---|---|
| A | 7053 | 3675 | 52.105487% |
| B | 7052 | 1007 | 14.279637% |
| C | 7053 | 3389 | 48.050475% |
| D | 7050 | 513 | 7.276596% |
Noise dominated data is calculated using 1-second bins in cleaned event files. If a bin has >2000 counts, and if more than 50% of those come from <1% of pixels, then it is considered to be noise-dominated and hence unusable.
| Quadrant | # 1 sec bins | Bins with >0 counts | Bins with >2000 counts | High rate bins dominated by noise | Noise dominated (total time) | Noise dominated (detector-on time) | Marked lightcurve |
|---|---|---|---|---|---|---|---|
| A | 7917 | 7052 | 3831 | 3831 | 48.39% | 54.33% | 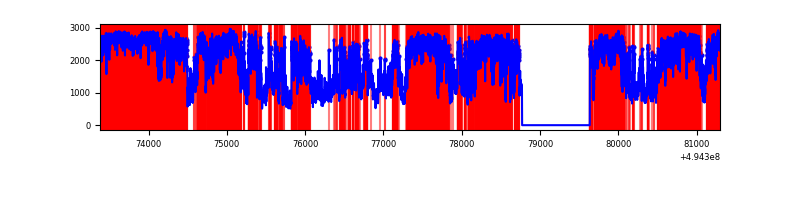 |
| B | 7917 | 7051 | 861 | 861 | 10.88% | 12.21% | 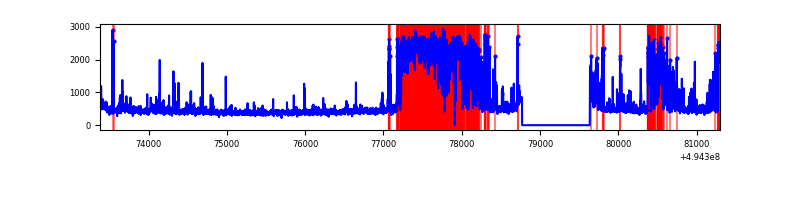 |
| C | 7917 | 7052 | 3383 | 3383 | 42.73% | 47.97% | 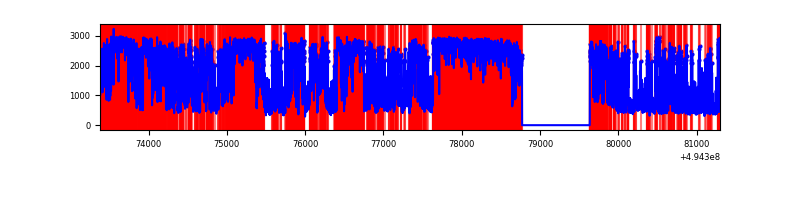 |
| D | 7918 | 7052 | 529 | 529 | 6.68% | 7.50% | 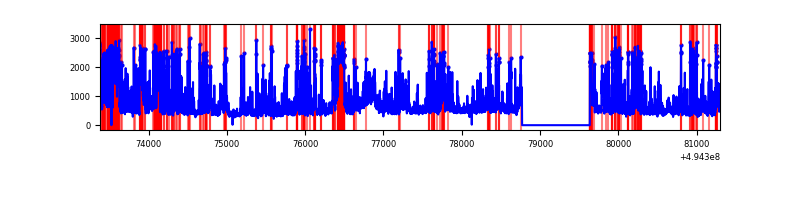 |
Top three noisy pixels from each quadrant. If the there are fewer than three noisy pixels in the level2.evt file, extra rows are filled as -1
| Pixel properties | Quadrant properties | ||||||
|---|---|---|---|---|---|---|---|
| Quadrant | DetID | PixID | Counts | Sigma | Mean | Median | Sigma |
| A | 3 | 63 | 8158134 | 56620.98 | 576 | 562 | 144.1 |
| A | 3 | 78 | 2517336 | 17468.71 | 576 | 562 | 144.1 |
| A | 14 | 254 | 465840 | 3229.45 | 576 | 562 | 144.1 |
| B | 5 | 185 | 2350123 | 15659.17 | 692 | 667 | 150.0 |
| B | 4 | 81 | 253513 | 1685.22 | 692 | 667 | 150.0 |
| B | 0 | 182 | 42838 | 281.07 | 692 | 667 | 150.0 |
| C | 1 | 241 | 4158416 | 27864.15 | 535 | 530 | 149.2 |
| C | 15 | 224 | 3828635 | 25654.12 | 535 | 530 | 149.2 |
| C | 13 | 3 | 1147403 | 7685.79 | 535 | 530 | 149.2 |
| D | 2 | 37 | 1202320 | 5887.88 | 706 | 675 | 204.1 |
| D | 7 | 70 | 347033 | 1697.1 | 706 | 675 | 204.1 |
| D | 1 | 241 | 323783 | 1583.18 | 706 | 675 | 204.1 |
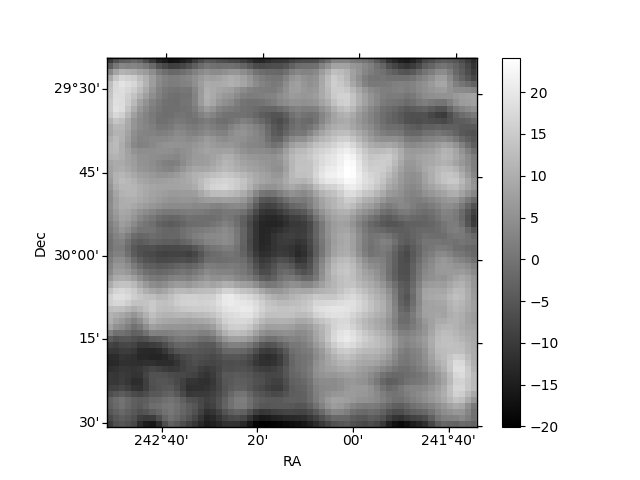
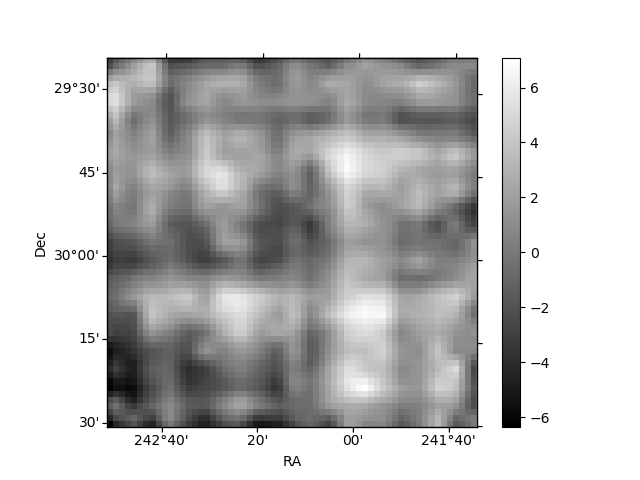
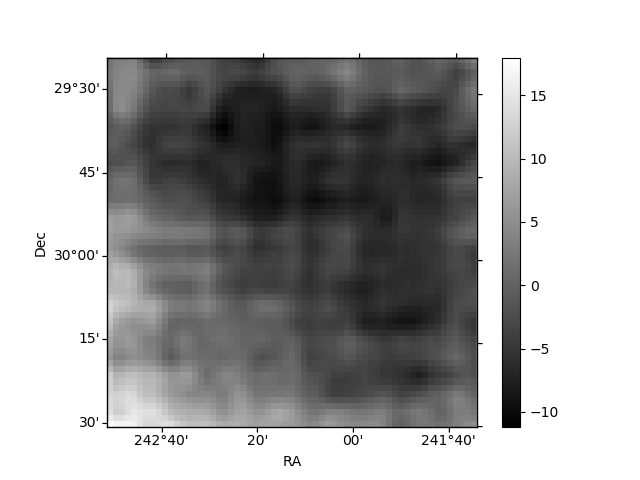
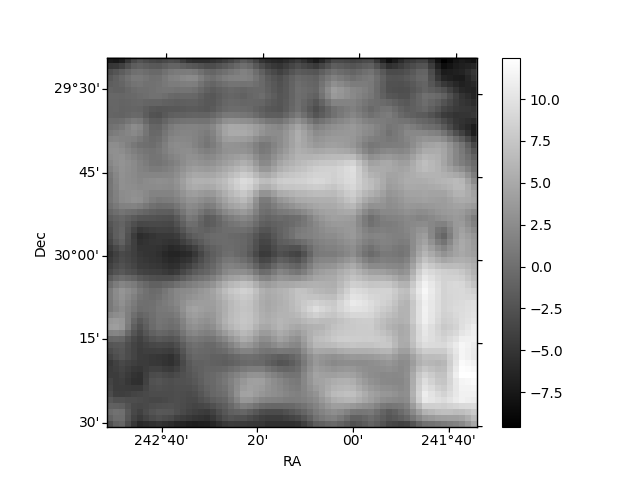
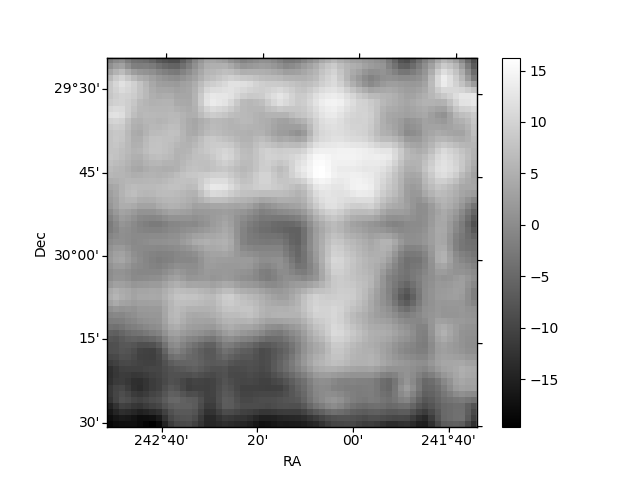
Histogram calculated using DETX and DETY for each event in the final _common_clean file
| Quadrant A | 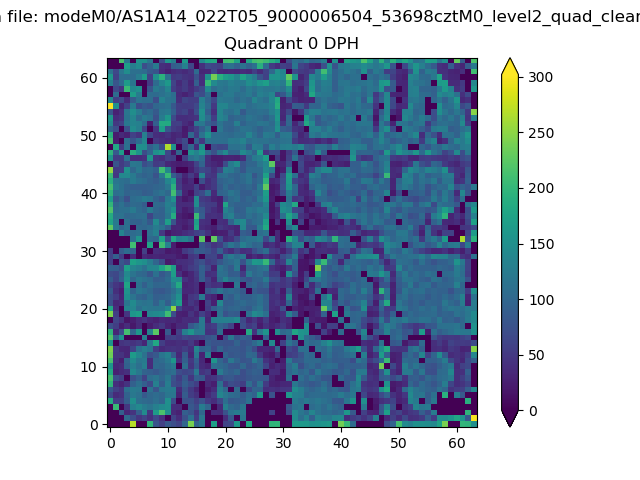 |
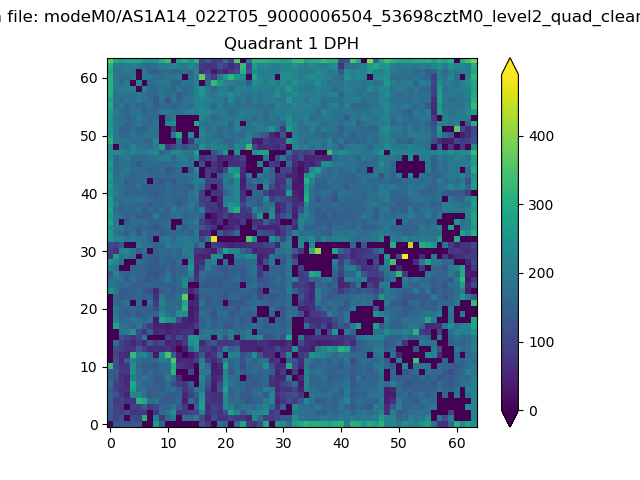 |
Quadrant B |
|---|---|---|---|
| Quadrant D | 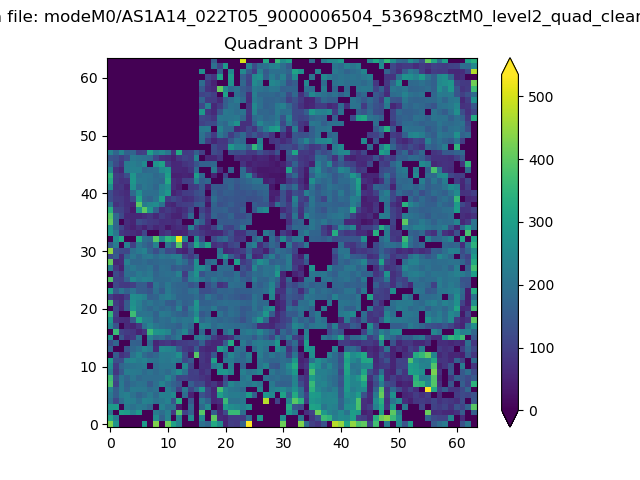 |
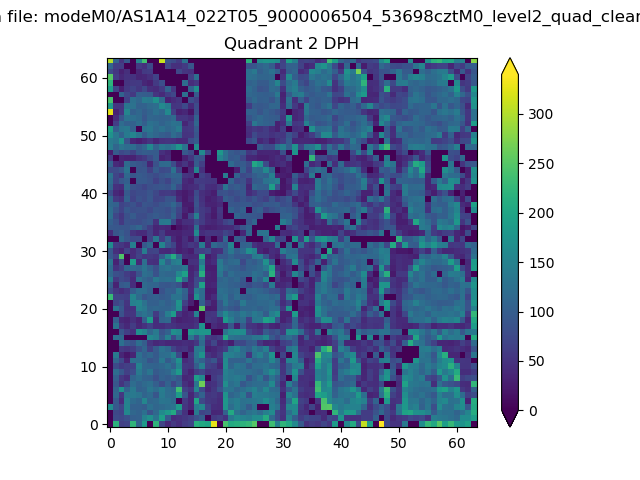 |
Quadrant C |
| Plot type | Count rate plots | Images |
|---|---|---|
| Comparison with Poisson distribution Blue bars denote a histogram of data divided into 1 sec bins. Red curve is a Poisson curve with rate = median count rate of data. |
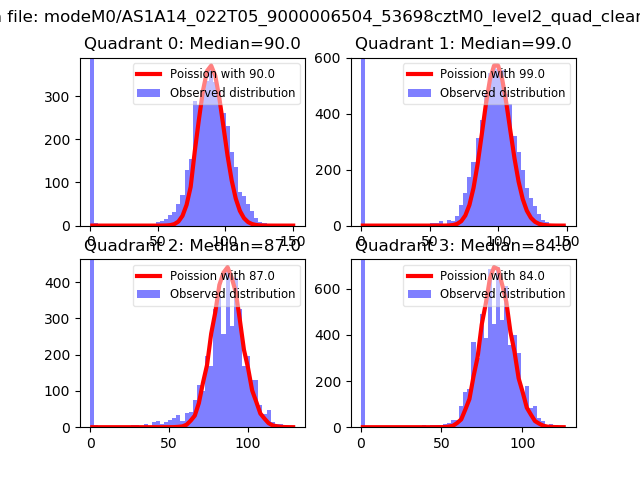 |
 |
| Quadrant-wise count rates Data is divided into 100 sec bins |
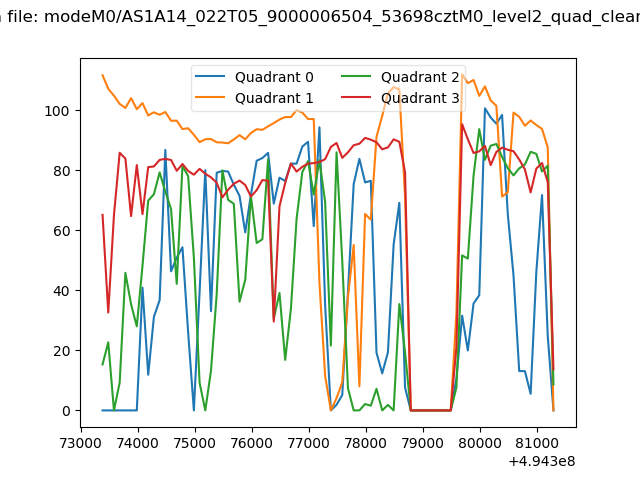 |
|
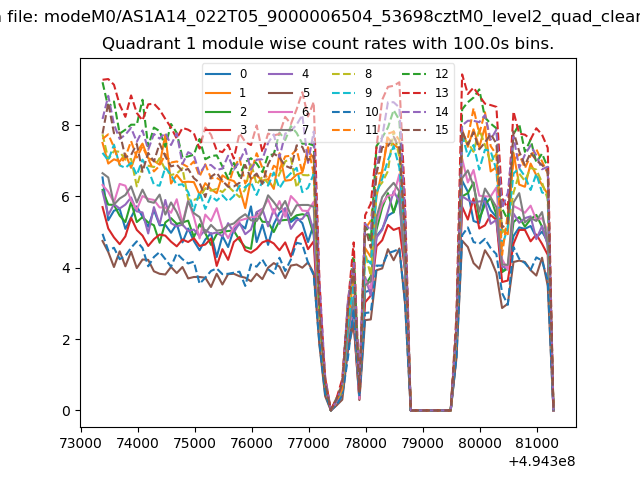
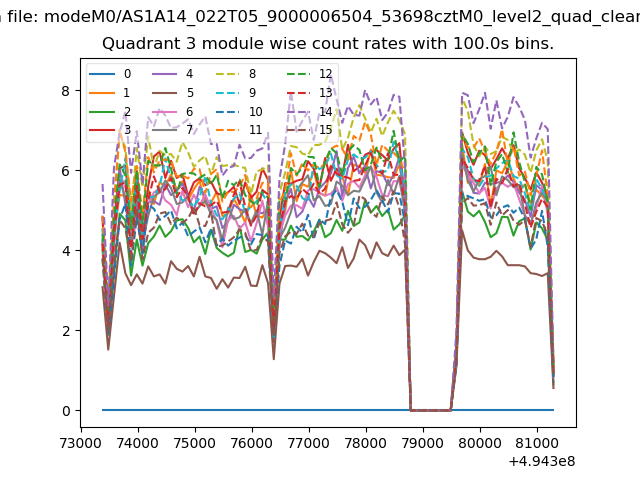
| Module-wise count rates for Quadrant A Data is divided into 100 sec bins |
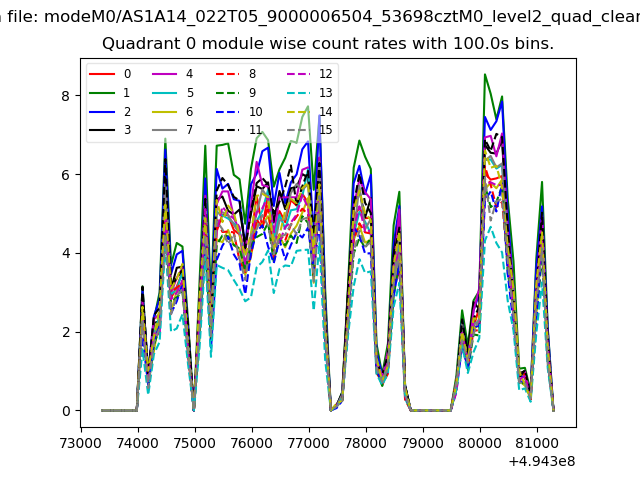 |
 |
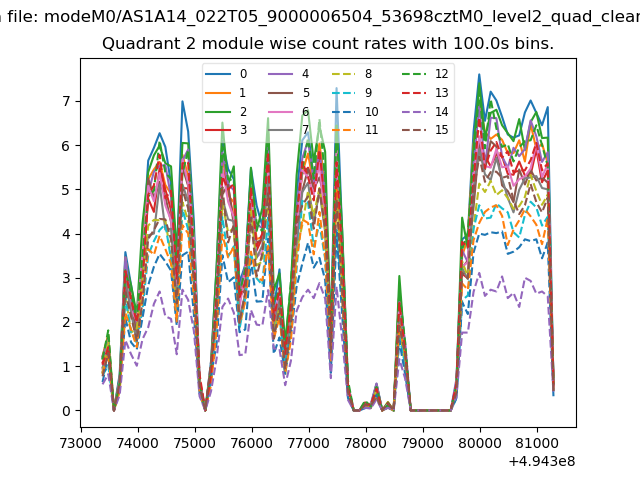
| Module-wise count rates for Quadrant B Data is divided into 100 sec bins |
 |
 |
| Module-wise count rates for Quadrant C Data is divided into 100 sec bins |
 |
 |
| Module-wise count rates for Quadrant D Data is divided into 100 sec bins |
 |
 |
| Parameter | Plot |
|---|---|
| CZT HV Monitor | 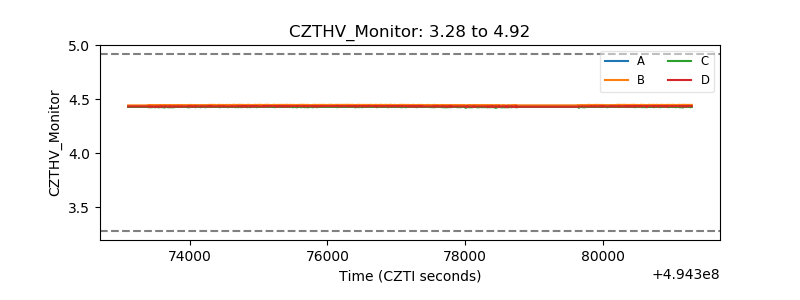 |
| D_VDD | 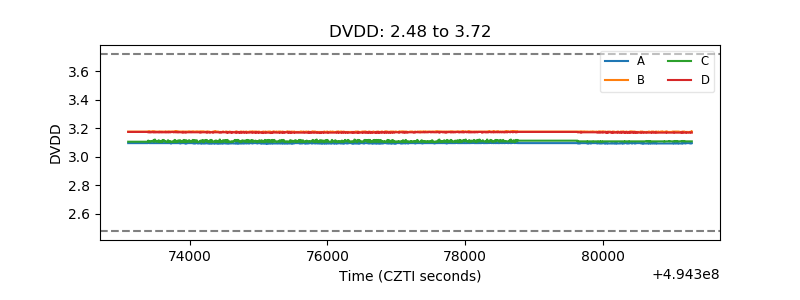 |
| Temperature 1 | 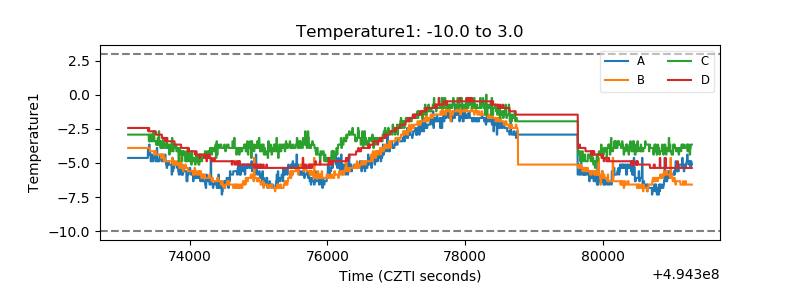 |
| Veto HV Monitor |  |
| Veto LLD | 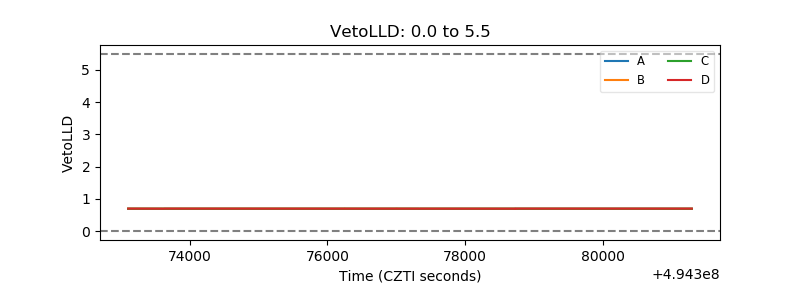 |
| Alpha Counter | 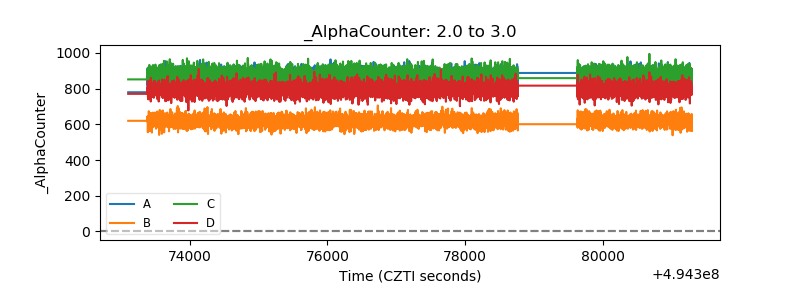 |
| _CPM_Rate | 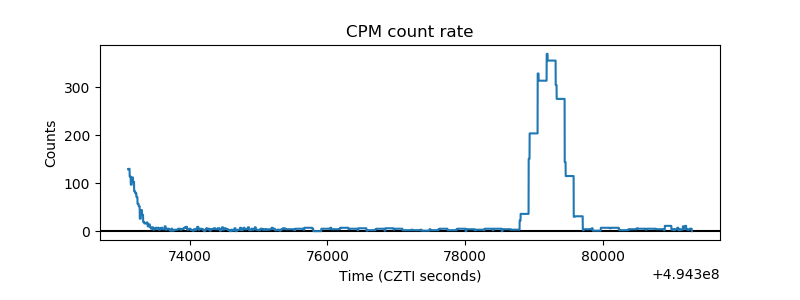 |
| CZT Counter | 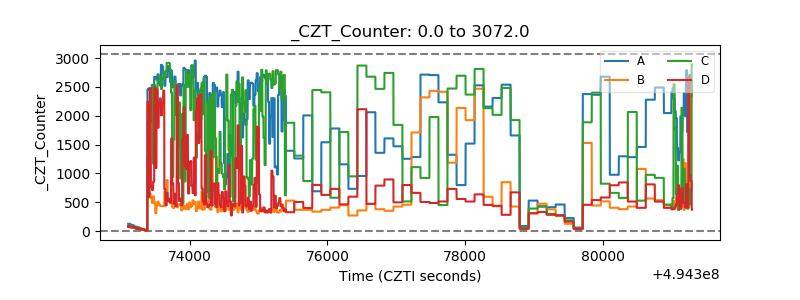 |
| +2.5 Volts monitor |  |
| +5 Volts monitor |  |
| _ROLL_ROT | 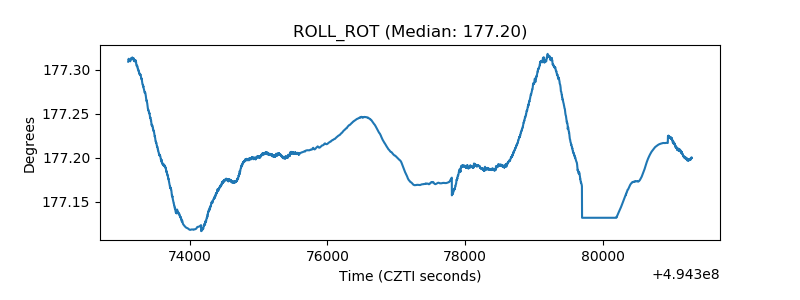 |
| _Roll_DEC | 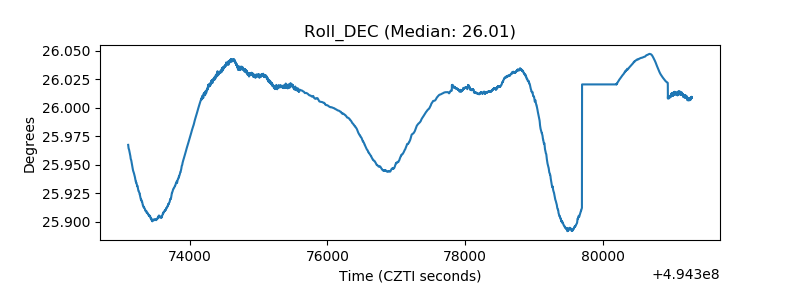 |
| _Roll_RA | 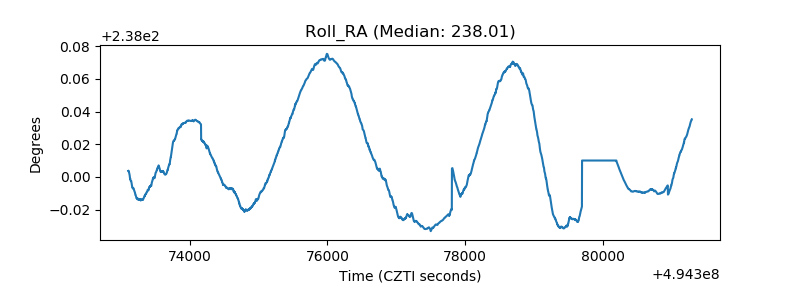 |
| Veto Counter | 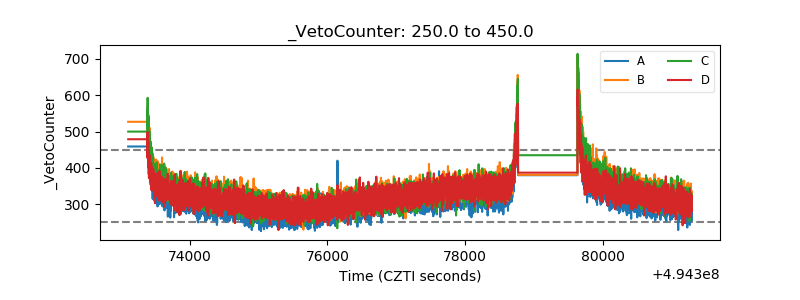 |